Correlation of Volcanic Benches and Implication on the Development of the Akaroa Volcanic Complex
←
→
Page content transcription
If your browser does not render page correctly, please read the page content below
Correlation of Volcanic Benches and Implication on the Development of
                    the Akaroa Volcanic Complex
                         Matthew Sumner1, 2 and Sam Hampton1
                1
                 Department of Geological Sciences, University of Canterbury
                       2
                         Department of Geoscience, Skidmore College

Abstract
       The Akaroa Volcanic Complex on Banks Peninsula has numerous identifiable
volcanic benches that can help to pick out volcanic packages and pinpoint eruptive
centers. As the idea of volcanic benches is a relatively new one, the previous methods for
determining their locations are fairly limited. Much of identification process can be done
using a number of different methods in ArcMap. A method for locating these benches
was determined by experimenting with methods to pick out the benches in Okains Bay.
In order to do this, areas with slopes of between five and 17 degrees can help to narrow
down possible bench locations. Once these areas of lesser slopes are isolated, areas
where there is an above average horizontal distance between contour lines were picked
out to again narrow the possible locations of benches. Comparing the results of these
methods with photos taken in the field and with satellite imagery makes it possible to
pick out the exact locations of volcanic benches in Okains Bay and hopefully in the
future, all volcanic benches throughout the Akaroa Volcanic Complex.

Introduction
       Volcanic benches are new to volcanic geomorphology and only one other method
has been used to identify these features. In order to validate the idea behind volcanic
benches, more research and more accurate methods are required for identifying these
benches. ArcMap and satellite imagery have made it possible to develop a method for
picking out benches accurately and using their locations to help understand the
development of volcanic complexes, specifically, that of Akaroa. Identifying volcanic
benches makes it possible to pick out eruptive packages that can be traced across valleys
and eventually up valleys to help pinpoint eruptive centers.
       Hampton and Cole (2008) bring up the technique of mapping horizons “that
represent significant time and compositional/rheological changes between eruptive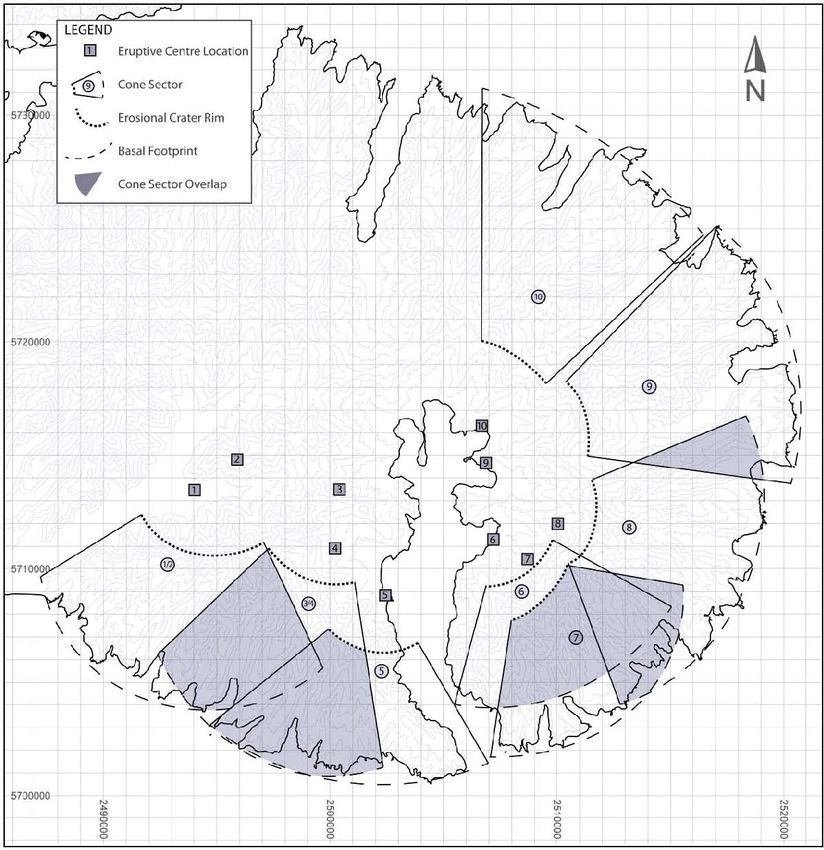
products”. In this research the horizons, or benches, were picked out using aerial
photographs and field observations. In terms of actually developing a method for
isolating these benches, the only prior research has been done by Metcalfe (2013). This
method separated stream networks based on the locations of knick points and delineated
eruptive packages and benches based on the locations of these knick points. With these
data Metcalfe was able to identify 5 eruptive packages that were characterized by
bluffs and decreased stream incision. This method was very basic and was not entirely
successful in accurately picking out volcanic benches.
       Other methods for identifying eruptive centers and determining the evolution of
volcanic complexes have been used and created by Hampton (2010) and Hampton and
Cole (2008). These methods look at previously known volcanic geomorphological
features such as ridges, valleys, lava flows, scoria cones, and dykes, etc., to determine the
development of the Lyttelton Volcanic Complex. Hobbs (2012) shows a preliminary
mapping of Akaroa, focusing specifically on Okains Bay. Much of Hobbs’ information
and methods come from Hampton and Cole (2009) and Hampton (2010). By GIS
mapping the ridges and valleys of Akaroa, Hobbs was able to determine the possible
locations of ten eruptive centers in Akaroa. A map of lava horizons, or benches
added to Hobbs’ (2012) predictions of eruptive centers should help to understand
the eruptive history of the Akaroa Volcanic Complex.

Geologic Setting
       Banks Peninsula is located on the east coast of the South Island of new Zealand at
43° 40’ S latitude and 172° 45’ E longitude (Hampton, 2010). The volcanic activity of
Akaroa Volcanic Complex and the Lyttelton Volcanic Complex created the majority of
Banks Peninsula and its landscape (Hobbs, 2012). Before the rise of volcanics in the
area, what would become Banks Peninsula was made up of the Torlesse Supergourp. The
Torlesse Supergourp was deposited in a submarine fan complex as sandstone, mudstone,
and chert. Banks Peninsula was created in the Miocene when tectonic activity in the
South Island lead to compression, and an increase in alkali and theoleiitic volcanism.
This intraplate volcanism led to the creation of both Banks Peninsula and Dunedin
volcanic complexes. The volcanic landscape of Banks Peninsula was connected to the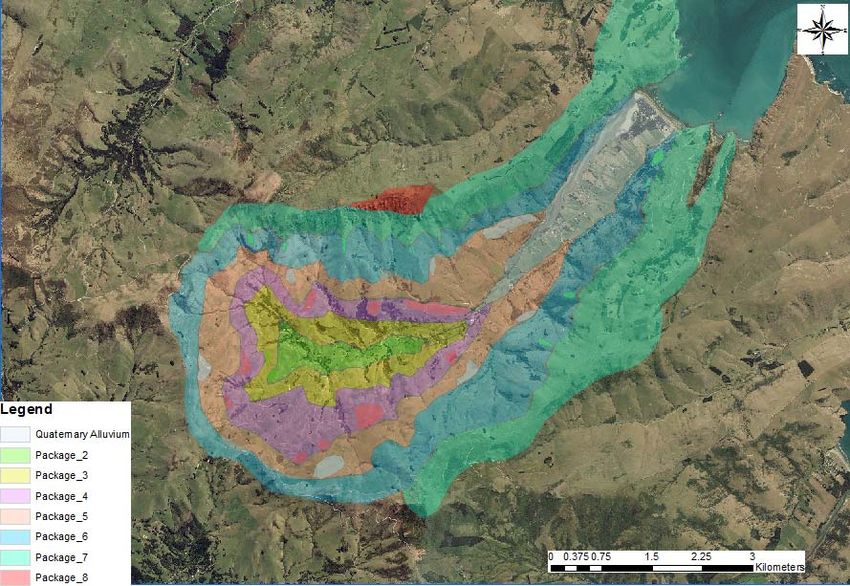
mainland of the South Island through deposition of alluvial gravels by glaciation and
river deposition (Hampton, 2010). The major geologic groups as well as a stratigraphic
column of Banks Peninsula can be seen in Figures 1 and 2 respectively. The Akaroa
Volcanic Complex was active between 9.1 and 8 million years ago. This activity
produced a composite strato-shield cone with an area of ~12,000 km3 that may have
reached as high as 1,800m above sea level. Recent work done by Hobbs (2012) has
shown that there were numerous eruptive centers responsible for the creation of the
Akaroa Volcanic Complex.
Methods
The original goal of this research was to determine a method that could isolate
volcanic benches in ArcMap. In order to do this a number of tools were used to create a
map capable picking out these benches. Aerial photos and a Digital Elevation Model
(DEM) were used to create a base map that could be modified to highlight benches
running throughout Akaroa. In order to determine this method before applying it to all of
Akaroa, Okains Bay was used as a model. Oblique photos were taken throughout Okains
Bay in order to prove the existence of, and provide visual field evidence of these benches
(Figure 3).
The DEM was used to create a layer showing the slope of the area. This layer
was then reclassified to separate the slope into two categories; slopes of 10-17 degrees,
and everything else. By coloring the slopes that were not between 10 and 17 degrees
black, and giving the slopes between 10 and 17 degrees no color, the map now showed
only areas that had the same slope as benches have. After a comparison of the areas
picked out by the slope reclassification and satellite imagery from Google Earth, it was
discovered that some benches were not being picked out because they had a lower slope
than 10 degrees. A new reclassified slope layer was then made that isolated slopes
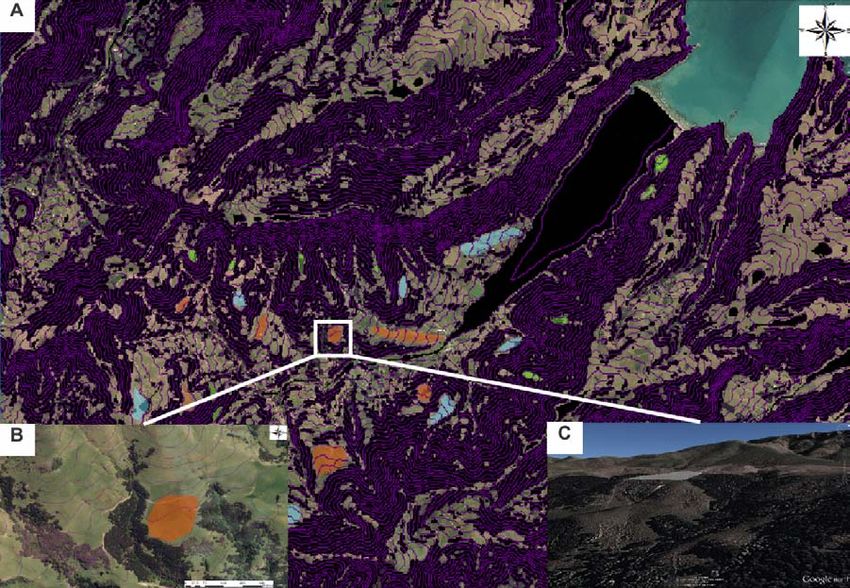
between 5 and 17 degrees (Figure 4A). While this slope isolation helped to pick out
bench locations, it could not narrow the map down enough to just pick out benches, as
there were many locations that were not benches that had a slope of between 5 and 17
degrees. The idea for this method was taken from Hutchins et. al (2012), who used this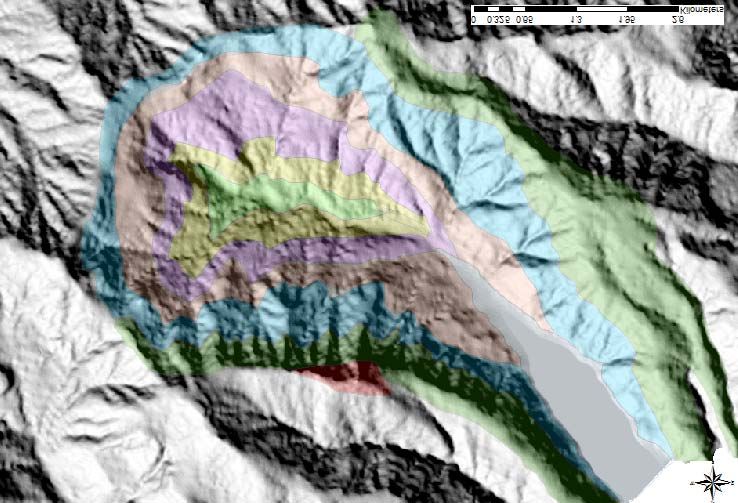
method to isolate river terraces, geomorphic features that have similar
topographies to lava benches.
       Slope aspect was the next layer that was created to further isolate the benches.
This layer showed the slope direction of the landscape, and while it was able to pick out
some benches, the benches in each valley system were not uniform enough to make sure
that benches with slightly different aspects were not being kicked out of the results.
       The only previous method used for picking out volcanic benches was Metcalfe’s
(2013) use of stream knick points. To recreate this method, stream networks within
Okains Bay were identified using ArcMap. Looking at the locations of knick points in all
of the streams it was clear that knick points did often seem to occur where benches were
located, but were also found in numerous locations where there were no benches visible
in either photos or satellite imagery.
       Next, a 20m contour layer was created using the DEM. With this contour
overlaying the map with some easily identifiable benches already picked out, it was
discovered that the spacing and shapes of the contour lines could be used to identify the
locations of benches. Areas along the valley sides that had wider than average spacing
between contours almost always picked out benches. Areas where contours jutted out in
square shapes also tended to help pick out less obvious benches (Figure 4B). Though this
was very helpful in picking out benches, it is either impossible or very complicated to
automate a method for isolating these areas in ArcMap.
       Though a quick and easy system for isolating volcanic benches could not be
created, using these methods still made it possible to pick out benches manually.
Isolating the slopes that could contain benches, and then finding wide spacing between
contours within these isolated slope areas gave a pretty good idea of where benches were
located. Cross-referencing these locations with Google Earth made it possible to locate
all obvious benches throughout Okains Bay (Figure 4C).
       Once benches were located using these methods they were highlighted by
drawing polygons around their edges (Figure 4B). Once again using Google Earth, along
with spot heights taken from ArcMap it was possible to correlate these benches, tracing
them up and across the valley system. After color-coding these benches, they were
separated into eruptive packages that began at the tops of benches and extended down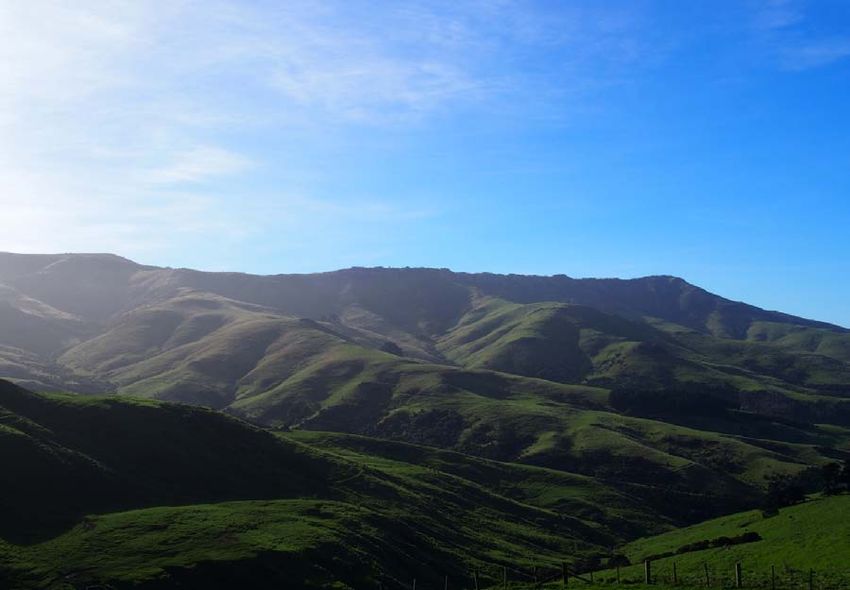
towards the tops of the next benches. These packages were also outlined by polygons in
ArcMap and the entire valley of Okains Bay was separated into 7 different eruptive
packages (Figure 5). Certain attributes were extracted from every bench within these
packages using model builder and the zonal statistics tool. The attributes that were
extracted included average height, average aspect, and average slope (Figure 6).
          Once these packages were established, spot heights at the tops of benches were
correlated across the valley system. Spot heights were taken at the tops of most major
benches, and the same spot height at the top of the same package was found on the other
side of the valley. When lines were drawn in between these spot heights, the general
orientation of each package became noticeable (Figure 7).
          Another method, employing spot height correlation, used by Hampton (2010) was
then used to get more accurate package orientations and pick out the locations of eruptive
centers. The map showing eruptive packages and benches with a 50m contour was
exported to CorelDraw. The intersections of the tops of each package with every 100m
interval were marked out on both sides of the valley. With these spot heights picked out,
circles were drawn, whose arcs transected correlating spot heights for each package.
Using arcs as opposed to the straight lines used in the previous step created a more
accurate representation of a volcanic cone and thus was more successful in picking out
eruptive centers. The centers of these circles picked out the eruptive centers of the
packages (Figure 8A). Cross sections of the arcs crossing Okains Bay Valley were made
for each package, showing the slope of the cone produced by each package (Figure 8B).
The slope of the rest of the cone was projected from the point of the highest contour to
the eruptive center at a concave up profile, a shape suggested by Davidson and De Silva
(2000) and used by Hampton (2010) in his reconstruction of the Lyttelton Volcanic
Complex.

Results
          This research has resulted in a method that can accurately isolate volcanic
benches on a small scale. By isolating benches in Okains Bay, a detailed and accurate
map of eruptive packages was produced, improving on a previous map of eruptive
packages made by Metcalfe (2013). This map of benches and eruptive packages made it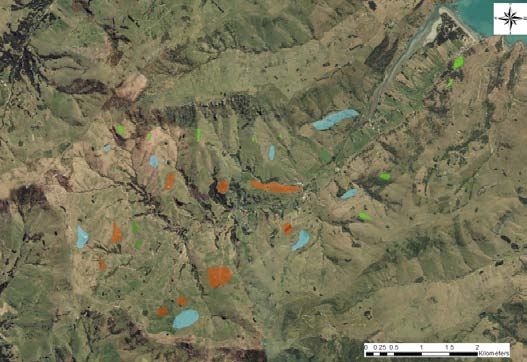
possible to show how these benches correlate across valley systems. The matching of
spot heights across the valley in Okains Bay shows a correlation between packages and
the angles of the lines connecting the spot heights.
       The attributes that were extracted from the benches sometimes showed a
correlation across valley, but were often skewed by unexpected results. While the slope
angle of the benches tended to remain somewhat constant across the benches, the slope
aspects were extremely inconsistent. The average heights that were extracted could be
used to pick out a couple of benches across the valley from each other.
       The centers of the circles correlating spot heights projected the eruptive centers
for the three most well defined packages in the same general location in the North-East of
Akaroa Harbour. Within each package, the projected eruptive centers were generally
within about 500m of each other. The cross sections, showing the slope of the cone after
the deposition of each eruptive package, showed slopes of between 6 and 7 degrees up
the valley, which were then projected and increased first to 12 degrees, and then to 20.
These projections of cone slope showed a growing cone with the deposition of each new
eruptive package.

Discussion and Implications
       The attributes shown in Figure 6 did not help much in predicting the eruptive
center locations of the lava packages for a couple of possible reasons. One of these being
that the lava benches from which the attributes are taken are erosive features that do not
have the same attributes that they did when they were created. Another possible reason is
that the outlines of these benches in GIS may have contained areas that were not part of
the bench, or did not contain the entire bench. In order to improve on this method, it may
be necessary to map out these benches in the field and in GIS in order to appropriately
constrain the outlines of the benches. If reasonable and consistent slope attributes can be
determined, these angles should be able to show the direction that each package came
from. These data paired with appropriate slope angles could ideally help to locate the
eruptive centers.
       The orientations of the spot height correlations that were obtained provided
promising evidence that these spot heights could be used to predict the locations of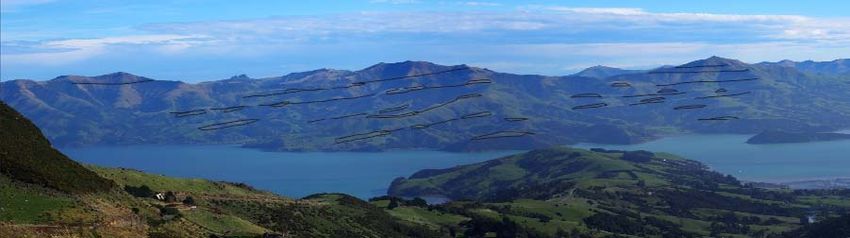
previous eruptive centers. The difficulty of using this method to determine eruptive
centers, however, is that it is difficult to determine how large the “cones” should be
made. Though Hobbs’ (2012) map helped with this, not all eruptive centers were able to
be established, indicating either that there are more eruptive centers that were not mapped
by Hobbs, or that the orientations taken from the spot height correlations may not be
accurate.
        The use of 100m spot height correlations and circle projection provided more
accurate and reasonable locations of eruptive centers. These predicted centers correlate
well with the location of Hobbs’ (2012) 10th eruptive center (Figure 9). The fact that
each eruptive center is within the same general area, but with slight variations, could be a
result of different vents on the same cone producing each package. The cross sections
produced from the 100m contours of each package show a growth in cone height and
radius with the deposition of each package.
        This cone growth model can help to recreate the construction of the Akaroa
Volcanic Complex if all packages can be defined well enough to create spot height
contours. As there was at least one more package deposited above the last contoured
package, it can be expected that the cone likely grew between another 100-200 m.
Linking these new data showing eruptive packages and their eruptive centers to
geochemical data obtained by Johnson (2012) will provide an extremely accurate analysis
of the eruptive history of this 10th eruptive center.
        Akaroa Harbour shows one of the most obvious displays of volcanic benches
throughout Akaroa as can be seen in Figure 10. In this photograph it is clear to see easily
defined eruptive packages, originating from areas around the harbour and stacking up as
they slope southwest, away from the harbour and towards the ocean. Picking out the
slope and slope orientations of these benches, and then relating this to the geochemistry
of each package will help to figure out the eruptive history of the major eruptive centers
from around Akaroa Harbour.
        The new method of locating volcanic benches can next be used to pick out
benches and then eruptive packages throughout all of Akaroa. Using the hundred meter
spot height contours to predict the locations of more eruptive centers throughout Akaroa
should correlate with other eruptive centers picked out by Hobbs (2012). This can help in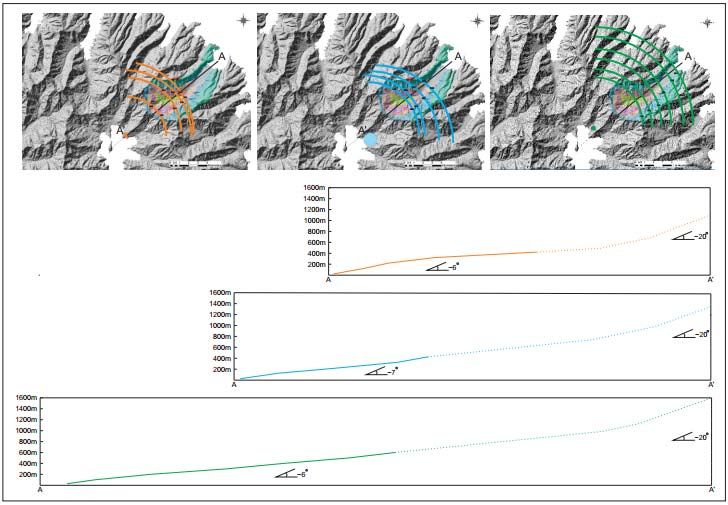
determining the growth, structure, and evolution of the Akaroa Volcanic Complex. The
success of these methods using Okains Bay, and then Akaroa, as case studies could result
in the method being adopted as a new technique for researching and reconstructing
volcanic landscapes and geomorphologies.
Figures

Figure 1. Basic Geologic Map of Banks Peninsula, showing major volcanic deposits and
basement rock, based on Hampton (2010).
Figure 2. Stratigraphic column of Banks Peninsula from Hampton (2010).
Figure 3. View from the SSW side of Okains Bay valley looking NNE, picking out
lava benches.
Figure 4. A) Map of Okains Bay showing slope isolation of slopes between 5 and 17
degrees with major benches outlined and color coded by package. B) Close up of a
bench determined by spacing between contours. C) A view of the same bench in Google
Earth.

Figure 5. Eruptive Packages throughout Okains Bay outlined in ArcMap.
Figure 6. Numbered Benches on ArcMap, and graphs showing their average height,
slope, and aspect.
                                           49

                                                                295m
                                            0m

                                                              1 36
                                                               m

                                                21
                                                       213m

                                                  9m                 35
                                           51

                                                                       6m
                          447m

                                             5m

                                           53
                                              2m
                                  31
                 498m

                                    0m
                        35
                          6m

                                 64
                                      0m
                        39
                          7m

Figure 7. Spot height correlation from the tops of the three most accurately
identified packages across the Okains Bay Valley.
A. B. Figure 8. A) Circular contours are projected for the three best-defined packages over spot heights at 100m intervals. Eruptive centers are represented by the colored circles. B) Cross sections are made using the contour lines, projected from the first contours to the predicted eruptive centers. Dotted lines show projected slope of the cone after the last contour.
Figure 9. Cone sectors and eruptive centers of the Akaroa Volcanic Complex taken
from Hobbs (2012)

Figure 10. View across Akaroa Harbour looking east as the sun picks out numerous
benches that dip southwest, towards the sea and away from the harbour.
References

Davidson, J., and DeSilva, S. (2000). Composite volcanoes. In: Sigurdsson, H,
      Houghton, B., MbNutt, S.R., Rymer, H., Stix, J. (eds.), Encyclopedia of
      Volcanoes. Academic Press. California. 663-681.

Hampton, S.J. (2010). Growth, Structure and Evolution of the Lyttelton Volcanic
     Complex, Banks Peninsula, New Zealand.

Hampton, S. J., & Cole, J. W. (2009). Lyttelton Volcano, Banks Peninsula, New
     Zealand: Primary volcanic landforms and eruptive centre identification.
     Geomorphology, 104(3- 4), 284-298. Elsevier B.V.
     doi:10.1016/j.geomorph.2008.09.005

Hobbs, D.J. (2012). Remote Sensing Geomorphology of Akaroa Volcano and Detailed
      Mapping of Okains Bay, Banks Peninsula, NZ

Hutchins, M.G., Cowan, E.A., Badurek, C.A. (2012). Identification of
      Geomorphometric Assessment of Stream Terraces along the North and South
      Fork of the New River, Blue Ridge Physiographic Province. Journal of Student
      Research in Environmental Science at Appalachian. 2, 26-39.

Johnson, J. (2012). Insights into the Magmatic Evolution of Akaroa Volcano from the
      Geochemistry of Volcanic Deposits in Okains Bay, New Zealand

Metcalfe, K.S. (2013). The Origin of Banks Peninsula, New Zealand: A High-
       Resolution Geochemical Study of Intraplate Volcano Evolution.
You can also read