Monthly Bulletin of Economic Trends: Households and Household Saving - August 2018 - Melbourne Institute
←
→
Page content transcription
If your browser does not render page correctly, please read the page content below
MELBOURNE INSTITUTE
Applied Economic & Social Research

Monthly Bulletin of Economic Trends:
Households and Household Saving

August 2018
Released at 11am on 23 August 2018
Monthly Bulletin of Economic Trends – August 2018

Housing and households

              •          Consumption and disposable income: Consumption remains solid but
                         disposable income is exhibiting slow growth.

              •          Household debt: Households continue to accumulate debt, although this is
                         backed by high asset values.

              •          Housing market cools: Consumers expect lower prices but are uncertain
                         about whether to purchase.

              •          Outlook: Falling house prices are likely to continue in the short term.

                                            Table 1: Outlook for Australia1
                                              Actual                                  Forecasts               Actual   Forecast
                                  2017     2017    2017      2018         2018     2018    2018      2019      Calender Year
                                  Jun      Sep      Dec      Mar           Jun     Sep     Dec       Mar      2017      2018
Economic Activity
GDP                                2.0      2.8      2.4     3.1           2.7     2.9       3.2     2.9       2.2       3.0
                                   (1.0)   (0.5)    (0.5)    (1.0)        (0.6)    (0.8)    (0.8)    (0.7)
Household Consumption              2.7      2.7      2.9     2.9           2.6     2.6       2.3     2.6       2.7       2.6
                                   (1.0)   (0.6)    (1.0)    (0.3)        (0.6)    (0.6)    (0.7)    (0.7)
Private Dwellings                  -1.2    -2.6     -5.0     -1.0         -1.8     -0.1     -0.4     -1.7      -2.2      -0.8
                                   (0.3)   (-2.1)   (-0.1)   (0.9)        (-0.5)   (-0.4)   (-0.4)   (-0.4)
New Business Investment            1.4      8.7      6.0     3.1           4.0     2.1       4.0     5.5       3.7       3.3
                                   (0.3)   (3.1)    (-0.4)   (0.1)        (1.2)    (1.2)    (1.5)    (1.5)
Domestic Final Demand              2.6      3.6      3.3     3.2           3.0     2.9       3.0     3.1       3.0       3.0
                                   (0.9)   (0.9)    (0.8)    (0.6)        (0.8)    (0.7)    (0.8)    (0.8)
Imports of Goods & Services        6.5      8.3      7.3     4.7           6.2     4.9       4.8     5.9       7.8       5.1
                                  (-0.1)   (2.6)    (1.6)    (0.5)        (1.3)    (1.4)    (1.5)    (1.6)
Exports of Goods & Services        5.2      5.1      0.2     4.6           3.2     3.9       6.8     5.6       3.5       4.6
                                   (2.9)   (0.7)    (-1.5)   (2.4)        (1.5)    (1.4)    (1.3)    (1.3)
Inflation & Financial Market
Underlying inflation 2             1.8      1.8      1.8     1.9           1.9     2.1       2.2     2.2       1.8       2.0
                                   (0.5)   (0.4)    (0.4)    (0.5)        (0.5)    (0.5)    (0.5)    (0.6)
Headline Inflation                 1.9      1.8      1.9     1.9           2.1     2.1       2.0     2.1       1.9       2.0
                                   (0.2)   (0.6)    (0.6)    (0.4)        (0.4)    (0.6)    (0.5)    (0.6)
90-day Bill Rate 3                 1.7      1.7      1.7     1.8           2.1     2.1       2.1     2.1
Trade Weighted Index4             64.5     66.5     64.7     64.2         62.6     61.8     61.8     61.8
$A/$US rate (100)    4            0.75     0.79     0.77     0.77         0.76     0.74     0.74     0.74
Labour Market
Unemployment Rate 4                5.6      5.5      5.4     5.5           5.5     5.5       5.4     5.4       5.6       5.5
Employment Growth Rate       5     2.0      2.7      3.2     3.3           2.6     2.3       2.1     2.0       2.3       2.6
                                   (1.0)   (0.9)    (0.8)    (0.6)        (0.4)    (0.5)    (0.6)    (0.5)

Participation Rate 4              65.0     65.3     65.5     65.7         65.6     65.5     65.4     65.4      65.1      65.5
Wage Price Index                   1.9      2.1      2.1     2.1           2.1     2.1       2.2     2.4       2.0       2.1
                                   (0.6)   (0.6)    (0.5)    (0.5)        (0.5)    (0.6)    (0.6)    (0.6)

1: Actual in black and forecasts in blue; values in parentheses are quarterly growth rates. 2: As measured by the Reserve
Bank’s trimmed mean measure of inflation. 3: Average over last month in quarter. 4: Average of 3-months in the
quarter. 5: Calculated from quarterly employment numbers that are averaged over the 3 months in the quarter.
Prepared by G. Lim and S. Tsiaplias, Macroeconomics@MI. Data in this report were finalized on 21/08/2018.

                                                                     1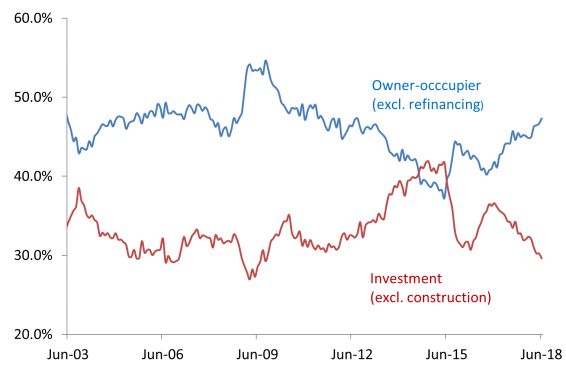
Monthly Bulletin of Economic Trends – August 2018

                                  Table 2: Key statistics for households

                                      Dec     Mar      Jun      Sep     Dec      Mar      Jun     Fiscal Year
                                     2016     2017    2017      2017    2017    2018     2018    16/17   17/18
 General

 Household consumption %pa             2.9     2.3      2.7      2.7     2.9      2.9      -      2.6     2.9

 Disposable income %pa                4.9      4.3     2.6       3.1     0.1     0.9       -      3.2     1.4

 Savings ratio                         3.7     4.0      2.4      2.3     2.3      2.1      -      3.7     2.2

 Household debt to income ratio      180.8    183.5    187.3    187.4   188.7   190.1      -     182.9   188.8

 Consumer sentiment                   97.3     99.7    96.2      97.9   103.3   103.0    102.1   98.7    101.6

 Housing

 House prices %pa                      7.7     10.2    10.2      8.3     5.0      2.0      -      7.9     5.1

 Housing debt to income ratio        133.4    134.7    136.9    137.7   139.1   140.1      -     134.2   138.9

 Housing interest payments to
                                       6.9     7.0      7.2      7.3     7.3      7.5      -      7.0     7.3
 income ratio

 Housing finance %pa                  -3.4     1.0      2.2      4.6     4.5      3.0     0.2     -0.9    3.1

 Dwellings financed by first home
                                      13.8     13.5    14.9      17.4   17.9     17.4     18.1   13.8    17.7
 buyers %

 Consumer dwelling index             102.9     99.6    90.9      95.2   100.6   104.5    105.7   100.7   101.5

 Wealth ratios

 Household assets to income          924.0    940.4    956.3    956.6   968.5   960.9      -     930.1   962.0

 Housing assets to income            505.1    514.9    528.0    527.0   531.2   526.0      -     508.6   528.1

 Household financial assets to
                                     388.4    395.0    397.8    399.0   406.8   404.5      -     391.1   403.4
 income
* Values in blue do not include (unavailable) data for June 2018 and are therefore estimates.

                                                          2
Monthly Bulletin of Economic Trends – August 2018
Household consumption is solid, but…
• In last month’s MBET we saw that State Final Demands (SFDs) had grown for three out of
the five major states in the March quarter of 2018: NSW (0.7%), VIC (1.9%), and QLD
(0.5%). In contrast, SA and WA SFDs fell by 0.2% and 1.1%, respectively. In annual terms,
four out of the five major states exhibited relatively strong growth in SFD (VIC 4.9%, NSW
3.7%, QLD 3.1% and SA 2.1%) with WA lagging due to weaker investment.
• In line with the results for the major states, aggregate consumption has remained relatively
robust, growing at 2.9% per annum for a second consecutive quarter. It therefore appears
that consumption in the 17/18 fiscal year will likely exceed that of the preceding fiscal year
(Table 2).
• There are, however, a number of warning signs regarding household consumption growth in
the short to medium term. Consistent with weak wages growth, household disposable income
increased by a mere 0.1% in the December 2017 quarter, rising to a still weak 0.9% in the
March quarter. In contrast, disposable income rose by 4.9% and 4.3% respectively for the
December 2016 and March 2017 quarters (Figure 1).
• Given the observed propensity for household spending and the weak growth of disposable
income, it is unsurprising that the household savings ratio has declined in the last few
quarters. Table 2 shows that the ratio is likely to have fallen significantly in FY17/18, from
approximately 3.7 to a value only slightly greater than 2.
• To appreciate the magnitude of the decline, Figure 2 shows the household savings ratio since
2000. The figure shows a dramatic increase during the GFC as households increased their
savings in the midst of the significant financial and economic uncertainty during this period.
Following the GFC the savings ratio stabilised but has been falling fairly rapidly in the last
few quarters.
• At the same time, the growth rate of household disposable income has also declined
suggesting that households may be constrained in terms of their ability to reduce their spend.
To glean additional information about this issue, it is useful to examine the decomposition of
household spending.
Figure 1: Household disposable income Figure 2: Savings ratio
(per capita annual growth)
Source: ABS Source: ABS
3Monthly Bulletin of Economic Trends – August 2018
• Figure 3 shows retail spend since 2010 disaggregated into food and non-food spending. In
the past few years, non-food spending has been growing at a faster pace than its food
counterpart. However, we have recently observed a shift in the spend decomposition, with
non-food retail spend growth declining significantly. Conversely, food retail spend has been
growing fairly rapidly suggesting that households are spending a greater portion of their
disposable income on ‘needs’ rather than ‘wants’.
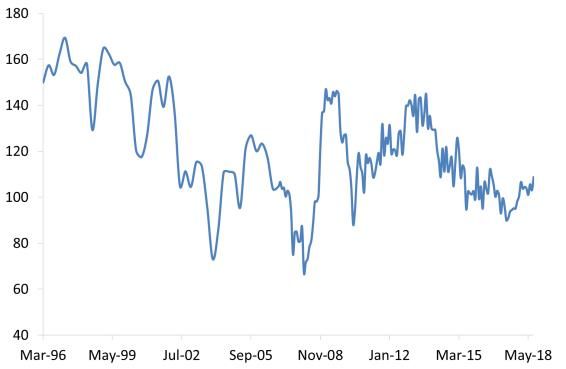
• A useful way to glean the household’s response to weaker disposable income is to assess
consumer sentiment. Figure 4 shows the Westpac-MI Consumer Sentiment Index since 2010.
Sentiment has been relatively weak in the past few years, after rising over the period 2011
to 2013. However, there has been a recent (albeit unclear) upswing in the index suggesting
that consumers are more optimistic about future economic conditions.
• The March National Accounts data also provides us with updates on key ratios regarding
household assets and debt. Figure 5 shows that the recent positive trajectory of the
household debt to income ratio has continued unabated in the March quarter, whereas the
assets to income ratio fell slightly. It is clear, however, that debt continues to be backed by
valuable assets.
• In line with record-low interest rates, the ratio of housing interest payments to household
income continues to be low, albeit creeping upwards. As monetary policy tightens, this ratio
will inevitably increase thereby further dampening an already weak housing market. The
decline of the housing market is examined further in the next section.
Figure 3: Retail trade (annual % growth) Figure 4: Consumer sentiment index
Source: ABS. Source: MI
Figure 5: Household debt and asset ratios Figure 6: Housing interest payments to disposable
income ratio
Source: RBA. Source: RBA
4Monthly Bulletin of Economic Trends – August 2018
The housing market slips into negative growth
• In May’s MBET we noted that house price growth had eased considerably. Officially, house
prices exhibited double-digit annual growth in the March and June quarters of 2017, falling
to 8.3 per cent in the September quarter and 5.0 per cent in December. In the March quarter
of 2018, annual house price growth declined further to 2.0 per cent, with Sydney exhibiting
negative annual growth of -0.5 per cent. The Melbourne market, on the other hand,
exhibited relatively strong growth of 6.2 per cent.
• Unofficial estimates indicate that the downward trend in house price growth continued in the
June quarter. In particular, it appears that dwelling prices exhibited negative annual growth,
with Melbourne following Sydney into negative growth territory.
• Although house prices have been rising in recent years, overall auction clearance rates have
been on a ‘noisy’ decline since the beginning of 2017. This decline has seen auction clearance
rates fall from over 70 per cent in 2016 to their current value of approximately 58 per cent.
• Looking forward, the Melbourne Institute’s House Price Expectations Index shows that
consumers expect house prices to fall further in the short term. In August, the proportion of
consumers expecting a house price fall of up to 10 per cent increased (relative to August
2017) by a significant 13.9 per cent. In contrast, the proportion expecting house price
growth of up to 10 per cent fell by 15 per cent. Figure 7 shows this downward trend over
the past two years, with the proportion of individuals expecting reasonable price growth
likely to fall below the troughs observed in 2011 and 2015 respectively.
• Another forward-looking measure of the housing market is the Melbourne Institute’s
Dwelling Sentiment Index. This index examines whether households believe it is a good time
to buy a dwelling, and therefore compliments the house price expectations index.
• According to the Dwelling Index (Figure 8), dwelling sentiment has exhibited a long-term
decline since 2012, although it has recently shifted upwards. This shift, however, is relatively
minor and indicates the consumers are cautious about housing market conditions.
Importantly, the index provides no indication that, in the short term, consumers are
confident about making housing purchase decisions.
Figure 7: House price expectations Figure 8: Dwelling sentiment (Good time to buy a
dwelling)
Source: MI. Source: MI.
5Monthly Bulletin of Economic Trends – August 2018
First home buyers stagnating after a recent increase in activity
• The 2017 stamp duty exemptions announced by the Victorian and NSW governments
produced an immediate jump in the proportion of first home owners in NSW and Victoria.
Further information on this is available in the February and May issues of MBET.
• In May’s MBET, we observed that the stamp duty exemptions had not produced a trend in
the proportion of first home buyers. They did, however, achieve a positive proportional shift
(or jump) in first home buyers. Most of the shift took place over July and August where the
proportion of first home buyers rose by a significant 4.1 per cent in NSW and by 3.9 per
cent in Victoria. It is unclear whether recent activity, such as Victoria’s fall in May, is the
result of other factors.
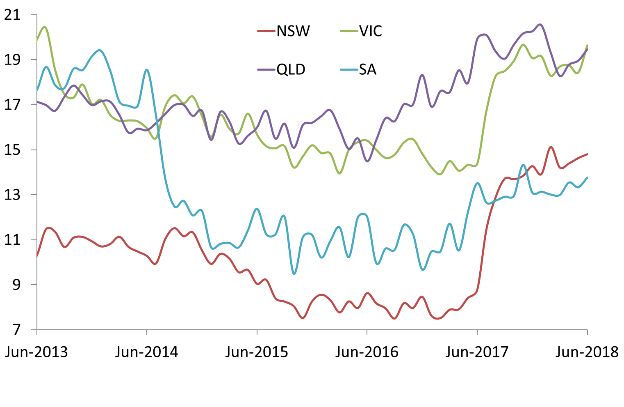
• Figure 9 shows that the proportion of first-home buyers in NSW (14.8 per cent as at June
2018) now exceeds that of South Australia (13.8 per cent). In contrast, the equivalent values
for the two states in June 2017 (8.8 and 13.5 per cent respectively) were at complete odds
with their current values. Similarly, the proportion of first home buyers in Victoria was 14.4
per cent in June 2017 (versus 19.9 per cent in Queensland). In June 2018, however, first
home buyer proportions were almost identical (19.6 per cent in Victoria and 19.5 per cent
in Queensland).
• Interestingly, the impact of the first home buyer stamp duty exemptions appears to be more
long-lived in NSW than Victoria. In this respect, the proportion of first home buyers in the
latter state has fallen slightly from its peak of 19.7 per cent in November 2017 to its current
value of 19.6 per cent. In contrast, first home buyer activity in NSW appears to be rising.
• A related issue is the spillover effects stemming from measures such as the stamp duty
exemptions (and, just as importantly, the curbing of lending to housing investors) on the
distribution of housing finance. Owner-occupiers (excluding refinancing) are now responsible
for around 47 per cent of all housing finance, with the proportion of finance going to investors
being around 30 per cent (excluding investors who are engaging in development).
• Figure 10 shows the overall trend in the proportion of housing finance to owner-occupiers
and investors. The statistics exhibit a clear decline in the housing finance provided to non-
development investors, and an associated increase in the proportion of activity attributed to
owner-occupiers.
• Further analysis of the distribution of housing related finance indicates an upswing in the
refinancing of loans by owner-occupiers. The proportion of housing finance for owner-
occupier refinancing is currently at a little under 20 per cent and at its highest point since
October 2016. Accordingly, although the proportion of owner-occupier financing for
established dwellings is rising, the data show that a substantial component of owner-occupier
housing finance is not attributable to greater participation in the current housing market.
• Overall, notwithstanding weaker house prices and stamp duty exemptions, it is not clear
that first home buyer activity will continue to rise. In particular, it appears that significant
house price depreciation will be required to induce any meaningful increase in first home
buyer activity (over and above that stemming from existing first home owner stamp duty
exemptions).
6Monthly Bulletin of Economic Trends – August 2018
The stability of the housing market
• Recent research by Lim and Tsiaplias (2018) examined the relationship between house
prices, disposable income, and drivers such as interest rates. 1 The authors found that when
interest rates fell below a certain threshold, the house price to income ratio was more likely
to become unpredictable and unstable, potentially exhibiting periods of sharp changes and
volatility.
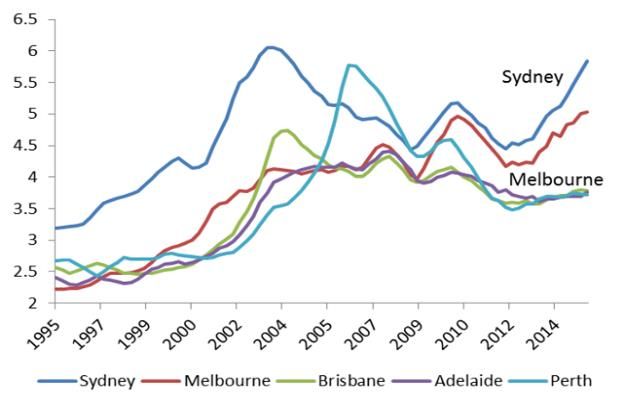
• Figure 11 shows the ratio of house prices to disposable income for Sydney, Melbourne,
Brisbane, Adelaide and Perth. It appears that the ratios often co-move but that there are
also periods when movement is idiosyncratic or restricted to a subset of the major cities. In
particular, it is clear that the ratio rose dramatically in Sydney and Melbourne over the past
few years. During the same period, the ratio was relatively flat for the rest of Australia.
• The authors found that Australian housing markets are likely to exhibit greater sensitivity to
factors such as housing supply, inflation and consumer expectations when interest rates are
low. This can produce sharp changes in some cities but not in others.
• The authors also argued that the resulting instability could be offset by introducing measures
that explicitly or implicitly increased the cost of housing-related finance. The response of
Australian regulatory bodies (in particular, the Australian Prudential Regulatory Authority
(APRA)) to housing market conditions has been largely consistent with these findings. In
response to sharp house price changes in recent years, APRA initiated a number of
restrictions on bank lending (focusing on investors) in order to forestall any potential
instability.
• These measures have resulted in higher relative borrowing costs for investors, in addition
to more stringent lending conditions (including a reduction in the proportion of interest-only
loans). Clearly, this has impacted negatively on a key driver (viz. housing investors) of
recent housing demand.
• Another useful forward-looking measure of housing market stability is to examine the extent
to which consumers expect inordinate house price changes. The Melbourne Institute’s House
Price Expectations Index examines the distribution of house price expectations, including
the extent to which individuals expect house prices to fall by more than 10 per cent. A fall
of this magnitude would, of course, be consistent with significant housing market instability.
• Figure 12 shows a time series of the proportion of respondents expecting house prices to
fall by more than 10 per cent house price expectations over the period 2010 to the present.
Although it only reflects a small proportion of consumers, it shows that there is considerable
variation in the extent to which consumers anticipate large price falls. Its current value is
not overly high but, in the context of the entire time series, has been tracking upwards.
• In this respect, the proportion of survey respondents expecting a greater than 10 per cent
price fall in house prices rose from an average of 2.1 per cent for the three months to August
2017 to 3.7 per cent for the three months to August 2018. For comparison, the corresponding
value in 2016 was 2.5 per cent. The current proportion is therefore considerably higher than
that observed over the past two years and we will track this value going forward.
1
Lim, G.C. and Tsiaplias, S. (2018). Interest Rates, Local Housing Markets and House Price Over‐reactions, Economic
Record 94(S1), pp. 33-48, https://doi.org/10.1111/1475-4932.12402.
7Monthly Bulletin of Economic Trends – August 2018
Figure 9: Proportion of first home buyers Figure 10: Proportion of housing finance to owner-
occupiers and investors
Source: ABS. Source: ABS.
Figure 11: House price to income ratios Figure 12: Proportion of respondents expecting house
prices to fall by more than 10 per cent
Source: ABS. Source: MI. Red dashed line is 3-mth moving average.
Table 3: Precision of year-ended Forecasts for Australia
Precision of (year-end) Forecasts
2018 2018 2018 2019 Calender Year
Jun Sep Dec Mar 2018
Australia
Economic Activity
GDP 0.6 0.9 1.1 1.2 0.7
Consumption 0.5 0.8 1.0 1.1 0.7
Dwelling 2.3 2.4 2.5 2.8 1.9
Business Investment 5.2 6.0 6.7 7.5 4.6
Import 2.5 4.2 5.8 6.6 3.7
Export 2.6 3.4 4.0 4.4 2.9
Inflation & Financial Market
Underlying Inflation 0.2 0.3 0.4 0.3
Headline Inflation 0.4 0.5 0.7 0.6
90 day bill 0.3 0.5 0.7 0.6
T rade Weighted Index 3.3 3.7 3.9 2.3
Labour Market
Unemployment Rate 0.1 0.2 0.3 0.3
Employment 0.2 0.4 0.5 0.5
Participation Rate 0.2 0.3 0.4 0.3
Wage Price Index 0.5 0.6 0.7 0.4
8Monthly Bulletin of Economic Trends – August 2018
For more information about the Melbourne Institute,
see: http://melbourneinstitute.unimelb.edu.au/
For more information about Macro@MI and other Reports
see: http://melbourneinstitute.unimelb.edu.au/research-programs/macroeconomics
9You can also read