2021 IMS Membership Survey Results - Junhui Cai ...
←
→
Page content transcription
If your browser does not render page correctly, please read the page content below
2021 IMS Membership Survey Results
      Reported by: Junhui Cai (UPenn), Nicole E. Pashley (Rutgers), Linda Zhao (UPenn)
IMS conducted a survey of members in March and April 2021 to determine the demographic
composition of its members and solicit input. It is the second membership survey of this kind after
the first one conducted at the end of 2013 and published in 2014 (Opsomer, 2014). The goal of the
survey is to assess how the IMS represents the members of our profession, and how it can better
serve its members. In addition, our community has experienced an unprecedented period of growth
in recent years, leading to possible shifts in IMS member demographics.
The survey was sent to 4,697 members who opted in to receive emails (among all 4,287 active
regular members and 621 life members, in total 4,908 members) and 1,861 responded. The
previous survey in 2013 was sent to 4,561 active members, and 1,492 responded. The response
rate increased from 33% in 2013 to 40%.
We start by examining the demographics of respondents (education, age, gender, and geography).
We then turn to professional characteristics of respondents (occupation, primary area, New
Researchers Groups). Finally, we examine questions targeted to how IMS can better serve its
members (preferred communication platforms, events of interest, and open-ended comments).
Overall, IMS has seen exciting growth in student members. Compared with the 2013 survey, more
respondents are working in applied areas. Further, the most popular area for the respondents to
work in is statistics, followed by data science/machine learning, and then probability. The
background of the respondents is diverse, though primarily academics and students. The majority
of respondents have PhDs. There are indications that the international presence of IMS has seen
some increase in recent years. Unfortunately, the gender gap among the respondents has seen a
backward trend, with males representing a much larger proportion of respondents than females (4-
to-1 male vs. female).
The analyses and results are post-stratified by student status, as done in the previous survey
analysis. We make no other attempts at creating survey weights and non-responses for questions
are removed.

Demographics: Education, age, gender, and geography
Education
First, we examine the educational background of the respondents. Figure 1 shows the percentage
of the highest degree obtained by decade during which that degree was obtained, among the
respondents who reported both the highest degree and decade. These numbers are also given in
Table 1. Given the nature of IMS, it is not surprising that PhDs dominate, although the proportion
has declined since 2013. The higher proportion of masters and undergraduates in the most recent
decades (2010s and 2020s), in particular in the 2020s group, is likely due to individuals still
pursuing their education. A small percent of respondents (approximately 2.2%) indicated “Other”
for education, and this group included, high school and undergraduate students and individuals

                                                                                                 1
who listed specialized degrees, among others. Figure 2 shows the comparisons of the highest
degree obtained between the 2013 and 2021 survey.

Figure 1: Distribution of highest degree obtained by decade.

Table 1: Percentage of respondents with the highest degree obtained by decade.

 Degree             1960s/prior    1970s    1980s   1990s      2000s   2010s     2020s   All
 Doctorate          4.0            7.9      10.4    11.2       13.1    14.9      4.8     66.2
 Masters            0.2            0.1      0.2     0.4        1.3     18.0      5.0     25.1
 Undergraduate      0.0            0.1      0.1     0.1        0.0     5.6       2.7     8.7
 All                4.2            8.1      10.6    11.7       14.4    38.5      12.5    100.0

                                                                                                 2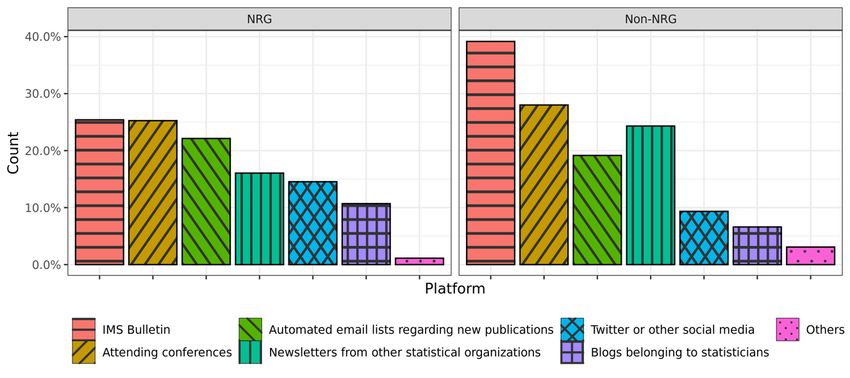
Figure 2: Distribution of highest degree obtained comparing the 2013 and 2021 survey.
Location
Figure 3 shows a heatmap of the geographic distribution of respondents by continent they spend
most of their time in and Figure 4 shows the difference between the 2013 and 2021 survey. Table
2 shows the same numbers. The number of respondents in Asia has seen a dramatic increase. The
number in Asia is now larger than the number in Europe. The percent of respondents in Africa also
almost doubled since 2013, up to 3.3% now.

     Percentage
         50.0%

         40.0%

         30.0%

         20.0%

         10.0%

Figure 3: Geographic distribution of respondents.

                                                                                               3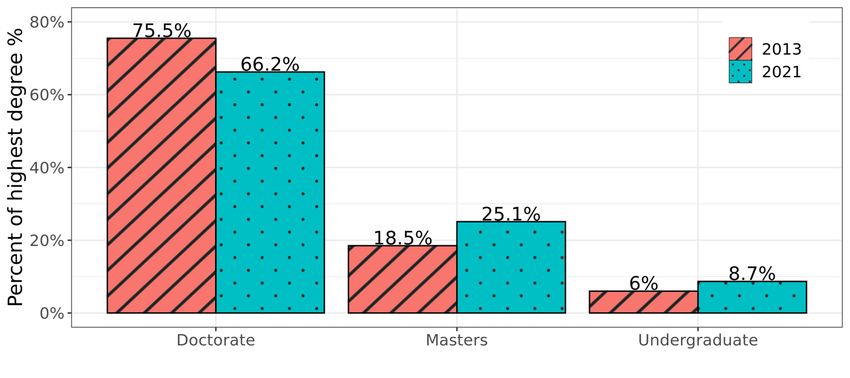
Figure 4: Geographic distribution of respondents comparing the 2013 and 2021 survey.

Table 2: Geographic distribution of respondents comparing the 2013 and 2021 survey.

                            Continent        2013 (%)   2021 (%)
                            Africa           1.7        3.3
                            Asia             12.5       21.4
                            Europe           20.0       16.5
                            North America    61.1       55.2
                            Oceania          3.4        2.1
                            South America    1.3        1.4
Age and gender
Figure 5 and Table 3 shows the percentage of respondents by age and gender among those who
reported both age and gender. Gender is highly skewed towards males, close to 4-to-1 male
vs. female overall. The balance was improving for the younger respondents in the 2013 survey,
approaching 2-to-1 among respondents in their 20s and below. However, the improving balance
scaled back to close to 3-to-1 in the 2021 survey with the most imbalance from Africa, South
America, and Oceania, followed by Europe, Asia, and North America. As a reference, the ASA in
2016 reported about 34.6% female and 65.4% male members, of the 85.2% of members that
disclosed their gender (Ghosh-Dastidar, B., Tolpadi, A., & Stangl, D. , 2016).
Approximately (unweighted) 3.2% of respondents chose not to disclose their gender (including
non-response to the question), identified as non-binary, or chose to self-describe.
The most noticeable changes in the age distribution from 2013 to 2021 is an increase in the
proportion of respondents in their 20s and younger (from 18.1% in 2013 to 27.6% now) and a drop
in the proportion of respondents in their 60s (from 18.2% in 2013 to 11.3% now).

                                                                                             4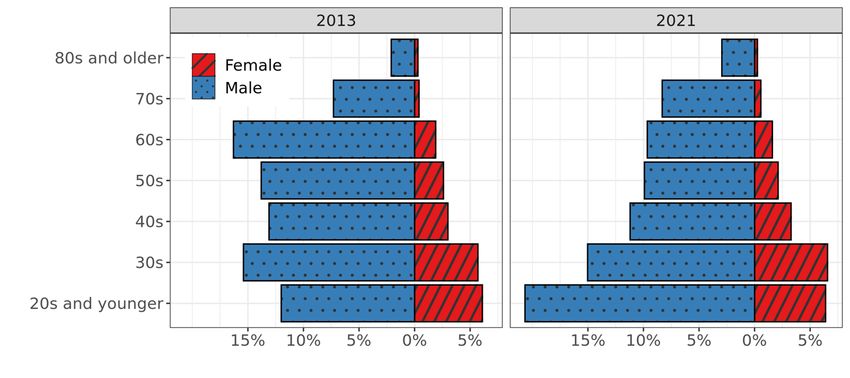
Figure 6 shows these numbers broken up by student status. Unsurprisingly, student respondents
tend to be younger than non-student respondents.

Figure 5: Percentage of respondents by age and gender comparing the 2013 and 2021 survey.

Table 3: Percentage of respondents by age and gender comparing the 2013 and 2021 survey.
                          Age          Male    Female     Others    All
                    20s and younger    20.7      6.4       0.6      27.6
                          30s          15.0      6.6       0.3      21.9
                          40s          11.2      3.3       0.4      14.9
                          50s           9.9      2.1       0.3      12.3
                          60s           9.7      1.6       0.0      11.3
                          70s           8.3      0.6       0.0       8.9
                     80s and older      2.9      0.3       0.0       3.2
                          All          77.7     20.8       1.5     100.0

                                                                                            5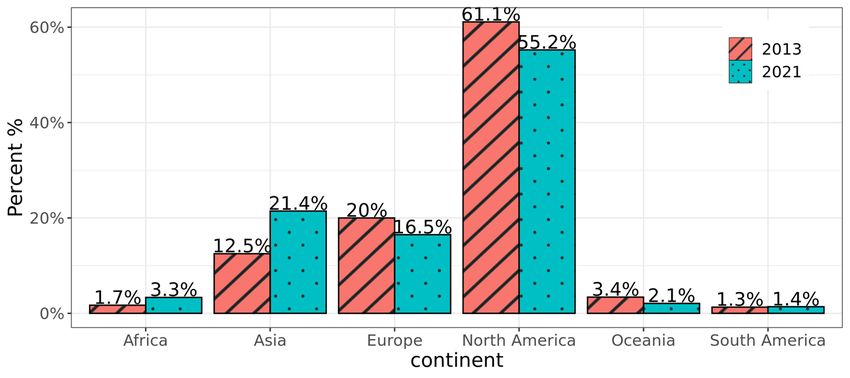
Figure 6: Percentage of respondents by age and gender, broken down by student status.

Professional activities: Occupation, primary field, and New Researchers Group
Occupation
Figure 7 and Table 4 shows the current employment status of the respondents, again broken down
by decade of degree and among those who reported employment status and decade of degree.
Approximately 48% of the respondents are employed by academic institutions and close to 35%
are post-docs or students (recall these numbers are post-stratified by student status based on true
proportion of student members in IMS). The post-docs and students mostly obtained their degrees
in the recent decade with the exception that some students obtained their degree in 1990s and
2000s and then returned to school in pursuit of a higher degree. Comparing the employment status
to that in the 2013 survey, as shown in Figure 8, the concentration in academia is even higher in
2021 and student membership accounts for over 30% of total members, up from about 20% in
2013. A small percentage of respondents (approximately 2.0%) chose “Other” for their occupation,
including some who identified as falling in multiple categories such as “semi-retired” and some
who identified as self-employed, among other situations.

                                                                                                 6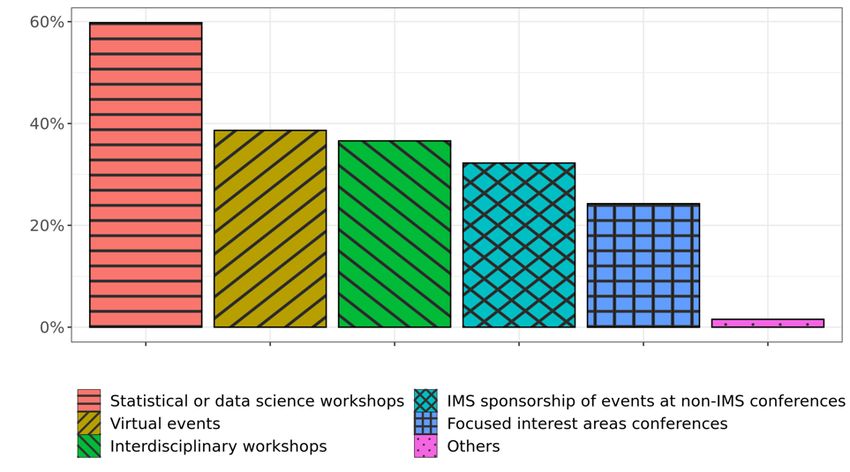
Figure 7: Distribution of current occupation by decade of highest degree earned.

Table 4: Distribution of current occupation by decade of highest degree earned.
 Occupation      1960s/prior    1970s    1980s    1990s    2000s    2010s    2020s   All
 Academic        1.0            2.8      7.8      10.1     12.4     13.1     1.3     48.4
 Private         0.1            0.2      0.5      0.6      0.7      1.2      0.8     4.2
 Government      0.0            0.2      0.1      0.4      0.3      0.5      0.1     1.6
 Retired         3.0            4.3      1.9      0.4      0.0      0.1      0.0     9.8
 Postdoc         0.0            0.0      0.0      0.0      0.0      1.3      1.0     2.3
 Student         0.0            0.0      0.0      0.1      0.8      21.4     9.8     32.2
 Others          0.0            0.5      0.3      0.1      0.2      0.4      0.1     1.7
 All             4.1            8.0      10.6     11.7     14.3     38.1     13.3    100.0

                                                                                             7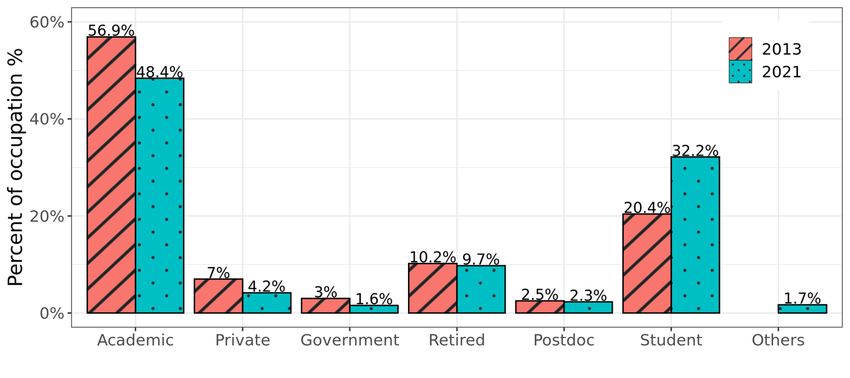
Figure 8: Distribution of current occupation comparing the 2013 and 2021 survey.

Primary field
The tables below show the tabulations of primary area(s) of research or professional activity
reported by the respondents. In addition to the four broad categories from the 2013 survey—
applied statistics, statistical theory, probability theory and applied probability—the 2021 survey
introduced two new categories of “statistical methodology” and “data science and/or machine
learning.”
Table 5 shows that over 80% of respondents work in statistics (statistical theory, statistical
methodology, or applied statistics), similar to the 2013 survey. The proportion who also identify
probability as one of their primary fields, in addition to statistics, jumped from 9.0% in 2013 to
17.5% in 2021. However, the proportion of respondents who work in probability and not statistics
remains low at around 11.3% (compared to 13.7% in 2013).
Table 5: Distribution of respondents by primary field including statistics (statistical theory,
statistical methodology, or applied statistics) and by primary field including probability
(probability theory or applied probability). Numbers are percentages.
                                               Statistics

                              Probability    Yes       No      All
                                 Yes          17.5     11.3    28.8
                                 No           64.0      7.2    71.2
                                 All          81.5     18.5   100.0

Tables 6 and 7 show the mix of research in probability or statistics vs data science and/or machine
learning among respondents. Data science and/or machine learning is booming and currently 41%
of respondents identify it as one of their primary fields. Over 40% of those who work in statistics

                                                                                                 8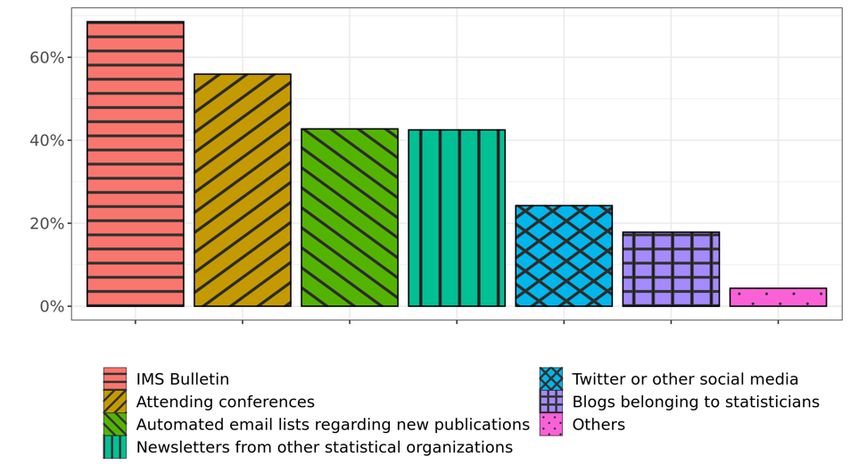
indicate that they also work in data science; however, less than a third of those who work in
probability do so.
Although many respondents indicated that they worked in multiple areas, statistics appears to be
the most popular area among respondents, followed by data science.
Table 6: Distribution of respondents by primary field including probability (probability theory or
applied probability) and by primary field including data science and/or machine learning.
Numbers are percentages.
                                    Data science, machine learning

                     Probability         Yes               No            All
                        Yes               9.0              19.8         28.8
                        No               31.7              39.5          71.2
                         All             40.7              59.3         100

Table 7: Distribution of respondents by primary field including statistics (statistical theory,
statistical methodology, or applied statistics) and by primary field including data science and/or
machine learning. Numbers are percentages.
                                   Data science, machine learning

                      Statistics        Yes               No           All
                         Yes            35.7              45.8         81.5
                         No              5.0              13.5         18.5
                         All            40.7              59.3         100

Tables 8 and 9 show the proportion of respondents who work in applied areas of statistics or
probability. Among those who work in statistical theory and/or methodology, more than half also
work in applied statistics, a big jump from 35% in the 2013 survey. Similarly, among those who
work in probability theory, almost half also work in applied probability, a surge from less than a
quarter in 2013. In fact, more respondents now indicate that they work in applied probability than
in probability theory. These trends indicate an increased focus and appreciation of applied work in
both statistics and probability.

                                                                                                 9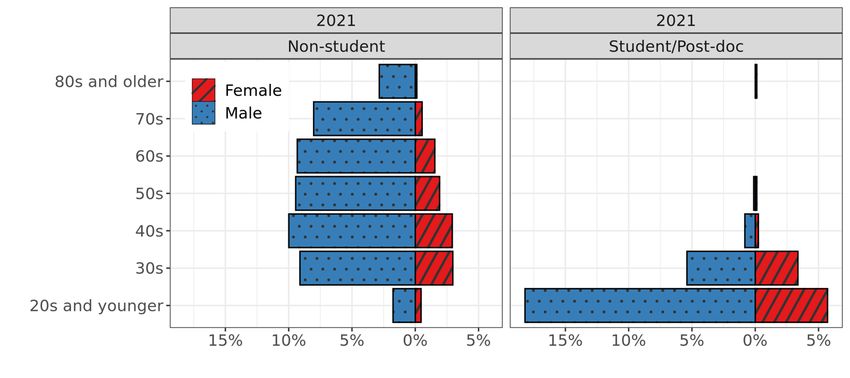
Table 8: Distribution of respondents by primary field including applied statistics and by primary
field including statistical theory or statistical methodology. Numbers are percentages.
                                         Statistical theory/methodology

                 Applied statistics          Yes                 No              All
                       Yes                   38.2                14.4            52.6
                       No                    28.9                18.5            47.4
                         All                 67.1                32.9        100.0

Table 9: Distribution of respondents by primary field including applied probability and by primary
field including probability theory. Numbers are percentages.
                                                   Probability theory

                      Applied probability           Yes         No         All
                               Yes                   8.9        10.7       19.6
                               No                    9.2        71.2       80.4
                               All                  18.1        81.9      100.0

New Researchers Group (NRG)
The IMS New Researchers Group (NRG) “focuses on ensuring the continuance of the New
Researchers Conference, the establishment and enhancement of a robust web presence, and
fostering new ways for young researchers to meet, collaborate, and share their experience” (from
http://groups.imstat.org/newresearchers/about.html). NRG invites all members within 10 years of
their PhD to join. Unfortunately, less than 25% of the applicable respondents were aware of NRG
at the time of the survey. We hope this survey will help spread awareness and further the NRG’s
mission of engaging with and empowering new researchers.

How to better serve the members?
New questions were introduced on this survey to assess how IMS can better serve its members.
Communication platform
We now turn to the preferred methods respondents use to get statistical news and updates. 97% of
the respondents answered this question and the general results are given in Figure 9. The most
popular platform used to receive statistical news is the IMS Bulletin followed by attending
conferences and other statistical organizations’ newsletters. Perhaps surprisingly given their
general popularity, twitter and blogs are least likely to be a typical source of statistical news for
respondents.
To understand how to better engage with younger and more junior members, a separate analysis
of this data was performed separating individuals who indicated that they are potential NRG

                                                                                                  10
members (within 10 years of their PhD) and all others. We will refer to the potential NRG members
as “new researchers.” These results are shown in Figure 10. Unsurprisingly, the new researchers
show a relatively higher preference for twitter and blogs as sources of news, but they are still the
least likely sources among both groups. For both groups the IMS Bulletin and attending
conferences are the two most common ways of learning about statistical news, but with the non-
new researchers group being more likely to use the IMS Bulletin as a source. Further, the new
researchers are relatively more likely to get news from automated email lists as opposed to other
statistical organizations’ newsletters.
An important note here is that there is some obvious selection bias: individuals who read the IMS
Bulletin and other IMS emails are those who were the most likely to respond to this survey.
Figure 9: Platforms respondents typically use to learn about statistical news and updates.
Figure 10: Platforms respondents typically use to learn about statistical news and updates, broken
down by whether the individual indicated they are a potential NRG member.
11Future events
The survey also included a question regarding which future events members are most interested in
IMS holding or sponsoring. The results are shown in Figure 11. 86% of the respondents answered
this question. The most popular event type is statistical or data science workshops, followed by
virtual events and interdisciplinary events. Focused interest area conferences had the least interest.
Figure 12 shows this data split by whether the respondent is a potential NRG member. This
breakdown shows that statistical or data science workshops are most popular among both groups.
However, new researchers appear more interested in focused interest area conferences and less
interested in virtual events.
Figure 11: Events respondents are interested in IMS holding or sponsoring.
12Figure 12: Events respondents are interested in IMS holding or sponsoring, broken down by
whether the individual indicated they are a potential NRG member.
Open ended comments
We now do an informal look at the responses received to open-ended comments on the survey.
Comments response rate by age and student status
First, we break down the comment response rate by age group (above 60 and below) and student
status. This is shown in Table 10. Older respondents (above 60) and students tend to comment
more.
Student status
Above 60 Yes No
Yes 0 8.4
No 6.6 5.3
Table 10: Comment rate in each of group divided by age and student status.
Comment themes
A very informal classification of the comments shows several themes emerge. The five most
common themes are as follows: 1. Encouragement and suggestions to continue virtual and online
events. 2. General praise for IMS. 3. Support and suggestions for engaging with data science,
machine learning, and AI more. 4. Encouragement to support and engage with young researchers
and students. 5. Encouragement to provide more support for members in developing countries.
13Final remarks
This survey has given us more insights into who IMS members are. It shows that our members are
diverse in interests, with clear trends over time towards applied areas and data science/machine
learning among respondents. IMS appears to be increasing in international presence, especially in
Asia and Africa. Respondents continue to be primarily in academic positions with PhDs, perhaps
pointing to more opportunities to bring in members from other backgrounds. Respondents
indicated the usefulness of the IMS Bulletin and showed enthusiasm for future IMS events.
Excitingly, IMS has increased in student and younger members. The gender imbalance among the
respondents in some regions should motivate new efforts in outreach to under-represented
members of our fields, especially juniors.
On a final note, below is a word cloud of the 300 open ended comments received. Some common
words are unsurprising, such as “members,” “statistics,” and “probability,” but we are happy to
see among their ranks “good,” “thank,” and “like.” Thank you to all the members who took the
survey.
useful organizations
particularly encouragement
sponsored especially community surveys
welcome impact aroundacademic opportunity workshops
important member
special current interests developing
comments relevant receiving
job
idea
funding share social
showing career add much probability
people opinion
used home short
time society email
consider
get
survey glad dontpapers
attendappreciate
collect
suggest
theory
membership
ims
areas brief done
way
given
statistics
day bulletin
help work place
pleaseconference
wish
travel nice
students new
love site isi likevirtual become
applied
news
free well ask need
send online
yes
seems just goodmake
already
first
high
questions student hear
low africa will events thank information quite
none
leadership journals
research
media
read
informative part effort country
example world
concise
data
members
conferences
always
great see groups
statistical might
support designed app questionnaire
directorystatisticians question grateful
participate opportunities countries another mistake
researcher learn buildingnothing thanks gender researchers
meetings dedication easier know updates
times think inclusive kindly open
mathematical professional want
publications
References
Opsomer, J. (2014). IMS Membership Survey results. IMS Bulletin, 43(5).
Ghosh-Dastidar, B., Tolpadi, A., & Stangl, D. (2016). Gender balance in ASA activities
update. AMSTAT news: The membership magazine of the American Statistical
Association, (464), 22-27.
14You can also read