Conservation Success Index: Colorado Cutthroat Trout
←
→
Page content transcription
If your browser does not render page correctly, please read the page content below
Conservation Success Index:
Colorado Cutthroat Trout
ONCORHYNCHUS CLARKII PLEURITICUS
Rev. 2.1 - 4/2010
SPECIES SUMMARY
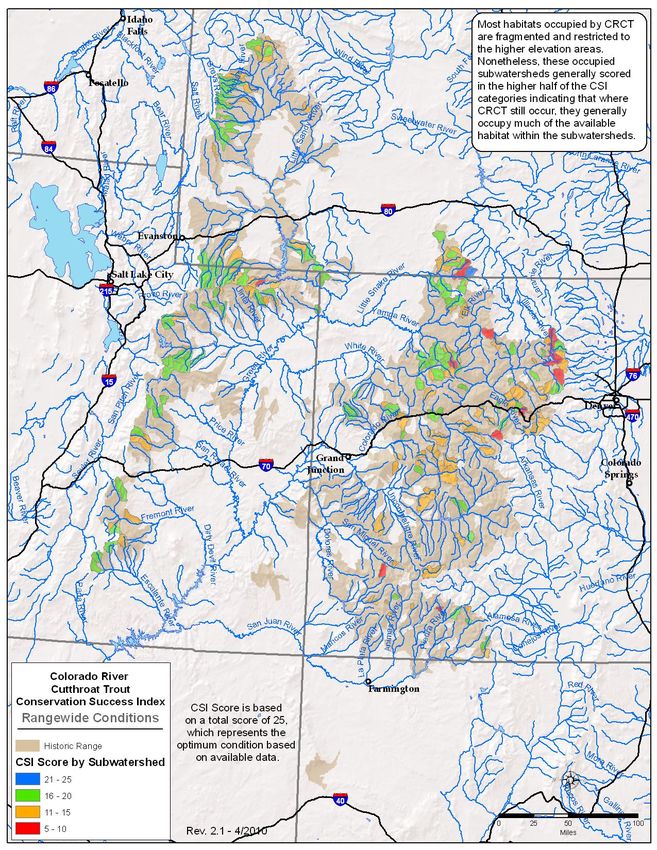
Historically, the Colorado River cutthroat trout Historic Range Relief Map
(CRCT) occupied numerous tributary systems of
the Colorado River upstream of the Grand Canyon.
The Upper Green River system in Wyoming and
Utah contains many extant populations, including
remaining strongholds. Additional, but mostly
scattered populations remain in the upper Colorado
River, upper Gunnison, upper Dolores, upper
Yampa, Little Snake, upper White, upper Duchesne,
upper Escalante, and upper San Juan systems.
Robert Behnke reported on early pioneer records
that CRCT reached weights of 17 to 20 pounds. If
true, the fish may have grown to such large
proportions in bigger lakes and larger stream
systems than they typically inhabit today.
Key CSI Findings
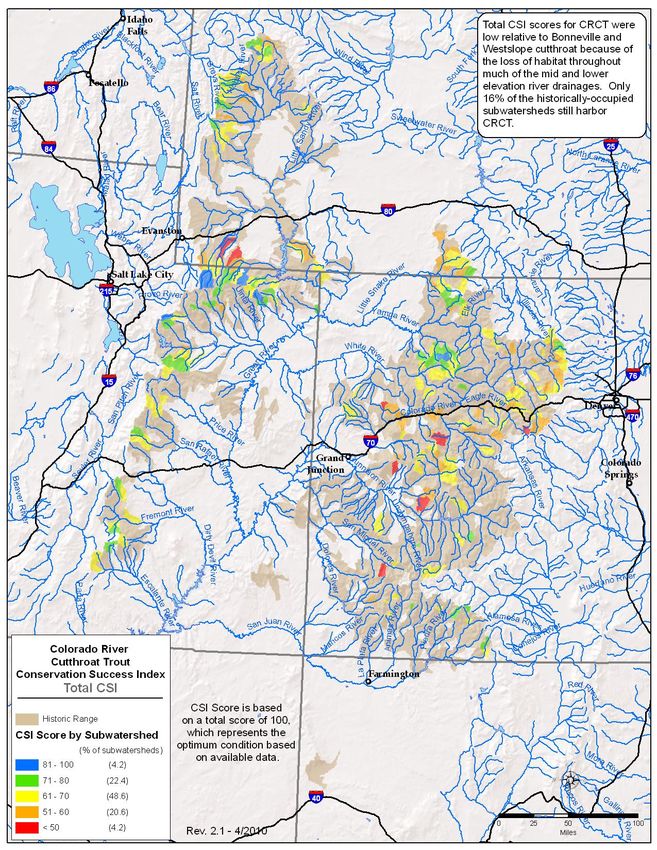
• 16% of subwatersheds (213/1351) within
historic range are occupied by CRCT
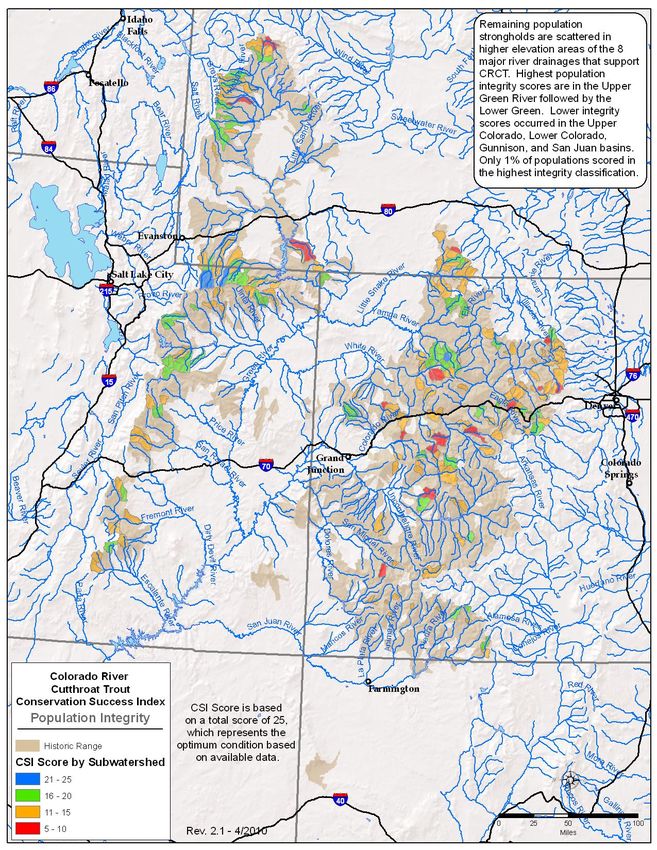
• Most populations are fragmented and
restricted to smaller headwater streams
• Only 1% of populations were classified in
highest Population Integrity category
• Genetically unaltered CRCT may occupy as
much as 51% of currently occupied range
• The CRCT Conservation Team has
identified 285 separate CRCT
“conservation populations” with important
genetic and life history traits
• Reintroductions into unoccupied habitat
were the highest management priority. High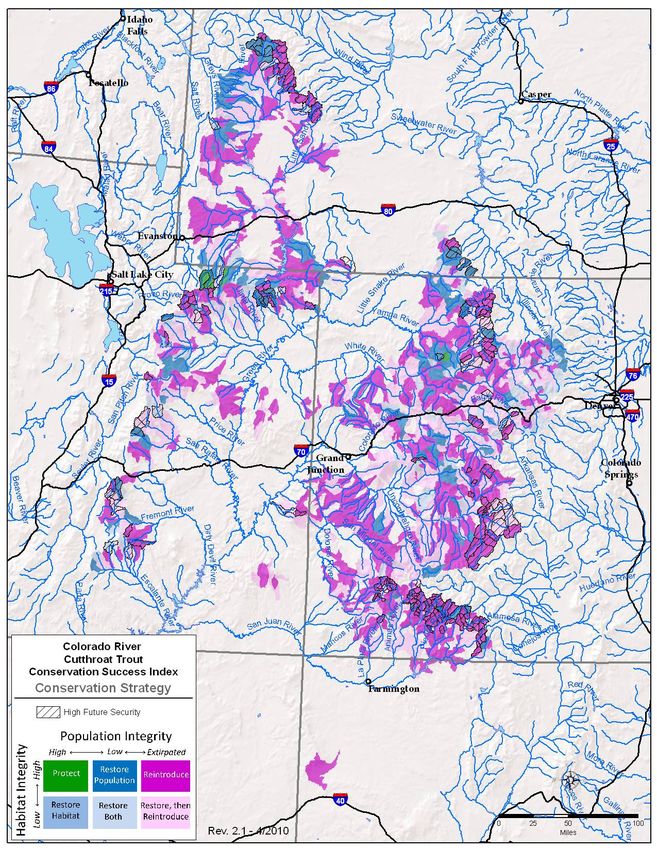
priority reintroduction sites were identified
throughout the range.
In more recent years, CRCT have been pushed into
higher elevation streams by the same cast of
problems that plague most native trout in the West:
introductions of non-native trout, habitat
degradation from timber harvest and overgrazing,
excessive fish harvest, and fragmentation of stream
habitat by water diversions and other barriers. In
1996, Michael Young and colleagues from the U.S.
Forest Service estimated that 318 populations of
CRCT existed in their native range.
Strongholds for CRCT are very few and occupy
limited habitat compared to most other western
trouts. Two stronghold areas were identified in the
Photo courtesy Colorado Division of Wildlife
CSI, both in the upper Green River drainage. One,
the LaBarge Creek system, occurs in the Bridger-
Teton National Forest of Wyoming. The other, the
Blacks Fork drainage, occurs in the Ashley National
Forest and along the Wyoming-Utah border.
Non-native trout stockings and their subsequent invasion into higher elevation habitats has been a major
cause of declines and continues to have a major negative influence on remaining CRCT. Most migratory
life histories and interconnected habitats have been lost. Dams and water diversions limit downstream
movement, but ironically, may also serve as barriers to upstream invasion by non-native trouts. One of
the most challenging needs for CRCT is the reestablishment of large, interconnected habitat areas
where fluvial and adfluvial populations can exist free of non-native trout species.
Non-native species control and reintroduction efforts are the highest priority recovery actions. Existing
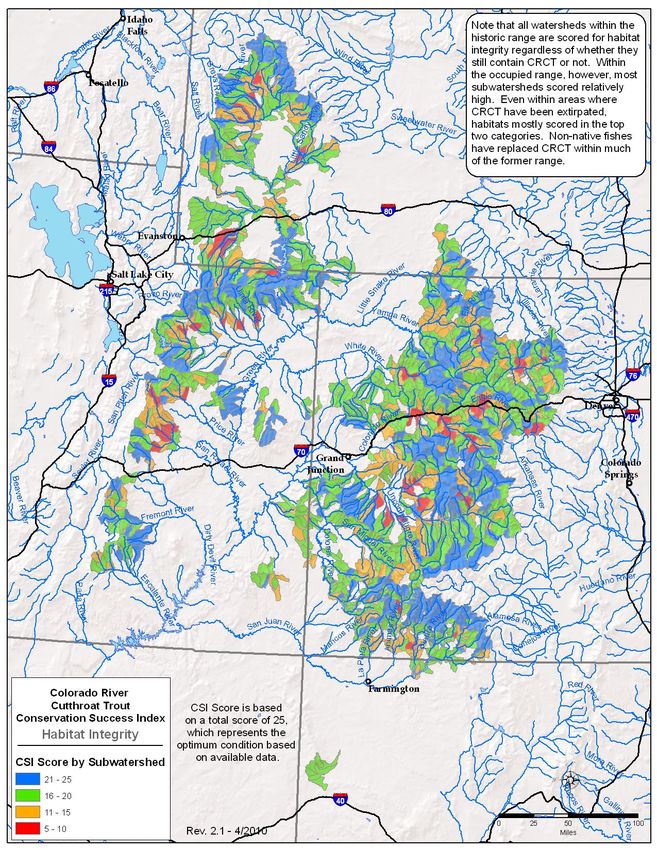
watershed condition is relatively high throughout the historic range, with 19% of subwatersheds in the
highest condition category. Protection of remaining strongholds also is vital, particularly in the face of
widespread energy development on public lands. Currently, 51% of CRCT habitat in Wyoming lies in
unprotected National Forest roadless areas.
We have very little data to assess lake populations and encourage various state and federal agencies to
more closely monitor and report their status in the future.
Prepared by Jack E. Williams, TU, 4/23/2007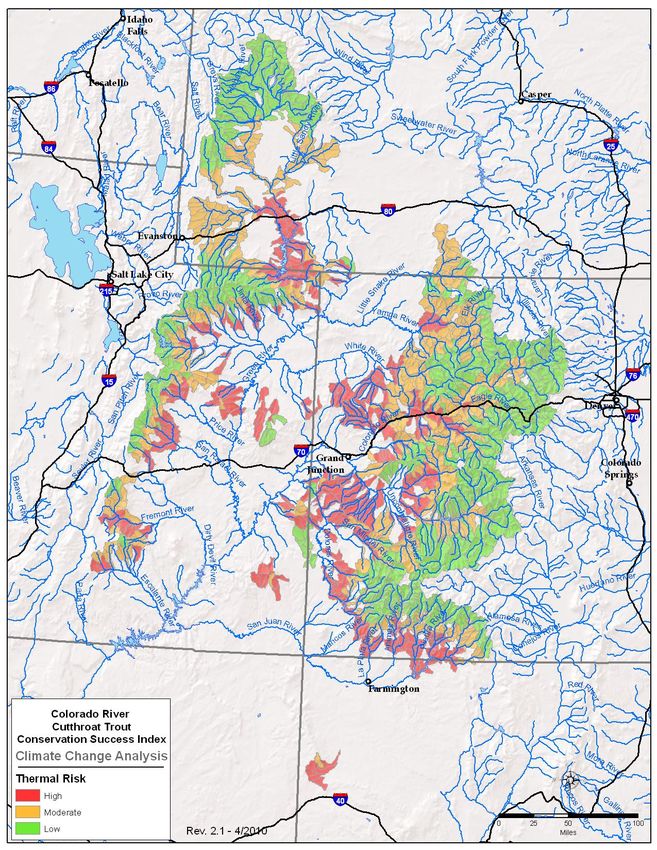
Conservation Success Index
                              Colorado River Cutthroat Trout Rule Set

Range-wide Conditions

Scored for conservation populations as defined by assessment.

Historic habitat is all perennial streams and connected, natural lakes across historic range.
Lakes less than 2 hectares that are connected to streams are considered stream habitat while lakes
greater than 2 hectares or isolated lakes are calculated as lake habitat.

1. Percent historic stream habitat occupied.

                              Occupied stream            CSI Score
                                   habitat
                                   0 – 9%                     1
                                  10 – 19%                    2
                                  20 – 34%                    3
                                  35 – 49%                    4
                                 50 – 100%                    5

Source: Hirsch, Christine L., et al. Range-Wide Status of Colorado River Cutthroat Trout
       (Oncorhynchus clarkii pleuriticus): 2005. 2006. Colorado River Cutthroat Trout
       Conservation Team.

2. Percent subbasins occupied.

                      Percent subbasins occupied            CSI Score
                                 1-49%                          1
                                50-69%                          2
                                70-79%                          3
                                80-89%                          4
                               90-100%                          5

Source: Hirsch et al. 2005.

U.S. Geologic Survey, Subbasins (4th order HUCs), 1:2,000,000, July 2005.

3. Percent historically occupied subwatersheds currently occupied within subbasin.
Percent subwatersheds CSI Score
occupied by subbasin
1 – 20% 1
21-40% 2
41-60% 3
61-80% 4
81-100% 5
Source: Hirsch et al. 2005.
U.S. Department of Agriculture, Forest Service, Natural Resources Conservation Service,
Wyoming Geographic Information Science Center, Sub-watersheds, 6th order HUCs.
4. Habitat by stream order occupied.
Occupied 2nd order streams CSI Score
and higher
0 – 9% 1
10 – 14% 2
15 – 19% 3
20 – 24% 4
25 – 100% 5
Source: Hirsch et al. 2005.
US Geological Survey, National Hydrography Dataset Plus, 1:100,000.
5. Historic lake habitat occupied.
Historic lake populations only considered natural lakes while current populations have been
identified in reservoirs thus leading to an increase in lake habitat for some subwatersheds.
Occupied lake habitat CSI Score
0 – 9% 1
10 – 19% 2
20 – 34% 3
35 – 49% 4
50 – 100% 5
Source: Hirsch et al. 2005.US Geological Survey, National Hydrography Dataset Plus, 1:100,000.
Population Integrity
Scored for conservation populations.
Lake populations were incorporated as a linear distance.
1. Density – where multiple populations exist within a subwatershed, density was calculated as
stream length weighted average. Use actual values for population total rather than classes listed
in assessment.
Fish per mile Total Population CSI Score
1 - 50 LT 500 1
1 - 50 GE 500 2
51 - 150 GE 1 3
151 - 400 GE 1 4
GT 400 GE 1 5
Source: Hirsch et al. 2005.
2. Population Extent – based on table HUC Connectedness
Degree of connectedness CSI Score
4 (Population Isolated) 1
3 (Weakly Connected) 2
2 (Moderately Connected) 4
1 (Strongly Connected) 5
Source: Hirsch et al. 2005.
3. Genetic Purity – based on table Genetic Status
Genetic Stability Ranking CSI Score
4 (< 80%) 1
3, 6 (80% - 89%, Not Tested – 2
Hybridized)
7 (Co-existence) 3
2 (90% - 99%) 4
1, 5 (Unaltered, Not Tested – 5
Unaltered)
Source: Hirsch et al. 2005.4. Disease Vulnerability – based on table Disease Risk
.
Disease Influence Risk CSI Score
Ranking
5 (Population is Infected) 1
4 (Significant Disease Risk) 2
3 (Moderate Disease Risk) 3
2 (Minimal Disease Risk) 4
1 (Limited Disease Risk) 5
Source: Hirsch et al. 2005.
5. Life History Diversity – Life History table; resident, fluvial, and ad-fluvial
Conservation population CSI Score
One life history form present: 1
Resident only
2
Two life histories present: Fluvial 3
and Resident with historic lakes
but no current adfluvial forms
4
Two or three life histories
present: Fluvial and resident with 5
no lake populations;
Any combination with Adfluvial
present
Source: Hirsch et al. 2005.
US Geological Survey, National Hydrography Dataset Plus, 1:100,000.
Habitat IntegrityScored for all subwatersheds in historic range.
1. Land Stewardship – score using AND between two indicators
Protected occupied Subwatershed CSI Score
habitat* protection
none any 1
1 – 9% LT 25% 1
1 – 9% GE 25% 2
10 – 19% LT 25% 2
10 – 19% GE 25% 3
20 – 29% LT 50% 4
20 – 29% GE 50% 5
GE 30% any 5
*If subwatershed only contains currently unoccupied habitat then scores are based only on
subwatershed protection: 50%=5.
Source: National Atlas, Federal Land Status.
Tele Atlas/GDT, Protected areas, 1:100,000. 2004.
U.S. Department of Agriculture, Forest Service, Geospatial Service and Technology Center.
Inventoried Roadless Areas.
2. Watershed Connectivity – includes both perennial and intermittent streams.
Number of Current/historic CSI
stream/canal connectivity 6th Score
intersections
GE 12 LT 50% 1
8 – 11 50 – 74% 2
5–7 75 – 89% 3
1–4 90 – 94% 4
0 95 – 100% 5
th:
Current/historic connectivity 4
• GT 90%: +1
• LT 50%: -1
Score for worst case
Source: Hirsch et al. 2005.
US Army Corps of Engineers, Dams, March 22, 2006.
US Geological Survey, National Hydrography Dataset Plus, 1:100,000.3. Watershed Conditions
Land conversion CSI Score
GE 30% 1
20 – 29% 2
10 – 19% 3
5 – 9% 4
0 - 4% 5
CSI score is downgraded 1 point if road density is GE 1.7 and LT 4.7 mi/square mile.
If road density is GE 4.7 mi/square mile it is downgraded 2 points.
Source: Tele Atlas North America, Inc./Geographic Data Technology, Inc., ESRI. Roads.
2005.
Colorado Division of Wildlife: Colorado GAP Analysis Project (100 meter) Land cover/land
use.
U.S. Geologic Survey, Utah, Wyoming GAP Analysis Project (100 meter). Land cover/Land
use.
4. Water Quality
Miles 303(d) Percent Number Rd mi/ CSI
Streams Agricultural Land Active Mines Str mi Score
GT 0 58-100% GE 10 0.5 – 1.0 1
28-57% 7-9 0.25 – 0.49 2
16-27% 4-6 0.24 - 0.10 3
6-15% 1-3 0.05 – 0.09 4
0-5% 0 0 – 0.04 5
Score for worst case.
Source: Colorado Division of Wildlife: Colorado GAP Analysis Project (100 meter) Land
cover/land use.
Tele Atlas North America, Inc./Geographic Data Technology, Inc., ESRI. Roads. 2005.
U.S. Environmental Protection Agency. 303(d) streams, 1:24,000; 2002.
US Geological Survey, National Hydrography Dataset Plus, 1:100,000.U.S. Geologic Survey, Utah, Wyoming, New Mexico GAP Analysis Project (100 meter) Land
cover/Land use.
U.S. Geological Survey, 2005, Mineral Resources Data System: U.S. Geological Survey, Reston,
Virginia. Active Mines
5. Flow Regime
Number of Miles of Storage (acre- CSI Score
dams Canals ft)/stream mile
GE 5 GE 20 GE 2,500 1
3–4 10 – 19.9 1,000 – 2,499 2
2 5 – 9.9 250 – 999 3
1 1 – 4.9 1- 249 4
0 0 – 0.9 0 5
Score for worst case.
Source: U.S. Army Corps of Engineers. Dams, March 22, 2006
US Geological Survey, National Hydrography Dataset Plus, 1:100,000.
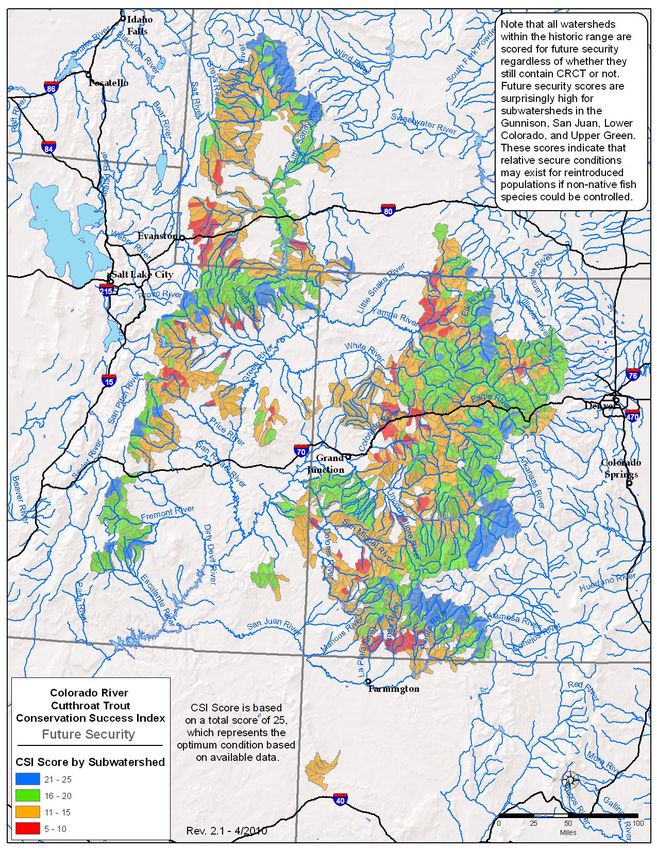
Future Security
Scored for all subwatersheds in historic range.
1. Land Conversion – modeled based on slope, land ownership, roads, and urban areas.
Land Vulnerable to Conversion CSI Score
81 – 100% 1
61 – 80% 2
41 - 60% 3
21 - 40% 4
0 – 20% 5
Sources: National Atlas, Land ownership.
Tele Atlas/GDT, Population centers, 1:300,000; 1997.
Tele Atlas/GDT, Road network, 1:100,000; 2002.USGS Digital Elevation Model. 30 meter.
2. Resource extraction
Forest Hard Metal CSI
management Mine Claims Score
51-100% 51 -100% 1
26 – 50% 26-50% 2
11 – 25% 11-25% 3
1 – 10% 1 – 10% 4
0% 0% 5
Score for worst case.
Source: Timber management potential identifies productive forest types using the existing
vegetation type in the Landfire dataset. The number of mining claims was determined using
Bureau of Land Management data, and each claim was assumed to potentially impact 20 acres.
Protected areas data were compiled from the ESRI, Tele Atlas North American / Geographic
Data Technology dataset on protected areas and the U.S. Department of Agriculture, Forest
Service’s National Inventoried Roadless Areas dataset.
3. Energy Development
Leases or CSI Score
reserves
New Dams New Dams 4th 6th
51-100% ≥0 ≥1 1
26 – 50% 3 2
11 – 25% 2 3
1 – 10% 1 4
0% 0 5
Score for worst case.
Source: Wind resources (“Good” and better) from Wind Powering America/National Renewable
Energy Lab (NREL). Coal leases are mineable types from the Coal Fields of the United States
dataset. Geothermal known and closed lease areas and oil and gas leases and agreements from
BLM Geocommunicator. ∗ Potential dam sites are based on Idaho National Laboratory (INL)
∗
Several geospatial data types are available from Geocommunicator, and they have the following definitions:
Lease: Parcel leased for oil and gas production.
Agreement: An ‘agreement’ between operator and host (private or public) to evaluate geological, logistic, geophysical, etc issues involving a
concession. The agreement essentially allows a technical evaluation of lease feasibility.hydropower potential data. Protected areas data were compiled from the ESRI, Tele Atlas North
American / Geographic Data Technology dataset on protected areas and the U.S. Department of
Agriculture, Forest Service’s National Inventoried Roadless Areas dataset.
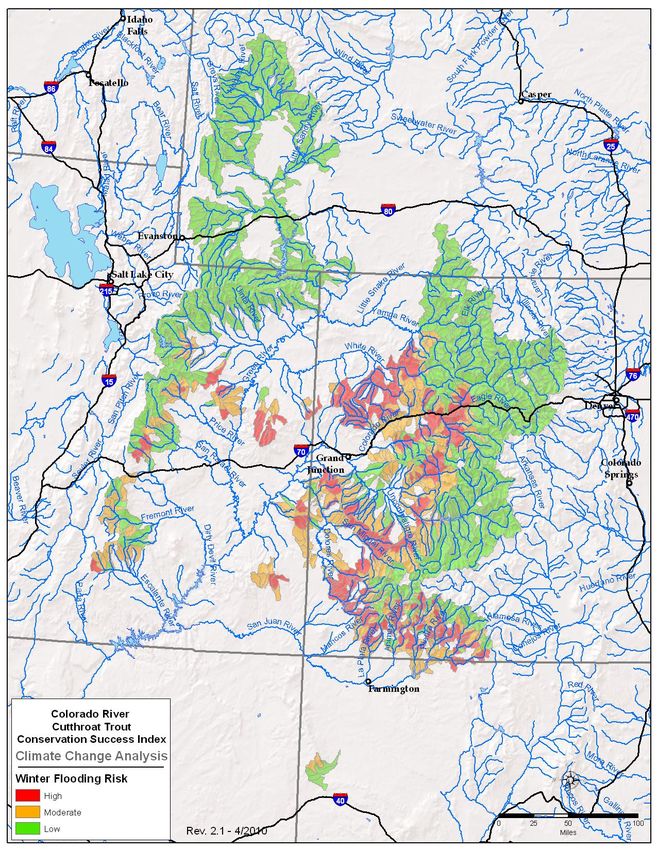
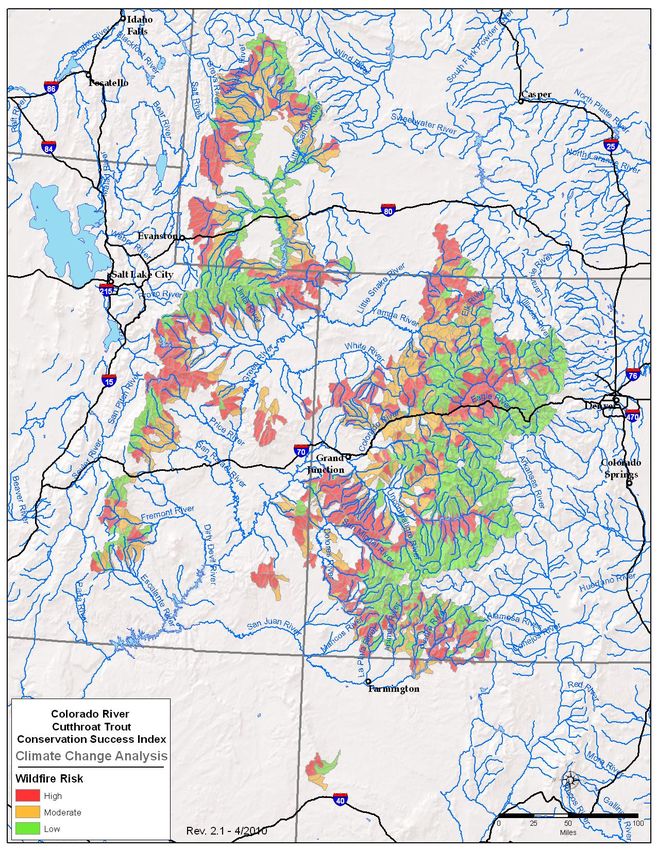
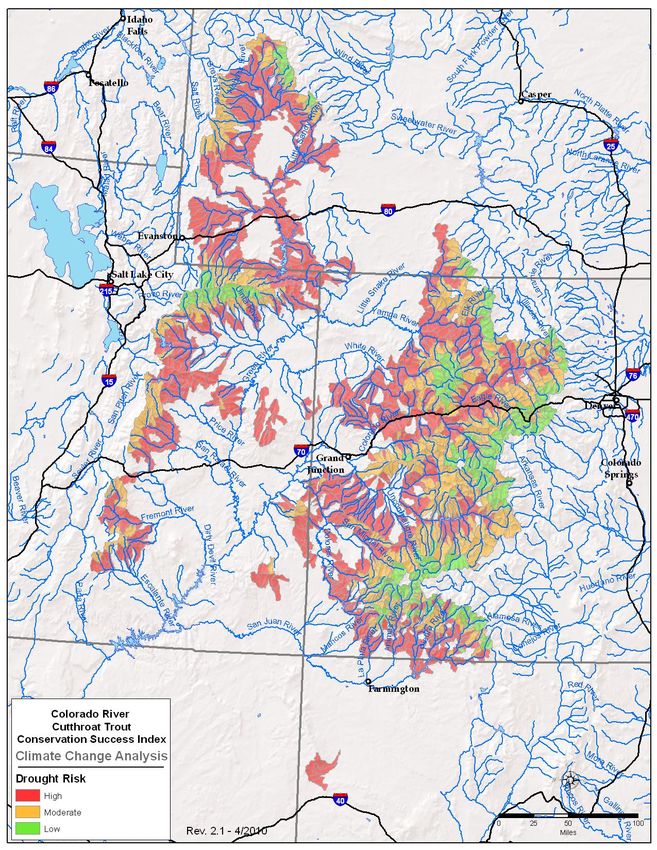
4. Climate Change
TU Climate Change Analysis
Climate Risk Factors CSI Score
High, High, Any., Any 1
High, Any, Any, Any 2
Mod., Mod., Mod, (Mod or Low) 3
Mod, Mod, Low, Low 4
Low, Low, Low, (Mod or Low) 5
Source: Temperature and precipitation data were obtained from the PRISM Group. Elevation
data was obtained from the National Elevation Dataset, and LANDFIRE data for the Anderson
Fire Behavior Fuel Model 13 was used as input for wildfire risk. The Palmer Drought Severity
Index was used for drought risk, but was adjusted for elevation (elevations above 2690 have
lower risk) and the deviation from mean annual precipitation (areas with more precipitation on
average have lower risk).
5. Introduced Species – primary scoring based on Genetic Risk table (unknown = present)
Present in Present in Road Density CSI Score
4th 6th
Yes Yes Any 1
Yes No GT 4.7 2
Unit Agreements: Multiple entities go in collectively on an agreement. Implied: there are limits to the number of agreements that one
individual entity can have outstanding, and a unit agreement allows them to get around the limit.
Communitization: Combining smaller federal tracts to meet the necessary minimum acreage required by the BLM (for spacing purposes).
Authorized: Bid on and sold lease or authorization, ready for production.
Lease Sale Parcel: Parcel slated for auction but not yet sold.
Closed: Not retired, just expired and may become available and open to resubmittal.
Other Agreements: Catch-all for other agreement types.Yes No 1.7 - 4.7 3
Yes No LT 1.7 4
No No Any 5
If genetic risk data is not available for the 6th order HUC
Present in Road Density CSI Score
4th
Yes GT 4.7 1
Yes 3.7 – 4.7 2
Yes 2.7 – 3.7 3
Yes LT 2.7 4
No any 5
If genetic risk data is not available for the 6th or 4th order HUCs
Road Density CSI Score
GT 4.7 1
3.7 – 4.7 2
2.7 – 3.7 3
1.7 – 2.7 4
LT 1.7 5
Source: Hirsch et al. 2005.
Tele Atlas North America, Inc./Geographic Data Technology, Inc., ESRI. Roads. 2005.You can also read