Scalable monitoring tools - a mile-high view - Network Startup Resource Center www.ws.nsrc.org - Network Startup ...
←
→
Page content transcription
If your browser does not render page correctly, please read the page content below
Scalable monitoring tools
   - a mile-high view
       Network Startup Resource Center
              www.ws.nsrc.org

 These materials are licensed under the Creative Commons Attribution-NonCommercial 4.0 International license
 (http://creativecommons.org/licenses/by-nc/4.0/)
Contents
•   Problem
•   Requirements
•   Solutions
•   ELK stack
•   TICK stack
•   Prometheus
•   TimescaleDB
•   Kafka
Overview
The Problem(s)
SNMP polling is…
  – Slow
  – Resource intensive
  – Not fine-grained enough
This leads to…
  – Slow response to network changes
  – Difficult to implement tools on large networks
  – Harder to datamine and alert
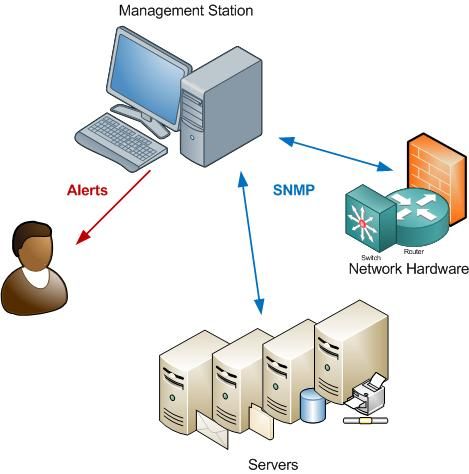
Classical Polling Model

Requirements
• Timeseries storage
• EVENT LOGS and METRICS
    – Events => syslog, snmp traps, netflow
    – Metrics => counters, gauges
•   Searching and Visualisation
•   Alerting
•   Scale to large volumes of data
•   APIs and integration options
Some Solutions
Go from polling to push/passive model
  – Network telemetry, not standardized yet
    • Cisco compact Google Protocol Buffers
    • Google Protocol Buffers
    • JSON
  – Logging data push solutions
    •   Agent-based
    •   Collectors and parsers
    •   NoSQL database stores
    •   Visualization and alerting systems
“Network Telemetry”
ELK vs. TICK
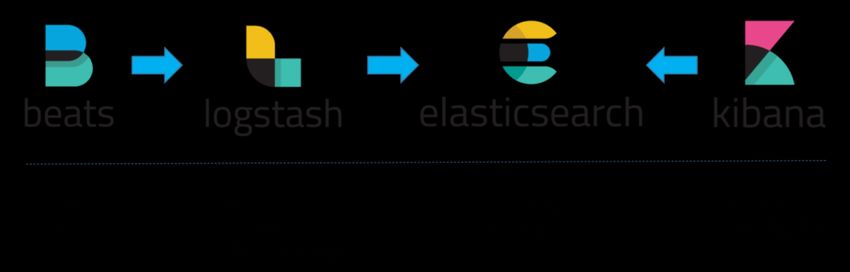
The “Elastic Stack”
ELK or “Elastic Stack”
– Elasticsearch: NoSQL Database / Search and
analytics engine
– Logstash: Log analysis and aggregator
– Kibana: Visualization layer
Beats - Outsourcing some Logstash functions.
Some examples include:
– Filebeat: logging agent on clients sending log data to
Logstash or Elasticsearch directly.
– Metribeat: forwards server metrics
– Packetbeat: forwards network dataELK vs. TICK
ELK vs. TICK
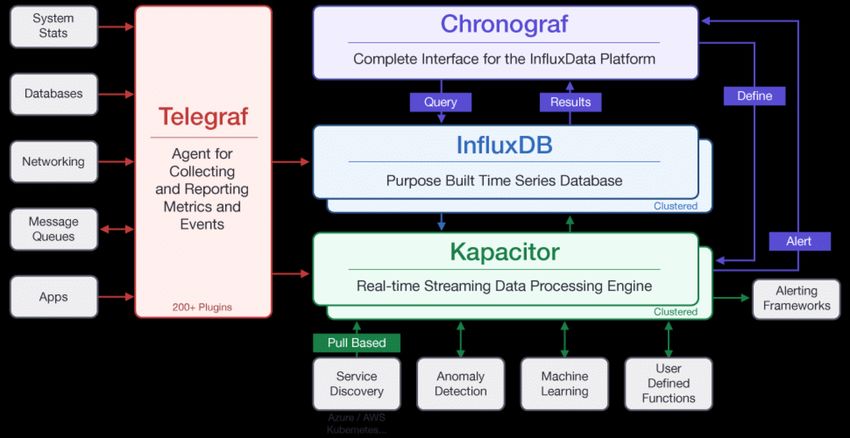
TICK Stack
TICK:
– Telegraph: Metrics collection. Sends to
InfluxDB
– InfluxDB: Time series, NoSQL database
– Chronograf: UI layer. Connects to InfluxDB
and Kapacitor.
– Kapacitor: Metrics and events processing
and alerting engine.ELK vs. TICK
ELK and TICK
 Comparing the Stacks – Over generalizing!
• ELK for log-based information
• TICK for network and log with alerting

Logstash                çè    Telegraph
Elasticsearch ç è             InfluxDB
Kibana                  çè    Chronograf
Plugin to Elasticsearch ç è   Kapacitor
Beats                   çè    Standards like Google
                              Protocol Buffers (GPB)
Many other tools…
• Kafka and KSQL
– Logstash and Elasticsearch (ELK)
– Telegraph and InfluxDB (TICK)
• Prometheus
– Like ELK and Tick but uses http pull to build
time-series (NoSQL) data.
• Grafana
– Like Kibana, but used for metrics analysis vs.
exploring log data.Many other tools…
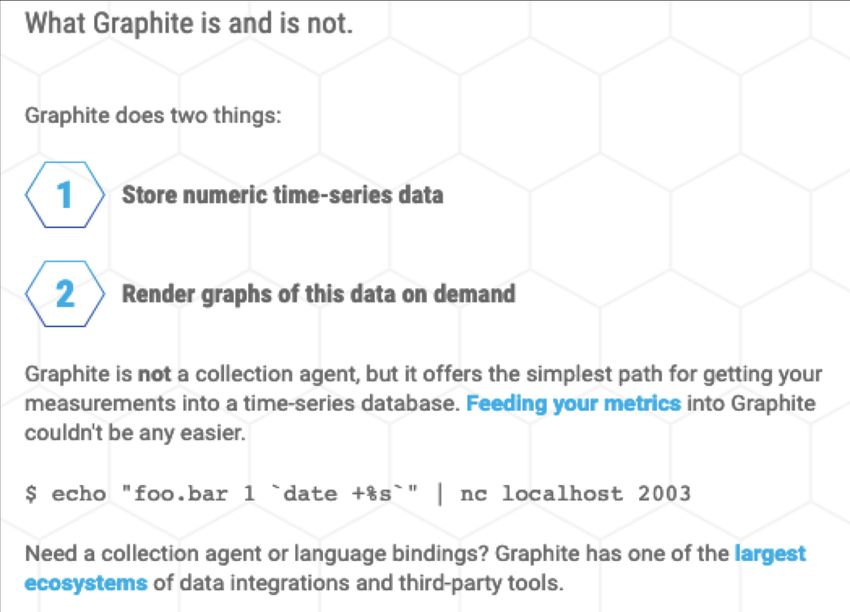
• Graphite
– Time-series, NoSQL DB and logger/grapher
• Splunk
– Captures, indexes, correlates real-time date
to generate graphs, reports, alerts,
dashboards, and visualizations.
• TimescaleDB
– Postgres-based, time-series DB, no stack but
plugs inGraphite
https://graphiteapp.org/Details
What's a timeseries?
• A set of (timestamp, value) points
• Need a way to identify all the points
  belonging to the same timeseries
  – Usually this is done by unique set of "tags"
  – {metric="ifHCInOctets",
    device="1.2.3.4", ifDescr="Gi0/1"}
• Timeseries constantly growing; eventually
  need to expire old data
The Elastic Stack (ELK)
Beats Logstash Elasticsearch Kibana
("The BLEK Stack" doesn't sound as good)Architecture • Elasticsearch: JSON document database – An Elasticsearch database is called an "index" – Built on Lucene free-text search engine – Supports replicated and sharded clusters • Logstash ingests and processes logs • Kibana provides search UI and graphing • Beats are lightweight, standalone data collectors
ELK Pros
• Long-standing and widely deployed
  – cloud-hosted services available, or DIY
• Fast free-text searching
• Can be scaled horizontally
• Rich data model, including first-class
  support for IP addresses
• Wide range of useful Beats, inc. winlog
• Logstash supports Netflow
ELK Pros
• Elasticsearch is also a component of many
  platforms including Security Onion,
  Graylog, SIEMonster etc.
ELK Cons
• X-Pack Alerting is a commercial add-on *
• Huge resource requirements
  – SSD recommended; but index typically 10
    times larger than the ingested data
  – Large RAM requirements
  – It's all Java (apart from Beats)
• Explicit time sharding usually required
  – e.g. create a separate index per day
       * Look at alternatives: elastalert, sentinl, grafana alerts
ELK Cons
• Not suited to metrics
– Expensive to scale up
– Logstash finally released SNMP input plugin
in October 2018
• Questionable reliability as a primary data
store?The TICK Stack
Telegraf InfluxDB Chronograf
KapacitorArchitecture
• Telegraf is data collector and processor
– SNMP polling, system and application
metrics, syslog
• InfluxDB is custom time series database
• Chronograf is admin UI and visualisation
– includes basic syslog browser
• Kapacitor is stream processing and
alertingTICK Pros • Lightweight binaries (Go); easy to install • Excellent metric support – Columnar storage with high compression • Stores int, float, text and bool natively • "SQL-inspired" query language is easy to get started with • Inline data processing via "continuous queries" and "subscriptions"
TICK Cons
• InfluxQL differences from SQL soon
  become apparent
  – single and double quotes are very different!
• Kapacitor has yet another language too
  – "TICKScript"
  – Plan to unify in InfluxDB 2.0 ("Flux")
• Alerting hard to set up, and not too
  intelligent
TICK Cons
• A columnar database isn't really suited to
event logs
– Cannot have two "rows" with the same
timestamp (but has nanosecond resolution)
– Text search is brute-force full column scan
• Maybe unpredictable RAM usage and
database corruption (but much improved)
• Horizontal scaling only in commercial
cluster productPrometheus
Exporters Prometheus AlertManager
Remote Grafana
StorageArchitecture • "Exporters" are simple HTTP endpoints that return metrics when queried • Prometheus contains polling engine, metric database, threshold detection, and rewriting/downsampling engine • Alertmanager processes and delivers alerts – e.g. can delay and aggregate related alerts • Basic query UI; use Grafana for dashboards
Architecture: "Pull" monitoring
• All polling is performed by prometheus
  – makes periodic outbound HTTP connections
  – This process is called "scraping" the target
• Exporters respond passively on request
  – easy to point additional prometheus servers at
    them, e.g. for redundancy or testing
  – monitored servers don't need to be told where
    the monitoring station is
Sample exporters
• node_exporter: local system metrics
• snmp_exporter: poll SNMP devices
• grok_exporter or mtail: generate metrics
from parsing log files
• blackbox_exporter: nagios-like service
checks
– can also integrate with real nagios: e.g.
nagios_exporter, nrpe_exporterPrometheus Pros
• Massively scalable and efficient
– handles millions of timeseries
– typically less than 2 bytes per data point
• Pretty easy to install
– static binaries with no dependencies
• Wide ecosystem, easy to extend
– With node_exporter, just drop custom metrics
into a file and you're done!Prometheus Cons
• Metrics only (one data type: float64)
• Not designed for long-term storage
– Default is 14 days. You can increase this but
must be same for all metrics
– Can scrape to a second Prometheus instance
or archive to another type of database
• Functional query language is powerful but
hard to get to grips withTimescaleDB
TimescaleDB
Prometheus Grafana
rsyslog Redash
syslog-ngArchitecture • TimescaleDB is an extension to Postgres • Transparently creates table chunks for different time ranges – Prevents indexes getting too large – Most activity is in most recent chunk – Very cheap to expire old chunks • Adds some aggregation functions too
TimescaleDB Pros
• It's Postgres!
  – Rock-solid data storage
  – Reliable backup and restore, replication
  – Use existing DBA skills
  – Full power of SQL in queries
TimescaleDB Cons
• It's just a database – you need to build the
  stack yourself
  – Creating schemas
  – Getting data in and out
  – Alerting (maybe Grafana's alerting is OK?)
• Fits easily with Prometheus, but not TICK
• Uses substantially more storage space
  than InfluxDB or Prometheus
Beats
                       Kafka
           Logstash       Kafka         ELK

           Telegraf                     TICK
                          zookeeper

            rsyslog
           syslog-ng                             JDBC
                                                  Sink   SQL
  JDBC
  Source    Kafka                       Kafka
           Connect                     Connect
                       Kafka Streams
SQL                                                      HDFS
                           KSQL
           Debezium        Faust
                                                      Hadoop
                                       ... etc       ecosystem
Architecture • Kafka is really just a big queue • Append messages to "topics" • Subscribe in "consumer groups" – each consumer group receives a copy • Messages aren't deleted until you say so – Consumers can rewind and replay – Potentially query in place (e.g. Apache Drill)
Kafka Pros
• System decoupling
  – e.g. use Beats outside of ELK
  – bolt on new alerting/analysis tools
  – write your own custom stream processing
• Massively scalable and reliable
  – Topics can be partitioned and replicated
• Can act as a long-term archive
  – Append-only model is efficient even with HDD
Kafka Cons
•   Not a complete monitoring stack
•   Not one but two Java services to maintain
•   No integrated admin UI, several to choose
•   You have to decide the message format
    – Telegraf JSON? Beats JSON? fluentd JSON?
      InfluxDB line protocol? CSV? Avro? ...
• Not well suited to Prometheus "pull" model
Honorable mentions
• netdata
– awesome tool for performance debugging
– configures itself out of the box
– system metrics at 1 second resolution by
default, retained for one hour in RAM
• fluentd (td-agent)
– extensible in ruby; maybe worth looking at for
very custom requirements
– focus is on events rather than metricsInteresting notes • Grafana can be used with Prometheus, InfluxDB and Elasticsearch – mixed dashboards are possible • Grafana can do basic alerting by itself – maybe you find this easier • Prometheus remote storage can read and write to InfluxDB and TimescaleDB
Consider when choosing
• All of these (apart from TimescaleDB)
  have esoteric query languages you'll have
  to learn
• Managing large Java apps can be difficult
  if you don't have the skillz
• How do you feel about separate stacks for
  metrics and logs?
References
• Kafka
  https://docs.confluent.io/current/streams-ksql.html
• Graphite
  https://graphiteapp.org/
• InfluxDB
  https://www.influxdata.com/
• Logz.io (Information on Elastic Stack, others)
  https://logz.io/
• Prometheus
  https://prometheus.io/
References
• Splunk
  https://www.splunk.com/
• Cisco Telemetry with Google Protocol Buffers
  https://blogs.cisco.com/sp/streaming-telemetry-with-google-protocol-buffers

• Cisco Model Driven Telemetry
  https://www.cisco.com/c/en/us/solutions/service-provider/cloud-scale-
  networking-solutions/model-driven-telemetry.html

• Tick Stack on CentOS
  https://www.digitalocean.com/community/tutorials/how-to-monitor-system-
  metrics-with-the-tick-stack-on-centos-7

• TimescaleDB
  https://www.timescale.com/
The End!

Questions?
You can also read