Air Quality Index of Most Polluted Cities of India during COVID-19 Lockdown - IJSDR
←
→
Page content transcription
If your browser does not render page correctly, please read the page content below
ISSN: 2455-2631                                                                             © May 2020 IJSDR | Volume 5, Issue 5

      Air Quality Index of Most Polluted Cities of India
                during COVID-19 Lockdown
                                                           1
                                                               NAMBI HARISH
                                                           1
                                                          Assistant Professor
                                                    1
                                                    Department of Civil Engineering,
                    1
                      N.B.K.R. Institute of Science & Technology, Vidyanagar, SPSR Nellore District, A.P., India.

 Abstract: This study reports the statistics of PM2.5 and Air Quality Index (AQI) levels of most polluted regional countries
 and cities of India with respect to COVID-19 lockdown conditions. The dataset of PM2.5 and AQI level where collected
 from automatic air quality monitoring portal developed by the Central Pollution Control Board (CPCB), Government of
 India for the period of 24th March 2020 to 02nd May 2020. The annual average AQI, average PM2.5 data was collected
 from the World Economic Forum annual reports. Later the data was compared for the COVID-19 lockdown period to
 emphasis the change in air pollution conditions of the major cities and the capital of India.

 Index Terms: PM2.5, Air Quality Index (AQI), COVID-19 lockdown period, World Economic Forum, Central Pollution
 Controll Board.
 ________________________________________________________________________________________________________
I. INTRODUCTION
 While the coronavirus pandemic affects millions around the globe and brings economies to a grinding halt, there's plenty of debate
 about how fuel-combustion emissions have plummeted dramatically in many nations. Yet this is often no solution to pollution and
 global climate change. For while eerily empty cities are also bathed in blue skies, millions are suddenly out of labor and wondering
 how they're visiting take care of their families. The poor and most vulnerable will suffer the foremost from both the health impacts
 and also the economic condition. Cleaner air for some months maybe a small bright side to COVID-19’s dark clouds, but will do
 little within the long term to resolve the matter of outside pollution that kills over four million people once a year. For that, we'd like
 to give up our habit of burning coal, oil, and gas. [1]
 People living in cities with high emissions are more likely to own impaired respiratory, cardiac, and other systems – and therefore
 are more vulnerable to the impacts of COVID-19. One in each of the refrains all people are hearing because the coronavirus spreads
 is to quit smoking. But what about 90% of individuals worldwide who are exposed to high levels of pollution. they cannot value more
 highly to quit breathing the air where they live. On every continent, people suffer the negative health impacts of pollution. Living in
 Delhi is cherish smoking six cigarettes every day. Individual respiratory systems in California and Australia are jeopardized by smoke
 from forest fires exacerbated by climate change. Wuhan residents have suffered for years from bad air quality, and pollution
 demonstrations took place only last summer.
 A study by researchers at UCLA's Public Health School found during the SARS outbreak in China that patients with SARS were
 more than twice as likely to die from the disease if they came from high pollution areas.
 While it’s too early to prove a straight away correlation between current high pollution levels and incidence of COVID-19, high
 pollution levels may additionally increase the danger of contracting COVID-19 within the primary place, because the things has the
 potential to act as carriers for contagion leading to rapid meet larger areas.
 A paper published by the Italian Society of Environmental Medicine indicates that "the rapid rise in infection levels affecting some
 areas of Northern Italy could be related to ambient particulate contamination that acts as a carrier and booster there." The first link
 between emissions and COVID-19 deaths within the US has just been found in a Harvard study.
 India’s Central Pollution control panel (CPCB), recently reported an improvement in air quality within the country. CPCB data
 suggests a virtually 71% fall in gas levels. Several major cities— Indian capital, Kolkata, Mumbai, Bengaluru, and Chennai — have
 witnessed a fall within the Air Quality Index (AQI). For instance, in New Delhi's Anand Vihar, often recognized as one of the capital's
 top polluted areas, AQI was registered at 5 p.m. on April 22 at 65. The index had passed the 400 marks on many occasions last year,
 and stayed high for the most part.
 The National Green Tribunal (NGT), India’s environment monitoring board, has also confirmed that the nationwide lockdown has
 improved the air quality.
 The present study was divided into two folds, firstly, it focuses on the comparison of the air quality index of India with other south
 Asia countries, and also the highly polluted cities of India in terms of AQI levels. Later, in the second stage, the AQI levels during
 the lockdown period of those top cities were compared with the historical AQI data of the same period.
II. DATA COLLECTION
 The AQI data set for the present study was collected from the automatic monitoring data portal of the Central Pollution Control Board
 (CPCB), Ministry of Environment, Forest, and Climate Change for the period of 24th March 2020, the day when the Prime Minister
 of India declared a completed lockdown of India to 02nd May 2020, a day after the declaration of 14 days extension to the existing
 period till 03rd May 2020. The annual average PM2.5, AQI for the years 2018 and 2019 was extracted from the World Air Quality

   IJSDR2005012             International Journal of Scientific Development and Research (IJSDR) www.ijsdr.org                       56
ISSN: 2455-2631                                                                           © May 2020 IJSDR | Volume 5, Issue 5

 Report:Region & City PM2.5 Ranking published by World Economic Forum. Simple trend patrren was developed to find the existing
 scenario and its implication in the future.

III. METHODOLY
 The Air Quality Index (AQI) is one of those instruments to effectively disseminate knowledge about air quality to people. There are
 six types of AQI, namely Good, Satisfactory, Bad, Very Bad, and Severe. The proposed AQI will consider eight pollutants (PM10,
 PM2.5, NO2, SO2, CO, O3, NH3, and Pb) that short-term (up to 24-hourly averaging period) National Ambient Air Quality Standards
 are prescribed.
 A sub-index is determined for each of these contaminants based on the measured atmospheric concentrations, corresponding
 requirements, and sure health effects. The worst sub-index reflects overall AQI. Related possible health impacts are also proposed
 for various AQI groups and pollutants, with primary feedback from the group's health worker participants. The AQI values and
 corresponding health breakpoints are as follows, however, CPCB also listed its associated probable health effects for the eight
 pollutants.
           Table. 1 : Breakpoint pollutant concentration for Indian Air Quality Index (IND-AQI, CPCB, October 2014) [3]
                                      AQI Category, Pollutants and Health Breakpoints
          AQI Category          PM10    PM2.5       NO2          O3        CO       SO2                      NH3           Pb
            (Range)             24-hr   24-hr      24-hr        8-hr      8-hr      24-hr                    24-hr        24-hr
                                                                        (mg/m3)
          Good (0-50)            0-50    0-30       0-40        0-50      0-1.0     0-40                     0-200        0-0.5
        Satisfactory (51-
                                51-100      31-60        41-80       51-100      1.1-2.0       41-80        201-400      0.5 –1.0
              100)
       Moderately polluted
           (101-200)
                               101-250      61-90       81-180      101-168      2.1- 10      81-380        401-800      1.1-2.0

              Poor
            (201-300)          251-350      91-120      181-280     169-208       10-17       381-800      801-1200      2.1-3.0

            Very poor
            (301-400)                                                                                        1200-
                               351-430     121-250      281-400     209-748*      17-34      801-1600                    3.1-3.5
                                                                                                             1800
              Severe
            (401-500)           430 +        250+        400+        748+*         34+         1600+         1800+         3.5+

 According to CPCB, the AQI Monitoring and Estimation Procedure adopted in India is as follows [3] (Source CPCB):
 1.        The Sub-indices for individual pollutants at a monitoring location is calculated using its 24-hourly average concentration
 value (8-hourly in case of CO and O3) and health breakpoint concentration range. The worst sub-index is the AQI for that location.
 2.        All the eight pollutants may not be monitored at all the locations. Overall AQI is calculated only if data are available for a
 minimum of three pollutants out of which one should necessarily be either PM2.5 or PM10. Else, data are considered insufficient for
 calculating AQI. Similarly, a minimum of 16 hours’ data is considered necessary for calculating the subindex.
 3.        The sub-indices for monitored pollutants are calculated and disseminated, even if data are inadequate for determining AQI.
 The Individual pollutant-wise sub-index will provide air quality status for that pollutant.
 4.        The web-based system is designed to provide AQI on a real-time basis. It is an automated system that captures data from
 continuous monitoring stations without human intervention and displays AQI based on running average values (e.g. AQI at 6 am on
 a day will incorporate data from 6 am on the previous day to the current day).

IV. RESULTS AND DISCUSSIONS
 Based on available major city data, the average PM2.5 estimate is calculated as a regional sample and then weighted by population.
 According to the data collected from World Economic Forum WEF, based on estimated average PM2.5 concentrations (µg/m3),
 India stands at 3rd and 5th into the top 10 countries for the year 2018 in Fig. 1 and 2019 in Fig. 2 respectively [1][2].

   IJSDR2005012             International Journal of Scientific Development and Research (IJSDR) www.ijsdr.org                      57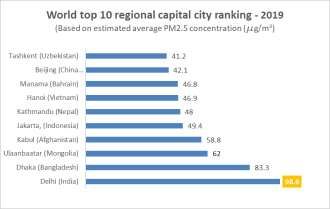
ISSN: 2455-2631                                                                     © May 2020 IJSDR | Volume 5, Issue 5

          Fig. 1 World top 10 Country/region ranking 2018 (Based on estimated average PM2.5 concentration (µg/m3)

          Fig. 2 World top 10 Country/region ranking 2019 (Based on estimated average PM2.5 concentration (µg/m3)

According to the data collected from World Economic Forum WEF, based on estimated average PM2.5 concentration (µg/m3), Delhi
stands at the top of the world regional capital city rankings for the continuous years 2018 in Fig. 3 and 2019 in Fig. 4. [5]

       Fig. 3 : World top 10 regional capital city ranking 2018 (Based on estimated average PM2.5 concentration (µg/m3)

  IJSDR2005012           International Journal of Scientific Development and Research (IJSDR) www.ijsdr.org               58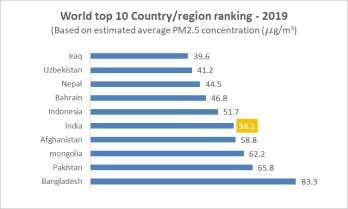
ISSN: 2455-2631                                                                             © May 2020 IJSDR | Volume 5, Issue 5

         Fig. 4 World top 10 regional capital city ranking 2019 (Based on estimated average PM2.5 concentration (µg/m3)

It is interesting to notice that, although Delhi typically receives most media coverage together of the world’s “pollution capitals”, the
national capital “only” ranks 10th for annual PM2.5 concentration. Other cities in Northern India and Pakistan have a better annual
PM2.5 point, with nearby Gurugram resulting in the best annual concentration of any global city reported here in 2018.
2019 saw the introduction of India's first NCAP, marking a change in India's dedication to combating air pollution. The NCAP aims
to minimize air pollution from PM2.5 and PM10 in 102 cities by 20-30 percent compared to 2017 rates by working directly with
local governments to develop more tailored regulations and targets (Government of India, 2019). In addition, India joined the UN
Environment & Clean Air Coalition (CCAC) as the 65th member in July 2019 to collaborate with global leaders on solutions to air
pollution. Though the long-term effects of these initiatives are yet to be seen, in 2019 India saw significant changes in PM2.5 rates
compared to the previous year as a result of economic slowdown, favorable weather conditions, as well as more committed efforts to
clean up the environment. Fig.5 & Fig. 6.

                                              Fig.5: Most Polluted Cities of India – 2018

                                              Fig.6: Most Polluted Cities of India – 2019

Recently, air pollution levels have begun to drop drastically, as the second-most populous nation endures a 21-day lockdown amid
coronavirus fears in the second week.
Though India's economy's complete shutdown was intended to halt the spread of COVID-19, it has an ancillary health benefit of
clearing the air that millions of people were strangling at. As vehicles keep off the lane, construction is put on hold, and factories are
halted production, the amount of microscopic particulate matter, or PM 2.5, is began to decline.

  IJSDR2005012             International Journal of Scientific Development and Research (IJSDR) www.ijsdr.org                      59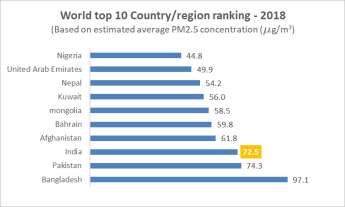
ISSN: 2455-2631                                                                       © May 2020 IJSDR | Volume 5, Issue 5

Air quality in New Delhi, normally the worst in the world, has plummeted to "satisfactory" levels since the March 25 lockdown that
forced 1.3 billion Indians to stay home. The Cities which were recorded top ranks in the most polluted cities of India had shown a
decrease in pollution due to long lockdown.
The comparative AQI Levels of most polluted cities of India since the day of the complete lockdown is shown graphically in Fig. 7
(a) to (f) [4]

                                                            Fig.7 (a)

                                                            Fig.7 (b)

                                                            Fig.7 (c)

                                                            Fig.7 (d)

  IJSDR2005012            International Journal of Scientific Development and Research (IJSDR) www.ijsdr.org               60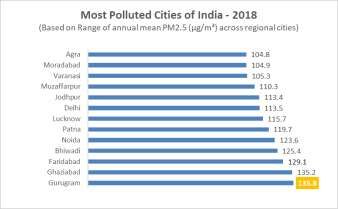
ISSN: 2455-2631 © May 2020 IJSDR | Volume 5, Issue 5
Fig.7 (e)
Fig.7 (f)
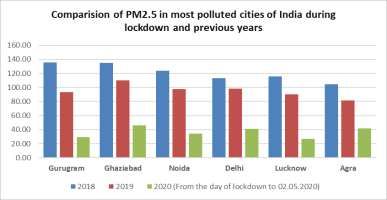
Also, the PM2.5 Concentrations is compared for the same station with the previous two annual averages, i.e. 2018 and 2019 in Fig.
7.
Fig. 8 Comparison of PM2.5 in most polluted cities of India.
Hence, the COIVD-19 lockdown period has created a break point in India's drastically changing climatic conditions. This may not
be the long-term relief but will slow the climate change trend. On the other side of the coin, it is also time for the government to
reframe economic policies in such a way as to normalize the impact of COVID-19 on the economy in view of the favorable climatic
conditions.
V. ACKNOWLEDGMENT
The author is thankful to The Central Pollution Control Board of India is a statutory organisation under the Ministry of Environment,
Forest and Climate Change for providing Automatic air Quality Monitoring portal for public usage and World Economic Forum for
the publishing World Air Quality Report : Region & City PM2.5 Ranking 2018 and 2019.
REFERENCES
[1] World Economic Forum, “World Air Quality Report : Region & City PM2.5 Ranking 2018”.
[2] World Economic Forum, “World Air Quality Report : Region & City PM2.5 Ranking 2019”.
[3] Central Pollution Control Board of India, “NATIONAL AIR QUALITY INDEX : AQI Category, Pollutants and Health
Breakpoints, 2014.”
[4] https://cpcb.nic.in/automatic-monitoring-data/
[5] https://www.weforum.org/
IJSDR2005012 International Journal of Scientific Development and Research (IJSDR) www.ijsdr.org 61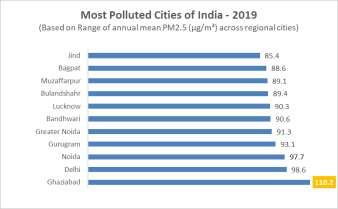
You can also read