Review of mapping processes using technologies
←
→
Page content transcription
If your browser does not render page correctly, please read the page content below
E3S Web of Conferences 258, 03021 (2021)                                    https://doi.org/10.1051/e3sconf/202125803021
UESF-2021

         Review of mapping regional demographic
         processes using innovative methods and
         technologies
         Sarvar Abdurakhmonov1,*, Eshkobul Safarov2, Murat Yakubov3, and Shavkat Prenov2

         1
           Tashkent Institute of Irrigation and Agricultural Mechanization Engineers, Kari-Niyazi
         str., 39, 100000, Tashkent, Uzbekistan
         2
           National University of Uzbekistan, University str., 4, 100174, Tashkent, Uzbekistan
         3
           Research Institute of Irrigation and Water Problems, Karasu-4, 11, Tashkent, Uzbekistan

                   Abstract. Different types of methods in science and technology, such as
                   statistical, cartographic, and satellite materials are being used to describe events
                   and objects. The application of modern GIS technologies in collection and
                   processing of data on regions, demographic processes and events is highly
                   demanding in demographic studies. The main feature of GIS software is to
                   integrate and analyze geographic spatial data, and create map. In this research, it
                   was found that classification and creation of demographic data in regions using
                   GIS software helped to regulate the demographic processes in the regions.

         1 Introduction
         In recent years, enormous research and studies have been conducted in all sciences and
         fields, and unprecedented results have been achieved. In particular, the development of
         cartography and geo-informatics as a science, technology and industry is no secret to any
         specialist [1, 2]. The advent of Geographic Information Systems (GIS) in science has led to
         the rapid development of the industry with images. The main content of all GIS is an
         automated cartographic system, a combination of software and computer equipment
         designed to create and use maps, solve various problems [4, 7]. GIS technologies play very
         important role in mapping demographic processes using geographic data. An expanded
         database of cities, towns and villages can be formed when creating digital maps
         summarizing demographic processes [5, 6]. With the introduction of innovative
         technologies, statistical information relevant to the population based on new data on the
         ground can be received online from local officials and integrated with a geo-data database,
         which allows to constantly monitoring the dynamics of the population. At present, almost
         all maps are created using GIS technologies, and interdependence and integration of geo-
         informatics as well as cartography can be easily seen in a mapping process [10, 13]. It is
         stated that the interrelation of cartography and geo-informatics in demographic map can be
         seen in the following stages [3]: 1) in GIS programs, linking spatial data to a single
         coordinate system, and using a large-scale topographic maps; 2) entering remote sensing

         *
             Corresponding author: s.abduraxmonov@tiiame.uz; s.n.abduraxmonov@gmail.com

   © The Authors, published by EDP Sciences. This is an open access article distributed under the terms of the Creative
   Commons Attribution License 4.0 (http://creativecommons.org/licenses/by/4.0/).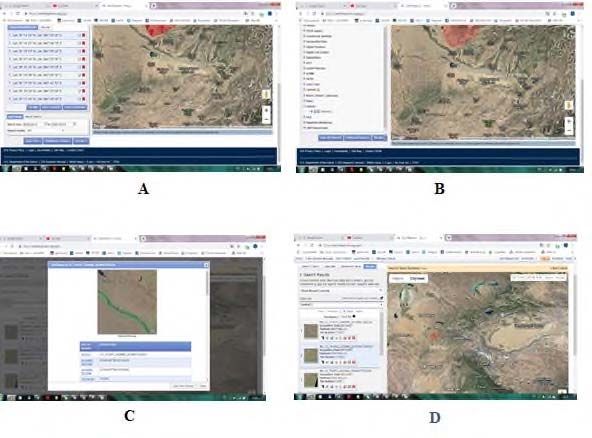
E3S Web of Conferences 258, 03021 (2021)                             https://doi.org/10.1051/e3sconf/202125803021
UESF-2021

         data and other information (statistical and analytical) used in GIS software into computer
         memory; 3) Vectorization of data in the form of digital maps to form a component of GIS
         technology databases; 4) stratification of the thematic structure of spatial objects.
            A number of practical tasks related to demographic changes and mapping those ones
         can be accomplished using GIS software. Furthermore, the application of scientific ideas
         based on integrated, excellence-based geo-information research in the creation of
         demographic maps creates opportunities for systematic socio-economic study of the
         population [8, 9, 11].
            Large-scale electronic digital maps are being developed and used in software programs
         belonging to the GIS family (ArcGIS, QGIS and MapInfo). The study of demographic
         processes in regions based on GIS technologies and cartographic methods encompassed the
         formation and geolocation of databases in mapping, spatial data modeling, integration,
         improvement of demographic processes and visualization [12-16]. Moreover, modeling of
         spatial data and geolocation of demographic processes using GIS technologies,
         development of recommendations for the use of innovative methods and technologies in the
         creation of demographic maps are the main GIS based step in demographic studies.

         2 Materials and methods
         Karshi city of Uzbekistan was selected as study site in this research. ArcGIS, QGIS,
         MapInfo programs, questionnaires, regional analysis, and geolocation methods belonging
         to the family of cartographic, aerospace, statistical, GIS technologies were used in the
         research process. A systematized structure, Demo GIS [2, 3] consisting seven stages was
         developed towards analyzing demographic situations in the regions and the creations of
         their digital maps (Fig. 1). Obviously, the formation of this created Demo GIS and map
         creation system accelerates work process and increases the quality of maps and data
         accuracy. Noteworthy, the existing mapping stages, which existed before the development
         of methods and technologies for creating electronic digital maps, involved very complex
         processes [5].
            In this research, the use of existing paper maps as a basis in the creation of digital and
         electronic maps of some regions does not give the expected result. Therefore, in order to
         solve the problem, it is necessary to create a cartographic basis. In this case, remote sensing
         materials were used to create a cartographic basis. The creation of a new cartographic basis
         provided for the use of images from the landscape spacecraft [11, 13, 14]. This method was
         useful in improving the quality and accuracy of the cartographic basis. The formation of
         fundamentally new stages in the process of preparation and copying of original map using
         the methods and technologies of digital mapping is directly related to the software
         belonging to the family of geographic information systems.
            NDVI was calculated using NDVI = (IQ-Q) / (IQ + Q) the formula [8, 10-12]. In this
         case, IQ is the infrared spectrum of the image; Q is the red spectrum of the image.

                                                       2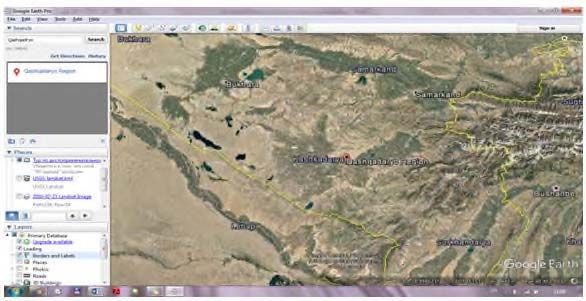
E3S Web of Conferences 258, 03021 (2021)                                 https://doi.org/10.1051/e3sconf/202125803021
UESF-2021

                                                   At the national
                                                 level - collection of
                                                        data on
                                                    administrative
                  Assess the capabilities          territories, their
                        of GAT and                     analysis.
                technologies in the study
                      of demographic                                            Within the object of
                 processes, as well as the                                      research - to provide
                selection and application                                      systematic input into
                   of the most effective                                       computer memory by
                      programs in the                                         analyzing demographic
                  implementation of the                                        data on settlements of
                 results of these studies.                                      the southern region.

                    Create a large-scale
                 three-dimensional (3D)
                                                                              Creating an electronic
                      model to reflect
                                                                               database Demo GIS
                 demographic processes
                                                                                     based on
                  in the southern region.
                                                                                  demographic
                                                                                    indicators.

                                                                    Development of data for the
                             Development of a                     creation of demographic maps
                             series of maps of                       and the creation of model
                               demographic                         layouts of maps to reflect the
                              processes in the                     demographic situation in the
                             southern region.                            southern regions.

         Fig. 1. Demo GIS structure in the creation of demographic maps.

                                                          3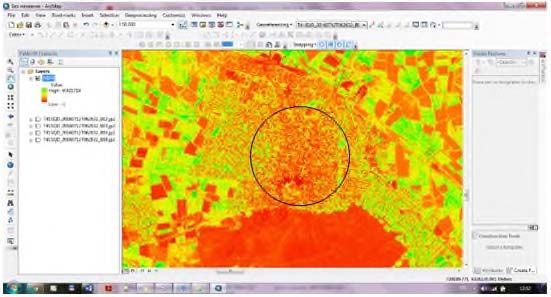
E3S Web of Conferences 258, 03021 (2021) https://doi.org/10.1051/e3sconf/202125803021
UESF-2021
3 Results and discussion
It was found that remote sensing methods provided good opportunities for monitoring and
analysis of demographic processes in the regions, as well as for the creation of maps based
on the collected results. In this section, analytical studies using several remote sensing
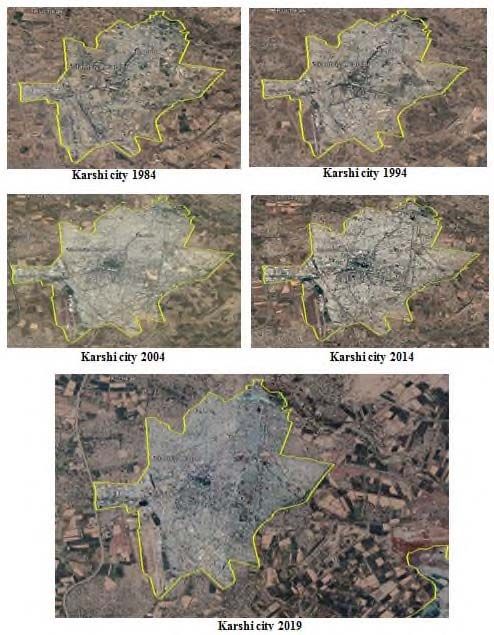
methods was reviewed. It was possible to capture high-resolution and continuous (in
months, years) satellite images of regions using Google Earth Pro. The main purpose of this
would be to track changes in housing over the years. It provided an opportunity to monitor
the expansion or contraction of the area occupied by residential areas due to growth and
decline in population, and to increase the accuracy of data in population maps created by
regions. Another advantage of Google Earth Pro was that it could be easily installed and
run even on non-highly configured computer. Obtaining a satellite image of the area using
Google Earth Pro was done in the following sequence: once Google Earth Pro was
launched, there desired area was found on the globe. This was done by searching or
searching the map for the location of the area (Fig. 2). The geographic location program
from the selected regions automatically found the desired area. From this, a district or city
settlement, where scientific research can be found, would be selected.
Fig. 2. Search window in Google Earth Pro.
Additionally, images of the area over the years can be seen using the View Historical
Images command. By moving the column to the left, images from previous years can be
easily seen. The screen save command saves the screen image to the computer's memory
(Fig. 3).
4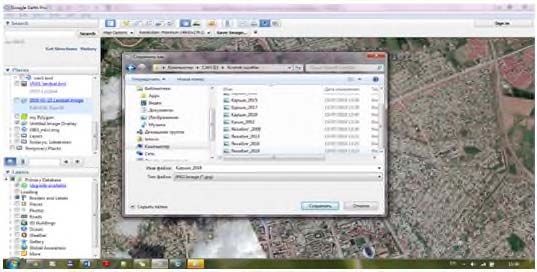
E3S Web of Conferences 258, 03021 (2021)                             https://doi.org/10.1051/e3sconf/202125803021
UESF-2021

         Fig. 3. Saving a spatial image to computer memory.
            All possibilities in the processing of remote sensing materials were taken into account.
         At the local level, monitoring of changes in settlements over the years was also carried out.
         Remote sensing materials made it possible to analyze changes in local settlements and
         changes in population and changes in the impact of migration, and it was observed that the
         location of the population relative to the local relief structure. Spatial images were analyzed
         and maps of demographic processes in the region were created based on the results
         obtained (Fig. 4).
            In order to monitor demographic processes in the field and to compile maps of
         demographic processes, as well as to increase the accuracy of the data on the maps,
         analytical work was carried out in the region. For this, satellite images were downloaded
         through the Earth Explorer geoportal (Figures 5 and 6) and exported to ArcGIS, and NDVI
         analysis was performed [15].

                                                         5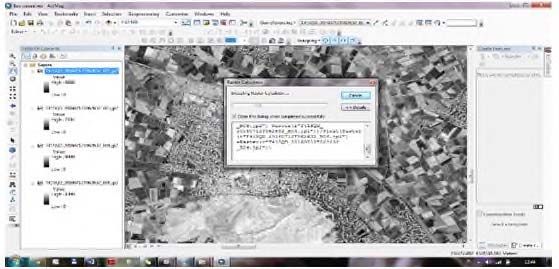
E3S Web of Conferences 258, 03021 (2021)                                https://doi.org/10.1051/e3sconf/202125803021
UESF-2021

         Fig. 4. Change of population settlement in Karshi city during 1984-2019 years.

                                                          6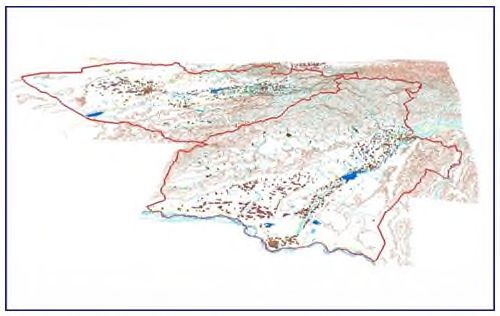
E3S Web of Conferences 258, 03021 (2021)                                 https://doi.org/10.1051/e3sconf/202125803021
UESF-2021

         Fig. 5. A visualized 3D model of residential areas in the southern region in 1984-2019.

         Fig. 6. A. Download space images via Earth Explorer geoportal, and B. Search window.
             The time period given in the criteria given is given when the image of the selected area
         is required (Fig. 7A). Once the desired area is selected, a system of space images in the
         database is selected. For example, images were taken by Landsat or Sentinel satellites.
         Multi-spectral images taken on the Landsat satellite had a resolution of 30 meters. One
         pixel in the photo covers an area of 30 meters by 30 meters. In the space image taken on the
         Sentinel-2 satellite, the resolution is 10 meters by 10 meters. The image of the Sentinel-2 is
         selected below (Fig. 7B). The next step will be a series of additional criteria. This row
         includes the cloud cover of the images, the orbital number, the title of the image, and other
         indicators (Fig. 7C). The result was then searched and images of the area were displayed
         (Fig. 7C). Additional information about the spatial image can be obtained through metadata
         (Fig. 7D). If the image is satisfactory, then a download command is issued. The images
         were exported to ArcGIS software and analysis work was performed.

                                                           7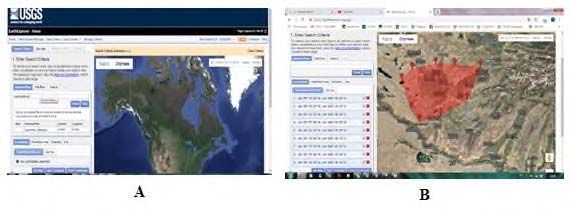
E3S Web of Conferences 258, 03021 (2021)                                   https://doi.org/10.1051/e3sconf/202125803021
UESF-2021

         Fig. 7. A. Selection of a time image of the selected area; B. A satellite image taken on the Sentinel-2
         satellite; C. Entering the indicators of the satellite image; and, D. Areas in the spatial image.
            Different aspects of dependence on demographic processes in the NDVI analysis were
         considered. Clearly, the red and infrared spectra of images were used to perform NDVI
         analysis. Next, the Map Algebra panel was entered into the Spatial Analyst tool through the
         toolbox and then into the Raster Calculator (Fig. 8).

         Fig. 8. A. Adding additional data to the metadata and B. Raster Calculator window.
             Typically, the value of the results obtained by analysis varies from 1.0 to -1.0. The
         values corresponding to the population points were observed to be in the range of
         approximately 0.6 to 0.22. Hence, it has been proved that the observation of changes in
         periodic time intervals can carry out NDVI analysis in population-related cases and obtain
         the necessary results on population change (Figures 9 and 10). In the processing of remote
         sensing materials, the obtained images were initially transformed into a trapezoidal form in
         the form of a photo scheme, and separate vector layers of common geographical elements

                                                            8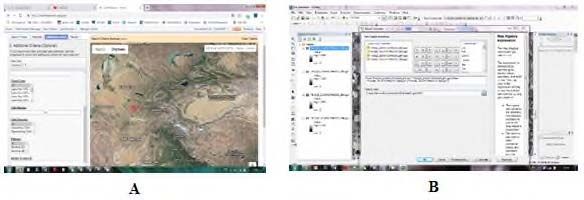
E3S Web of Conferences 258, 03021 (2021)                           https://doi.org/10.1051/e3sconf/202125803021
UESF-2021

         were formed. Also, topographic maps were prepared as a basis for compiling the first
         demographic maps of the southern region [6]. Then the quality and topology of the
         electronic database of the card were controlled. In the next step, the vector layers * sxf.
         files extension has been converted to ArcGIS *.shp format. In ArcGIS, general geography,
         hydrography, settlements, roads, borders, relief, industrial and social objects are formed in
         separate layers and files. The description of the converted files, the symbols in the ArcGIS
         environment, and the systems of the described objects have changed somewhat.

         Fig. 9. The process of NDVI analysis.
             The development of the thematic content of the map included the process of forming a
         general geographical content based on natural objects and complexes, as well as a set of
         conditional symbols and a legend of the map elements. In the production of thematic
         symbols, the characteristics of objects and complexes on the subject were taken into
         account. Many objects cannot be displayed due to the scale of the map. Therefore, non-
         scale symbols were widely used to describe these objects. Cartographic representation
         methods, dashed symbols were used to represent some elements of natural content. The
         advantage of the newly created electronic and digital demographic maps was that it was
         possible to solve the problem of correcting some errors and omissions in the mapping of
         the obtained research results, and it did not take much time.
             Today, the collection of demographic data, the formation of a database is carried out on
         the basis of ArcGIS, MapInfo, Panorama, GeoDraw, GeoGraph, Atlas GIS, Win GIS,
         ArcInfo and other programs [8]. In this research used ArcGIS software from the GIS
         family, which was met the requirements for solving the problems occurred. Above, the
         mapping work was carried out based on Demo GIS digital demographic mapping
         technology developed in the second part of the first chapter of the research work. The new
         cartographic basis created in the program was interconnected to the results through placing
         the collected statistical data in a central database using the geolocation method. A
         population map of the southern region was then constructed using cartographic mapping
         methods (Fig. 10) [10].

                                                      9
E3S Web of Conferences 258, 03021 (2021)                           https://doi.org/10.1051/e3sconf/202125803021
UESF-2021

         Fig. 10. The result of NDVI analysis.

         4 Conclusions
         The creation of maps, plans, and their processing and data integration through the constant
         replenishment of databases based on GIS technologies was studied. According to the result
         of the research, the methodology and technology of creating electronic digital demographic
         maps were developed. Furthermore, it was found that software belonging to the GIS family
         as well as selected software tools were compatible in exchanging information with other
         similar programs.
             At the local level, monitoring of changes in settlements over the years was also carried
         out. Remote sensing materials made it possible to analyze changes in local settlements and
         changes in population and changes in the impact of migration, and it was observed that the
         location of the population relative to the local relief structure.

         References

         1.   S. Abdurakhmanov, M. Atakov, A. Abdullaev, Bulletin of the state agency of the
              Republic of Uzbekistan “Ergeodeskadastr", 2, 12-13 (2014)
         2.   Y. Peng, F. Li, N. Xu, R. Kulmatov, K. Gao, G. Wang, Y. Zhang, Y. Qiao, Y. Li, H.
              Yang, S. Hao, Q. Li, S. Khasanov, Chinese Journal of Eco-Agriculture, 29(2), 312-
              324 (2021)
         3.   R. Kulmatov, A. Taylakov, S. Khasanov, Environ. Sci. Pollut. Res., 28(10), 12245-
              12255 (2021)
         4.   R. A. Kulmatov, S. A. Adilov, S. Khasanov, IOP Conf. Ser.: Earth Environ. Sci.,
              614(1), 012149 (2020)
         5.   N. Teshaev, B. Mamadaliyev, A. Ibragimov, S. Khasanov, InterCarto. InterGIS, 26(3),
              324-333 (2020)
         6.   K. Khakimova, I. Musaev, A. Khamraliev, E3S Web Conf., 227, 02003 (2021)

                                                     10
E3S Web of Conferences 258, 03021 (2021) https://doi.org/10.1051/e3sconf/202125803021
UESF-2021
7. B. Alikhanov, S. Alikhanova, R. Oymatov, Z. Fayzullaev, A. Pulatov, IOP Conf. Ser.:
Mater. Sci. Eng., 883(1), 012088 (2020)
8. I. Musaev, A. Bokiev, M. Botirova, E3S Web Conf., 227, 05004 (2021)
9. N. Sabitova, O. Ruzikulova, I. Aslanov, E3S Web Conf., 227, 03003 (2021)
10. S. Abdurakhmonov, I. Abdurahmanov, D. Murodova, A. Pardaboyev, N. Mirjalolov,
A. Djurayev, InterCarto. InterGIS, 26, 319-328 (2020)
11. Z. Mamatkulov, J. Rashidov, G. Eshchanova, M. Berdiev, Z. Abdurakhmonov, IOP
Conf. Ser.: Earth Environ. Sci., 614(1), 012086 (2020)
12. I. Aslanov, S. Khasanov, Y. Khudaybergenov, M. Groll, Ch. Opp, F. Li, E. Ramirez
Del-Valle, E3S Web Conf., 227, 02005 (2021)
13. M. Lehoczky, Z. Abdurakhmonov, E3S Web Conf., 227, 04001 (2021
14. S. N. Abdurakhmonov, Research of regional demographic processes on the basis of
Geoinformation technologies and cartographic techniques (in the example of the
southern region of the Republic of Uzbekistan), PhD Dissertation (TIIAME), 185
(2020)
15. S. N. Abdurakhmonov, O. Allanazarov, U. Mukhtorov, N. Mirjalalov, Z.
Abdurakhmonov, International Journal of Innovative Technology and Exploring
Engineering (IJITEE), 9, 430-435 (2020)
16. A. Jumanov, S. Khasanov, A. Tabayev, G. Goziev, U. Uzbekov, E. Malikov, IOP
Conf. Ser.: Earth Environ. Sci., 614(1), 012150 (2020)
11You can also read