Update on COVID-19 in Canada: Epidemiology and Modelling - Canada.ca/coronavirus June 25th, 2021
←
→
Page content transcription
If your browser does not render page correctly, please read the page content below

Update on COVID-19 in
Canada: Epidemiology
and Modelling
June 25th, 2021

Canada.ca/coronavirus
Sustained national decline across COVID-19 disease activity and severity
  indicators
   Number of cases, total                                                On average over the past 7 days:                    Number of deaths
    in hospital and ICU                                                    758 cases
    10,000                                                               1,114 hospitalizations                                                900
                                                                           533 ICU admissions
     9,000                                                                                                                                     800
                                                                            18 deaths
     8,000                                                                                                                                     700
     7,000
                                                                                                                                               600
     6,000
                                                                                                                                               500
     5,000
                                                                                                                                               400
     4,000
                                                                                                                                               300
     3,000
     2,000                                                                                                                                     200

     1,000                                                                                                                                     100
          0                                                                                                                                    0
          Mar 20          May 20           Jul 20         Sep 20          Nov 20           Jan 21         Mar 21          May 21
                                          Cases             Hospitalizations              ICU            Deaths

Data in figure as of June 22, 2021
Note: Trend lines reflect 7-day moving averages. Total hospitalizations and ICU admissions include all people in hospital and in ICU on that         1
day.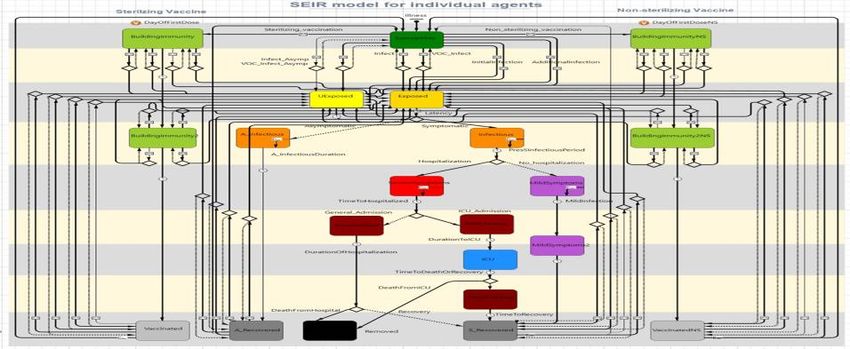
Regional COVID-19 trends show decreasing hospital occupancy
   following sustained decline in disease incidence
Number of cases and total in
hospital per 100,000 population
50                     BC                           50                     AB                          50                    SK

25                                                  25                                                 25

 0                                                   0                                                  0
 Apr 20     Aug 20 Dec 20         Apr 21             Apr 20     Aug 20 Dec 20         Apr 21            Apr 20        Aug 20 Dec 20   Apr 21

50                     MB                                                  ON                          50
                                                                                                                             QC
                                                    50

25                                                  25                                                 25

 0                                                    0                                                 0
 Apr 20     Aug 20 Dec 20         Apr 21              Apr 20    Aug 20 Dec 20         Apr 21            Apr 20        Aug 20 Dec 20   Apr 21

Data as of June 22, 2021
Note: Trend lines reflect 7-day moving averages. Total hospitalizations include all people in hospital on that day.                            2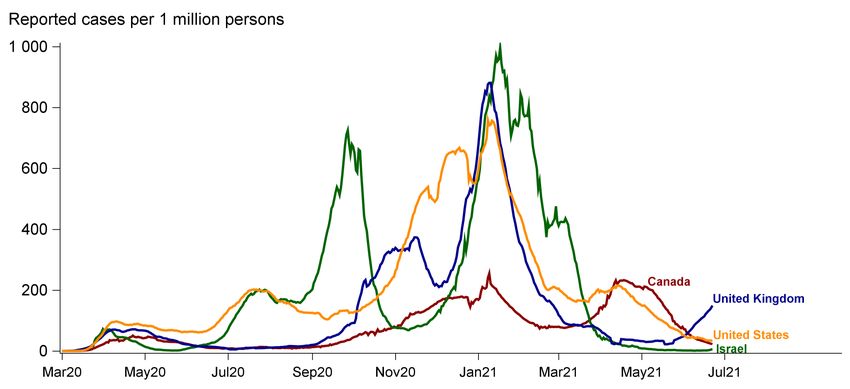
Hospitalizations continue to decline across all age groups
                                                                                                                        Incomplete data, due
     Number of reported hospitalizations
                                                                                                                           to reporting lag
                                                                                                          60 to 79
        160

        140                                                                                           40 to 59

        120

        100

         80                                                                                            80+

         60

         40

         20

          0
          Aug 20       Sep 20      Oct 20       Nov 20      Dec 20       Jan 21      Feb 21      Mar 21      Apr 21        May 21     Jun 21
                                                                  Date of illness onset*
                                            0 to 19         20 to 39         40 to 59             60 to 79           80+

Data as of June 22, 2021
Note: Trend lines reflect 7-day moving averages. *The earliest of the following dates: Onset date, specimen collection date, laboratory testing   3
date, date reported to province or territory, or date reported to PHAC.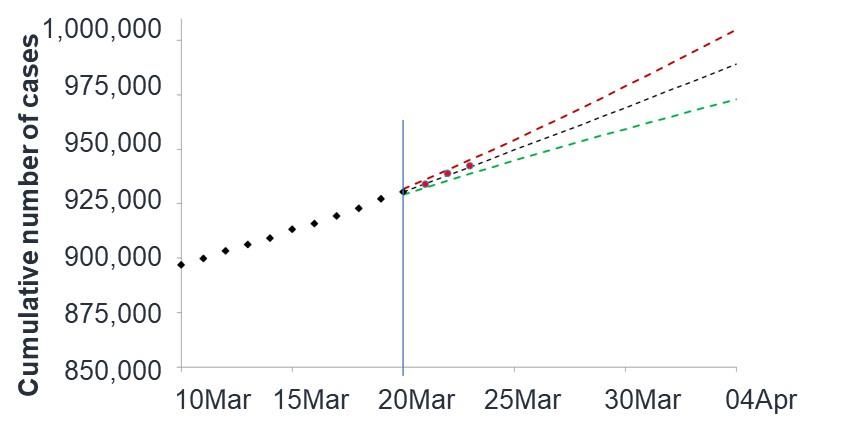
National Rt has remained out of an epidemic growth pattern (Rt1,
                  the epidemic is growing
  1.5

    1

  0.5
                                   When Rt is consistently
Characteristics of the Delta variant require sustained control efforts

    ↑ transmissibility                                 ↑ severity                         ↓ vaccine effectiveness

  • ~50% more transmissible                   • UK: Increased hospitalization             • UK: Reduced effectiveness against
    than Alpha                                  risk for Delta vs. Alpha                    symptomatic infection after 1 dose vs.
                                                                                            Alpha
  • 4-fold increase in proportion             •   Canada: Delta cases are
    of Delta cases in Canada                      54% more likely to be                   • Vaccines still effective at preventing
    (between April 25 and May                     hospitalized compared to                  hospitalization
    23)                                           Alpha cases
                                                                                          • Majority of Delta cases in Canada
  • Greater transmissibility could            • Could impact healthcare                     unvaccinated or partially vaccinated
    drive resurgence                            utilization

                               2 doses provide better protection against variants of concern!

Note: Public Health England. SARS-CoV-2 variants of concern and variants under investigation in England. 11 June 2021.
https://assets.publishing.service.gov.uk/government/uploads/system/uploads/attachment_data/file/993879/Variants_of_Concern_VOC_Tech   5
nical_Briefing_15.pdf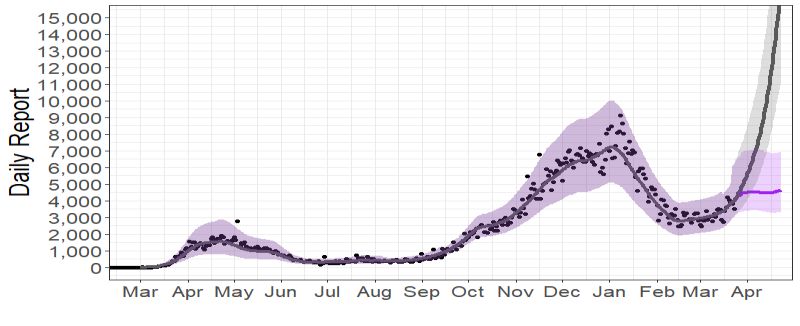
Percentage of eligible people (≥ 12 years) with at least one dose and
    fully vaccinated by jurisdiction, as of June 24th
                                 20%                                                                    75%                        100%
   NU                                                                      55%                  71%
   NT                                                                                            72%          83%
   YK                                                                                              74%          85%
   NL               13%                                                                                    80%
   PE                    17%                                                                               80%
   NS                  15%                                                                                 80%
   NB                       23%                                                                      77%
   QC                      23%                                                                             80%
   ON                                  27%                                                           76%
   MB                                        31%                                                    74%
   SK                                         32%                                            69%
   AB                                          33%                                             71%
   BC                               25%                                                              77%
   CA                                26%                                                             76%
        0%          10%          20%          30%          40%          50%          60%          70%          80%           90%   100%
                                                     Fully vaccinated        At least one dose
Data as of June 24, 2021
Note: Data obtained from the COVID19 Tracker. Accessed on 24 June, 2021. https://covid19tracker.ca/vaccinationtracker.html                6
At least one dose and fully vaccinated coverage increasing stepwise as
vaccination programs expand to younger age groups, as of June 19th
20% 75% 100%
80+ 64% 94%
70-79 50% 93%
60-69 33% 88%
50-59 21% 79%
40-49 16% 75%
30-39 13% 67%
18-29 9% 62%
12-17 2% 61%
0% 10% 20% 30% 40% 50% 60% 70% 80% 90% 100%
Fully vaccinated At least one dose
Data as of June 19, 2021
Note: Data obtained from the Canadian COVID-19 Vaccination Coverage Surveillance System. 7Evidence shows COVID-19 vaccines highly protective, with a low
percentage of cases reported following vaccination
Number of cases
following vaccination
3,500
3,000
•0.14% of partially vaccinated people were infected ≥ 14 days following the first dose
2,500
•0.08% of fully vaccinated people were infected ≥ 7 days following the second dose
2,000
1,500
1,000
500
0 7 14 21 28 35 42 49 56 63 70 77 84 91 98 105 112 119
Days from most recent vaccination to date of illness onset*
OnsetShort-term forecast predicts slowing rate of growth for cumulative
cases as well as cumulative deaths
Cumulative cases predicted to July 4, 2021: Cumulative deaths predicted to July 4, 2021:
1,413,010 to 1,420,740 26,175 to 26,475
1,430,000 26,750 Adjusted for data
correction at the
provincial level (+54)
1,420,000 26,500
1,410,000 26,250
1,400,000 26,000
1,390,000 25,750
1,380,000 25,500
09 Jun 14 Jun 19 Jun 24 Jun 29 Jun 04 Jul 09 Jun 14 Jun 19 Jun 24 Jun 29 Jun 04 Jul
Cumulatively reported cases in Canada by June 19 Cases added since June 19 when the prediction was made
Prediction to July 4 Lower 95% prediction limit Upper 95% prediction limit
Data as of June 19, 2021
Note: Extrapolation based on recent trends using a forecasting model (with ranges of uncertainty). 9Two-month forecast shows the epidemic is projected to decline nationally,
but could resurge if re-opening increases contact rates by 50% or more
If we increase the
number of people we
contact each day by
50%
Reported
If we increase the
cases
number of people
we contact each
day by 25%
If we maintain the
current number of
people we contact
each day
2020-2021
Data as June 21, 2021
Note: Output from PHAC-McMaster model. Model considers impact of vaccination and increased transmissibility of VOCs (including Delta), 10
refer to annex for detailed assumptions on modelling.International experience with emergence of the Delta variant highlights the
need for caution until vaccination coverage is high across the population
Rate per 1,000,000 population
Impact of Delta
variant and easing
of public health
measures clearly
visible in the UK
Data as of June 22, 2021
Note: 7-day moving average. Data for figure obtained from Our World in Data. 11The more contagious and severe Delta variant may result in greater than
previously expected resurgence this fall/winter
WITHOUT Delta WITH Delta predominating
OUTCOME: OUTCOME:
hospital capacity
not exceeded
! hospital capacity
may be exceeded
Hospital capacity Measures lifted Median hospitalized cases Vaccination period
The Delta variant is assumed to be 1.5x more transmissible and 2x more virulent than Alpha
Note: For all scenarios, a two-step approach to lifting public health measures is modelled. For scenarios on this slide, restrictive measures are lifted in summer
when at least 75% of those 12 and over have received their first dose and at least 20% have received their second dose. The easing of personal protective
measures occurs when at least 75% of those 12 and over have received their second dose. Refer to annex for detailed assumptions on modelling.
12Increasing vaccine uptake, especially in younger populations, could
reduce the potential resurgence of the Delta variant this fall
With Delta predominating AND ≥80% 2 dose vaccine uptake
• It is more important than ever for as
OUTCOME: many people as possible to get fully
hospital capacity
not exceeded vaccinated
• While some resurgence may still
occur this fall/winter, increasing
vaccine uptake in younger
populations can reduce the risk of
overwhelming hospitals
Hospital capacity Measures lifted Median hospitalized cases Vaccination period
The Delta variant is assumed to be 1.5x more transmissible and 2x more virulent than Alpha.
Vaccine uptake for first and second dose is increased for all age groups, and at least 80% among those aged 12-54
Note: For all scenarios, a two-step approach to lifting public health measures is modelled. For scenarios on this slide, restrictive measures are lifted in summer
when at least 75% of those 12 and over have received their first dose and at least 40% have received their second dose. The easing of personal protective
measures occurs when 83% of those 12 and over have received their second dose. Refer to annex for detailed assumptions on modelling. 13As vaccine coverage gets higher, opening up, going out and heading into
the fall and winter becomes safer New!
Risk assessment tools to assist Canadians
with decision making for going out safer
• We’ve done the work for a better summer and by staying vigilant
to keep cases low we can stay on track for a safer fall & winter...
• Increasing first and second doses will build a stronger wall of
vaccination protection against COVID-19, including the Delta variant! My COVID-19 Visit Risk Calculator
Quick Assessment (3 minutes)
• Half way is not okay, two doses of COVID-19 vaccine are needed
to: My COVID-19 Visit Risk Decision Aid
Comprehensive Assessment (10 minutes)
• protect ourselves from severe illness due to COVID-19
• give better protection against more contagious & severe variants of
Updated awareness resources on Canada.ca
concern
• build strong immunity across the population to keep COVID-19 under
control without restrictions
Your Health & Ventilation & COVID-Wise
Vaccination Status Setting Safety Precautions
MyCOVID-19 Visit Risk Calculator helps people assess the risks before visiting, gathering or meetings
with others based on personal and other risk factors https://covidvisitrisk.com/riskscore-english.html
14ANNEX
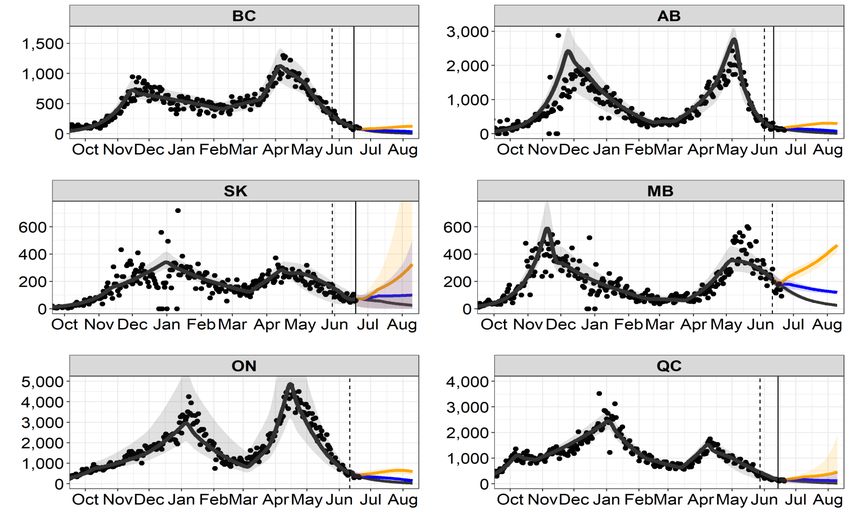
15Longer-range forecasts predict overall downward trends in most
jurisdictions across the country, but resurgence could occur in some
areas with reopening
If we increase the
number of people we
contact each day by
50%
Reported If we increase the
cases number of people
we contact each
day by 25%
If we maintain the
current number of
people we contact
each day
Data as June 21, 2021
Note: Output from PHAC-McMaster model. Model considers impact of vaccination and increased transmissibility of VOCs (including Delta), 16
refer to annex for detailed assumptions on modelling.Previous longer-range modelling forecast from May 28 shows that
sustained control measures supported the rapid decline of the epidemic
as vaccines rolled out
If we increase the
number of people we
contact each day
If we maintain the
current number of
Reported people we contact
cases each day
If we reduce the
number of people we
contact each day
Red points – Surveillance
data after the forecast from
2020 2021 May 25 to June 22
Model data as of May 25, 2021. Surveillance data as of June 22, 2021.
Note: Ensemble of output from PHAC-McMaster and Simon Fraser University models. Model considers impact of vaccination and 17
increased transmissibility of VOCs, refer to annex for detailed assumptions on modelling.Types of models used to inform decision making
Statistical forecast models:
• Short-range forecast of expected cases given recent incidence
Long-range forecast models:
• Dynamic compartment model adapted to project near-future
given recent incidence and scenarios for control/release/variants
of concern
Models to explore scenarios of opening up:
• More complex models
• Deterministic, age structured compartment model
• Agent-based model
• Initially developed to model control measures needed
• Recently adapted to model effects of vaccination and
transmission of VOC
Details on modelling and assumptions: https://www.sciencedirect.com/science/article/pii/S1755436521000177;
https://www.canada.ca/en/public-health/services/reports-publications/canada-communicable-disease-report-ccdr/monthly-issue/2020-46/issue-6-june-4-2020/predictive-
modelling-covid-19-canada.html; https://nccid.ca/news/phac-modelling/; https://www.canada.ca/content/dam/phac-aspc/documents/services/reports-publications/canada- 18
communicable-disease-report-ccdr/monthly-issue/2020-46/issue-11-12-nov-5-2020/ccdrv46i1112a08-eng.pdf; https://www.cmaj.ca/content/192/37/E1053.longLonger-range forecasting model assumptions
• The forecast uses compartmental models reflecting the biology of COVID-19 and public health response developed by
PHAC in collaboration with McMaster University. It projects the near future given recent incidence of COVID-19 and
scenarios for public health measures, variants of concern (VOCs) and vaccination.
• The model assumes that the B.1.617.2 (Delta) VOC is 50% more transmissible compared to the dominant B.1.1.7 (Alpha)
VOC. This value is used to estimate the rate at which VOCs replace existing strains.
• The B.1.617.2 (Delta) VOC is considered to have been introduced in mid-March at very low prevalence. Proportions vary
across provinces (ON, AB ~ 30%, BC ~ 25%, MB, SK, QC ~ 5% as of mid-June). The proportion of cases due to VOCs are
indirectly fitted when calibrating to data.
• Changes to public health measures, including multi-stage reopening, is accounted for in the forecast. In the provincial
forecasts (slide 16), Stage 1 reopening is represented by a dashed vertical line and stage 2 reopening is represented by a
solid vertical line
• The forecast includes a line showing the expected decrease in cases if public health measures remains constant (grey line),
a line that assumes recent changes to public health measures will increase effective transmission further by 25% (blue line)
and a line that assumes recent changes to public health measures will increase effective transmission by a further 50%
(orange line).
• The PHAC-McMaster model forecast includes current vaccine roll-out, including an assumption that vaccinations are 60%
effective against infection for non-Delta variants (30% for Delta variants) after one dose and 90% (80% for Delta variants)
effective against infection after second dose. This model uses the current daily administered vaccination numbers and a
statistical model to fit and project the rapid switch to a second dose, however it does not prioritise by age, and uses a static
vaccination rate.
19Assumptions for the modelling of restrictive public health measures
• An age-stratified agent-based model was used for exploring the impact of vaccination rates on lifting of public health measures (slides 12 and 13).
• Key model assumptions include:
• The vaccine is 60% effective at preventing infection and 80% effective at preventing hospitalization after one dose, and 92% effective at
preventing infection and 96% effective at preventing hospitalization after two doses;
• A VOC modelled on B.1.1.7 (Alpha) was introduced in December 2020 and is 50% more transmissible and 40% more virulent than the wild-type
strain, but does not have immune breakthrough from vaccines;
• A second VOC modelled on B.1.617.2 (Delta) was introduced in March 2021 and is 50% more transmissible and 100% more virulent than the
Alpha with immune escape from vaccines causing a 33% reduction in protection against infection after the first dose and a 6% reduction in
protection against infection after the second dose
• Hospital bed capacity in Canada is estimated at 31 per 100,000;
• The vaccination period is Dec 14, 2020 to either mid-August, 2021 (with 75% vaccine acceptance by the eligible population) or late August, 2021
(at least 80% vaccine acceptance by the eligible population). Vaccination roll-out proceeds in order of priority groups as recommended by NACI
with a 4-month interval between doses starting from March 4, 2021. The 4-month delay progressively decreases to a 28-day interval by June.
• Vaccine acceptance by age group is estimated from two Canadian surveys (2020 Canadian Community Health Survey – September 2020) and
EKOS probability based research panel (January 6-11, 2021). Acceptance in parents of adolescents is from an internal national survey.
Increased acceptance rates in older age groups (≥ 55 years) is based on Quebec’s current vaccination rate which has surpassed Canadian
survey rates, while 80% acceptance in the younger age groups (12 to 54 years) is a model scenario.
• For all scenarios, a two-step approach to lifting public health measures is modelled. Restrictive measures are lifted in summer when at least
75% of those 12 and over have received their first dose and at least 20% have received their second dose (or 40% in simulations with increased
uptake). The easing of personal protective measures occurs when at least 75% of those 12 and over have received their second dose (or 83%
in simulations with increased uptake). Until these time points, the epidemic is controlled by a combination of restrictive closures, case detection
and isolation, contact tracing and quarantine, and physical distancing.
• The model assumes on the day restrictive measures are lifted, the border reopens and the number of imported cases increases from 2 per
100,000 per week to 12 per 100,000 based on current reduction in travel volume due to border restrictions, imported cases are estimated from
the PHAC importation model
20You can also read