Talk contents Part A: Introduction and methods - Caltech

Page created by Javier Henderson
 
CONTINUE READING
Talk contents Part A: Introduction and methods - Caltech
Talk contents
Part A: Introduction and methods
1.   Observational motivation
2.   Population synthesis principle
3.   Input physics: global models
4.   Initial conditions
5.   Observational biases

Part B: Results and perspectives
1.   Compute the population: individual systems
2.   Overview of statistical results
3.   Comparisons with observations
4.   Perspectives and conclusions
Talk contents Part A: Introduction and methods - Caltech
Compute the synthetic population

                                                                              Andrews+2018
                                                                                             Initial Conditions: Probability
Models of individual        Global end-to-end form-
                                                                                             distributions of disk properties
processes                   ation & evolution model                                             Disk gas mass
                                                                                                                 From
                                                                                                Disk dust mass
Accretion, migration, …     Disk properties   planet properties                                                  observations
                                                                                                Disk lifetime

                                                            Draw and compute
                                                            synthetic population
                                                                                                            New instrumentation
                                                                                                            better observational constraints
                                                           Apply observational
                                                           detection bias
                                                                                                              Predictions
                                                                                                              (going back to the full
                                                                                                              synthetic population)
                    Observed population                              Stat.
                                                                  Comparison:
                                                             Observable sub-population                                   Model
                                                             - Frequencies                                               solution
              No match: change                               - Orbits, masses, radii, luminosities
                                                             - Architecture, multiplicity                   Match        found
              parameters, improve                            - Correlations
              model, reject model                                      …..

        One learns a lot even if a synthetic population does not match the observed one!
Talk contents Part A: Introduction and methods - Caltech
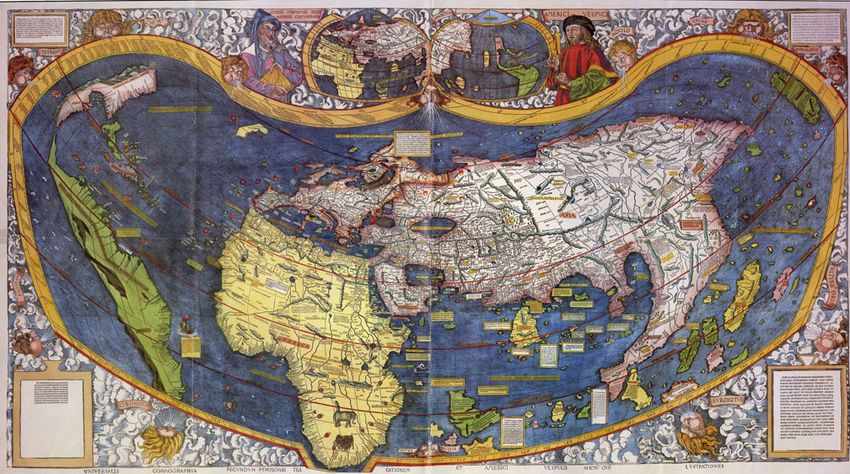
Emsenhuber et al. 2021

1. Compute the population:
individual systems
Talk contents Part A: Introduction and methods - Caltech
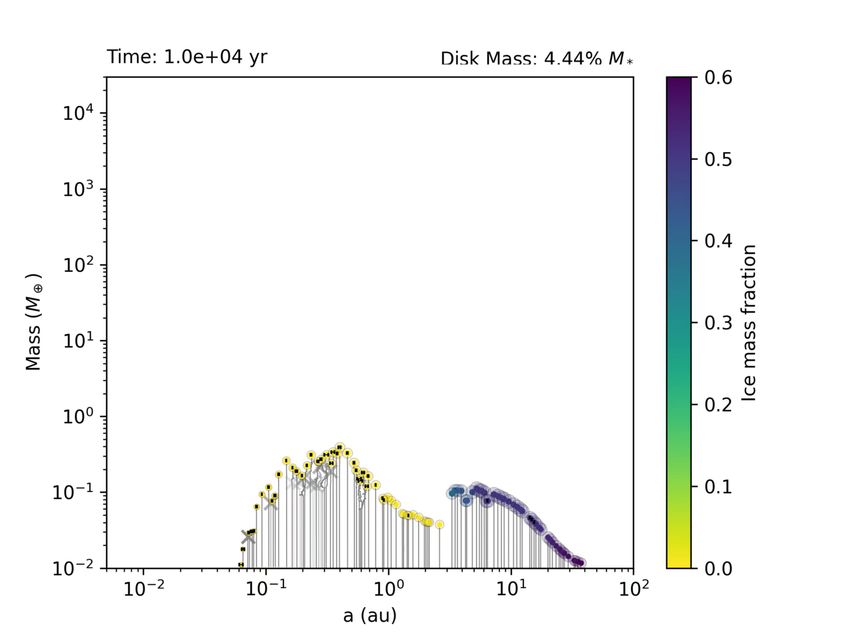
Global model: Example outcome
                                                                          Numbers are
Bern Generation III model                                                 -[Fe/H]
                                                                          -Mgaz,0 [MSun]
                                                                          -Msolids,0 [MEarth]

Setup/parameters
-solar-mass stars
-1000 systems (stars)
-100 ini6al embryos per
 system
-embryo mass 1 Mluna
-uniform in log out to 40
 AU at t=0.
-viscosity α=0.002
-opacity red. factor 0.003

    Gas-dominated giant (Menve/Mcore >=1) (“Jovian”)      Protoplanet lost during formation
                                                          and evolution process (accreted by
    Volatile rich planet, with H/He (“Neptunian”)
                                                          another more massive protoplanet,
    Volatile rich planet, without H/He (“water world”)    ejected, collided with the star).
    Iron/silicate planet with H/He (“H/He terrestrial”)      Black bar: peri- to apoastron
    Iron/silicate planet without H/He (“Earth-like”)         distance (showing eccentricity)
Talk contents Part A: Introduction and methods - Caltech
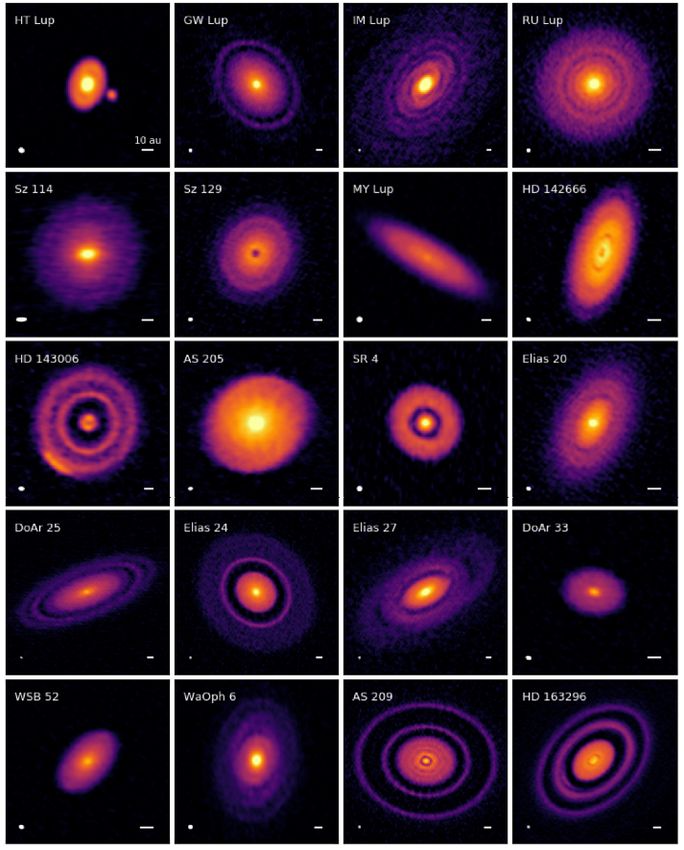
A global model in action: low solid mass
Initial conditions
-initial disk gas mass:
 0.017 Msun
-initial solid mass:
 57 MEarth

 Class 1
 architecture
Talk contents Part A: Introduction and methods - Caltech
Class 1. The in situ Earths and ice worlds systems
                                                     t=5 Gyr
Talk contents Part A: Introduction and methods - Caltech
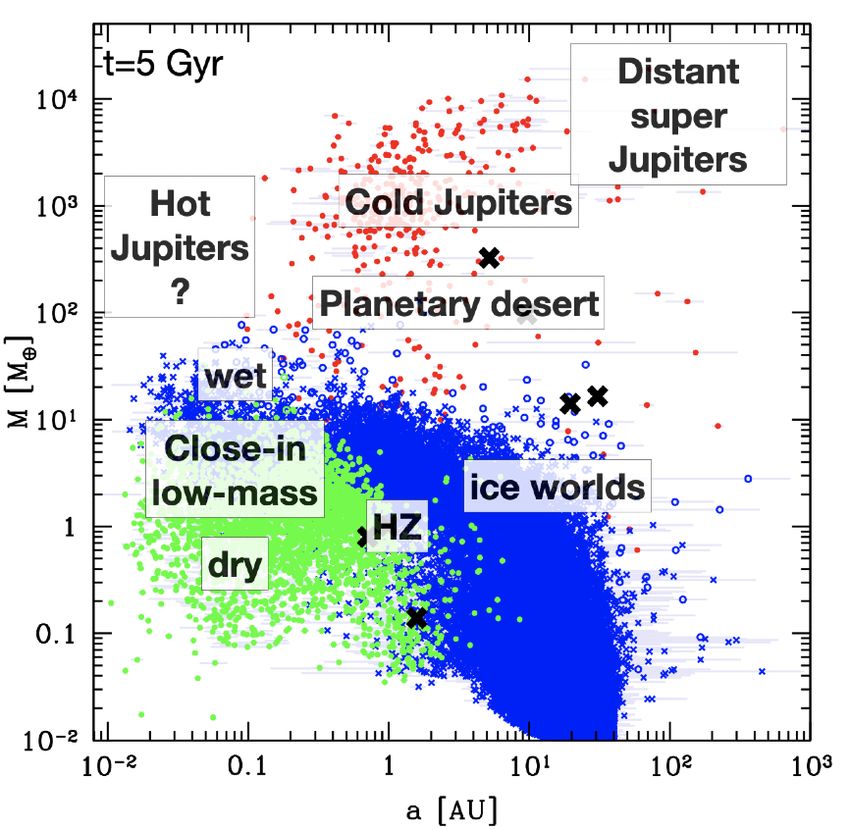
A global model in action: mid solid mass
Initial conditions
-initial disk gas mass:
 0.042 Msun
-initial solid mass:
 100.1 MEarth

 Class 2
 architecture
Talk contents Part A: Introduction and methods - Caltech
Class 2. The migrated sub-Neptune systems
                                                                      t=5 Gyr

                        Peas-in-a-pod (Weiss+2018, Millholland+2017): Misra+2021
Talk contents Part A: Introduction and methods - Caltech
A global model in action: high solid mass
Initial conditions
-initial disk gas mass:
 0.042 Msun
-initial solid mass:
 245 MEarth

 Class 3
 architecture
Talk contents Part A: Introduction and methods - Caltech
Class 3. The mixed systems
A global model in action: very high solid mass
Initial conditions
-initial disk gas mass:
 0.044 Msun
-initial solid mass:
 327 MEarth

Class 4
architecture
Class 4. The dynamically active giants
Manara et al. 2016

2.
Overview of statistical
results
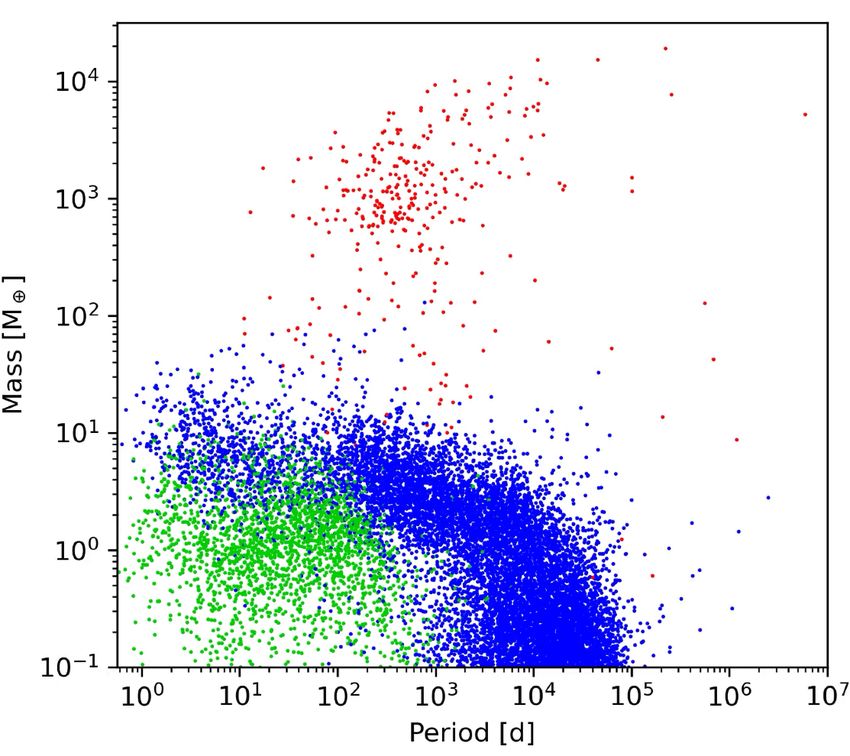
Formation of the a-M diagram
                            Ini6al condi6ons
                            -solar-mass stars
                            -1000 systems (stars)
                            -100 ini6al embryos per
                              system
                            -ini6al mass 1 Mluna

                       Emsenhuber et al. 2021b (NGPPS II,
                       arXiv: 2007.05562)
Nominal population 1 M☉
                                  Distant
                                   super     t=5 Gyr                          Distant
                                  Jupiters
         Hot
                  Cold Jupiters                                                super
       Jupiters
                                                                              Jupiters
          Planetary desert                     Hot          Cold Jupiters
         Close-in                            Jupiters
        low-mass
                                                ?          Planetary desert

                                                  wet

                                                Close-in
                                               low-mass            ice worlds
                                                              HZ
                                                   dry

     Several fundamental features of
     the observed popula6on can be
     recovered.

The varia6ons of the disk ini6al condi6ons over a range likely occurring in nature leads to
               a large diversity of planetary systems, similar as observed.
10

                              Number of system

                                                                                             Number of system
                         102
     Number of syst

                                                                          Number of syst
                                                  10  2
                                                       Statistical overview
                                                                         10 for 1 M☉       102
                                                                                                                  2

       1
 Fundamental             10                       demographical results                    101
                                                  10  1                                                         101
   • Synthetic planetary system contain on average 0
                                                       8 planets more massive than 1 M⊕
                                                10
     including all orbital distances (no obs. constraints yet).
                                                           0
                         5        10              0     10
                                                         0       2        4       6
  •
 10 Fraction of systems
                      0  with giants
                                5    planets:
                                          10  18 %  (all orbital distances),
                                                                 0        2    only
                                                                                  4  1.6 %6at >10 AU.
                 Number of planets                        Number of planets
anets
  • Systems with giantsNumber      of average
                          contain on  planets 1.6 giant planets.Number of planets
           3             Giant
t      10                       Giant
     Number of systems

                  3
               10                                              10 embryos
                              Number of systems

                                                               20       10 embryos
                                                                     embryos
           2                                                                        Initial number of
       10                                                      50       20
                                                                     embryosembryos embryos per disk
                  2
               10                                                       50 embryos
                                                               100 embryos
           1                                                            100 embryos
       10
               101                                   The result is independent of the initial nb of embryos
                                                     per disk.
                 0      1     2      3
    3                    0     1
                 Number of planets    2     3        Only 5 stars out of 1000 have 3 giant planets.
anets                   Number of planets
  rent types of planets, for the four multi-embryo populations presented in this study. In each panel,
ymofanother  to make
     •di↵erent
        Low-mass      them
                typesplanets more
                       of planets, visible. We
                                   for theMfour
                                 (0.3-3         seehabitable
                                                    for example
                                            ⊕) inmulti-embryo
                                                                  that for
                                                                        44the
                                                                 populations
                                                                zone:          giant
                                                                             %presentedplanets,
                                                                                 of stars.      outstudy.
                                                                                            inMean
                                                                                              this  ofmultiplicity
                                                                                                       theIn
                                                                                                           1000
                                                                                                             each panel,
                                                                                                                    1.3 (rather
planets.   About
  tally from      an equal
              another to makenumber
                                them (100
                                      moreeach)    have
                                            visible. Weone
                                                         see or
                                                             fortwo  giants.that
                                                                 example      Less
                                                                                 for than  ten out
                                                                                      the giant    of theout
                                                                                                planets,   1000
                                                                                                             of the 1000
 ynumber
        low).  Mean
           per system
    giant planets.
                       [Fe/H]
                   Aboutthatan  of stars
                             occurs.       with  habitable    planets    -0.11.    Different    from  Solar
                               equal number (100 each) have one or two giants. Less than ten out of the 1000
                                                                                                              System.
   highest number per system that occurs.
What sets the outcome?
                                                                                         25

                                                                                                                                         The most important ini6al

                                                                                             Number of planets in system with M ≥ 1 Me
                           4
                         10                                                                                                              condi6on is the mass of
                                                                                         20                                              solids ini6ally present in
                                                                                                                                         the disk.
Total system mass [Me]

                         103
                               Solar system                                              15                                              Grey lines: efficiency of
                                                                                                                                         planetary system
                                      10                                                                                                 forma6on(including H/He)
                         102                                                                                                             per system
                                                                                         10

                                                                                                                                         We need 2-3 MMSN to
                           1
                                      1                                                                                                  form the Solar System
                         10                                                              5                                               mass.

                                      0.1
                         100                                                             0
                                  1                       2                       3
                                10                      10                     10
                                            Initial mass in solids [Me]

                                                              Another important ini6al condi6on is external disk photoevapora6on,
                                                              seRng the disk life6me. It depends on stellar birth environment and
  Adapted from Mordasini+ in prep.                            affects the emerging system architecture (e.g., Winter et al. 2020).
Mayor et al. 2011

3.
Comparisons with observations

                                                                              Andrews+2018
                                                                                             Initial Conditions: Probability
Models of individual        Global end-to-end form-
                                                                                             distributions of disk properties
processes                   ation & evolution model                                             Disk gas mass
                                                                                                                 From
                                                                                                Disk dust mass
Accretion, migration, …     Disk properties   planet properties                                                  observations
                                                                                                Disk lifetime

                                                            Draw and compute
                                                            synthetic population
                                                                                                            New instrumentation
                                                                                                            better observational constraints
                                                           Apply observational
                                                           detection bias
                                                                                                              Predictions
                                                                                                              (going back to the full
                                                                                                              synthetic population)
                    Observed population                              Stat.
                                                                  Comparison:
                                                             Observable sub-population                                   Model
                                                             - Frequencies                                               solution
              No match: change                               - Orbits, masses, radii, luminosities
                                                             - Architecture, multiplicity                   Match        found
              parameters, improve                            - Correlations
              model, reject model                                      …..

        One learns a lot even if a synthetic population does not match the observed one!
Statistical comparison with HARPS survey
                                                                                                     Observed
                                                                                                     Nb of planets: 161
                                                Mayor et al. 2011                                    Nb of stars w planets: 102
                                                Lines: detec+on
                                                probabili+es                                 100%    Multiplicity: 1.6
                                                                                             95%
                                                                                                    Synthetic biased
                         [Earth Mass]

                                                                                             80%
                                        1000.
                                                                                             60%    Nb of planets: 317
 HARPS: high                                                                                 40%    Nb of stars w planets: 204
 accuracy radial                                                                             20%
                                                                                                    Multiplicity: 1.6
 velocity planet                                                                             10%

 searcher.                              100.0                                                5%
                                                                                             2%     • Agreement: similar global
                                                                                                      structure: relative distribution
                                                                                                      (concentrations, voids)
                         M2sini

                                         10.0                                                       • Agreement: Mean multiplicity
 GTO Survey: 822                                                                                         system architecture.
 solar-like stars.
                                                                                                    • Disagreement: Factor 2 in
 Known bias.
                                                                                                      absolute number. Poss.
                                          1.0                                                         explanations: Initial conditions?
 See also recent                            10+0          10+1      10+2       10+3   10+4            Cluster environment (cf. Winter
 results of California                                                                                et al. 2020)?
 Legacy Survey                                                Period       [days]                   • Disagreement: Hot Jupiters.
 (Rosenthal+2021,                                                                                     Poss. explanation: Kozai plus
 Fulton+2021)                                                                                         tidal circularisation channel
                                                                                                      missing in model.
Adapted from Emsenhuber, Mordasini, Udry, Mayor, Marmier + in prep. (NGPPS VII)
Quantitative comparison mass distribution
                  80     Mass distribution detected planets
                 0.8
                  80
                  70                                                • Agreement: Fundamental bimodal structure
                              Synthetic
                              Scaled synth(normalised)
                              Synthetic
                  70          HARPS
                              Scaled
                              HARPSsynth                            • Agreement: Change in regime at ~20 M⊕:
                  60
            frequency

                              HARPS                                   smoking gun of core accre6on: runaway gas
                  0.6
                  60
                  50
                                                                      accre6on Mcore~Menve~10 M⊕ (but see also
          number
           Number

                    50                                                Bennet et al. 2021).
                    40
       Number

                 0.4
                 40
 Normalised

                  30                                                • Disagreement: Giant planets factor 2-3 too massive
    Raw

                    30
                    20                                              • Disagreement: Too few intermediate mass planets by
                 0.2
                 20                                                   factor ~2-3 (planetary desert, Ida & Lin 2004).
                  10
                    100
                       100     101      102     103       104
                                                                         too fast gas accre6on (cf. Nayakshin et al. 2019)
                     00 0            Msini [M ]
                       10      101      102      103          104
                                     Msini [M ]

Similar for gas accre6on rate derived from several 3D hydrodynamic models (Machida et al. 2010, D'Angelo et
al. 2010, Bodenheimer et al. 2013)
Possible explana6ons: low viscosity disks (Ginzburg & Chiang 2019a), magne6c regula6on (Batygin 2018, Cridland
2018), angular momentum barrier (Takata & Stevenson 1996), 3D circula6on (Szulagyi et al. 2014), ….

          Popula6on synthesis makes it possible to quan%fy discrepancies between theory and observa6ons.
Statistical comparison with Kepler survey
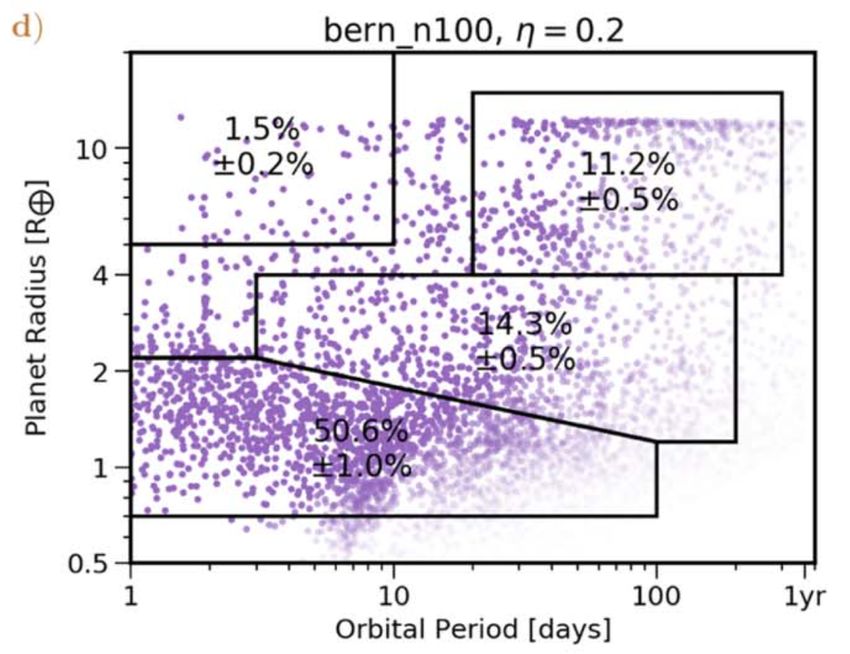
 c)                                                      d)

NASA Kepler space telescope (transits)                                                                                           Synthetic
                                                                                                                                 t=5 Gyr

e)
                                        Observed

                                   Mulders et al. (2019)
Figure 5. Planet occurrence rates of the planet population synthesis model (abcd) compared to those of Kepler (e). Bins span
equal areas in logaritmic area units (d log R d log P ) and roughly correspond to hot Jupiters, warm giants, super-earths, and
                                                                    • Agreement: rela6ve occurrence, except for (sub)-
mini-Neptunes. The models systematically underestimate the occurrence of mini-Neptunes compared to the observed rates.
Numbers: Bias corrected occurrence rates
(Nb of planets in area / Nb of stars x 100)                           Neptunes (2-4 R⊕)
                                                                    • Disagreement: absolute occurrence: too high again (x 5)
For a direct comparison, the end-to-end                             • Radius valley not clearly visible for high number of ini6al
model should include the long term evolution                          embryos: Impact stripping? Water-rich planets? Enriched
/ internal structure calculation including
atmospheric escape -> R and L/mag.
                                                                      envelopes?
Statistical comparison with direct imaging
SPHERE@VLT SHINE GTO                 Actual detections &                  Synthetic population &
survey (Vigan et al. 2020)            sensitivity maps                       sensitivity maps
150 stars                                                                          Plot by Clemence Fontanive

cf. Nielsen et al. 2019 GPI

           SPHERE

Very Large Telescope VLT
                                                                                 +4.7
                                                                    Observed: 5.8−2.8 %
                                  Frac6on of FGK stars w. planets
                                                                                      +0.5
                                  (M=1-75 MJ, a=5-300 AU)             Synthe6c: 3.4−0.5 %
                               • Agreements: overall frequency, mass-luminosity rela6on (β Pic b)
                               • Distant giants in synthesis: Single, massive, eccentric planets from
Probes very different kind of     scanering events (see Marleau+2019b), mean eccentricity: 0.39
planets and a different         • Disagreement: No HR 8799-like systems: 4 distant massive giants on
observable (luminosity).         rather circular orbits
                               • Structured disks? Forma6on by gravita6onal instability?
4.
Perspectives and conclusions
Comparisons with observations

                                                                              Andrews+2018
                                                                                             Initial Conditions: Probability
Models of individual        Global end-to-end form-
                                                                                             distributions of disk properties
processes                   ation & evolution model                                             Disk gas mass
                                                                                                                 From
                                                                                                Disk dust mass
Accretion, migration, …     Disk properties   planet properties                                                  observations
                                                                                                Disk lifetime

                                                            Draw and compute
                                                            synthetic population
                                                                                                            New instrumentation
                                                                                                            better observational constraints
                                                           Apply observational
                                                           detection bias
                                                                                                              Predictions
                                                                                                              (going back to the full
                                                                                                              synthetic population)
                    Observed population                              Stat.
                                                                  Comparison:
                                                             Observable sub-population                                   Model
                                                             - Frequencies                                               solution
              No match: change                               - Orbits, masses, radii, luminosities
                                                             - Architecture, multiplicity                   Match        found
              parameters, improve                            - Correlations
              model, reject model                                      …..

        One learns a lot even if a synthetic population does not match the observed one!
6

                                                                                                               ?
                           Perspectives and conclusions
                                                                                4
                                                                                                                                                           20

                                                                                2

                                                                                0                                                                           0
                                                                                    2     4   6   8   10           20            40   60   80 100               2   4   6   8   10           20
                                                                                                        Companion Mass [MJup ]                                                    Companion Mass

                 100 pc                                                                  GAIA satellite                                             Nancy Grace Roman satellite
                  50 pc            Detectable
                  25 pc              GAIA

                                     USE AM PLOT TO SHOW GAIA                           Data release ~2025                                          Data release ~2030
                                            AND ROMAN
                                                                                        Astrometric technique                                       Microlensing
                                        Explore uncharted territory
                                                                                        Expected yield: 20’000                                      technique
                                          say nb of giant planets!                      to 70’000 giant                                             Expected yield:
                                        Detectable
                                             goals                                      planets (!)                                                 2000-3000 cold low-
                                         Roman                                                                                                      mass planets
                                 Use: old map -> new map with america

                                                                                          PLATO: transits                                           ARIEL: atmospheric
                                                                                                                                                    spectroscopy

Observa6onally driven field: consider coming missions
The future is bright regarding new sta6s6cal
observa6onal constraints.
                                                                                         Data release ~2030                                          Launch ~2029
Exquisite knowledge of planet mass distribu6on and
demographics in giant and low-mass regime. Ideal to                                      Transit technique                                          Atmo. spectroscopy
inves6gate mechanisms of gas and solid accre6on.                                         Hab. zone planets                                          Sta6s6cs of atmo.
Blue lines: 5 σ detec+on limits for GAIA (Courtesy D. Segransan, Geneva Obs.)            Temporal evolu6on                                          composi6ons
Terra incognita as litmus test
                      2021                                                ~2030

Cross-checking the same theoretical model with population synthesis in many different and especially
unexplored parameter spaces:

Key to understand whether theory really captures the governing underlying physics and is not merely
a sophisticate fit tweaked to explain already known observations.

Much to do on the theoretical side: initial conditions & early phases, disk models (beyond α-models),
hybrid pebble-planetesimal models, link formation-atmospheric composition, gas accretion,…
   Observing planet formation as it happens as a new direct constraint on planet formation
Conclusions
•Population synthesis is a tool to compare theory and
 observation to improve understanding of planet formation
 • use full wealth of observational constraints
 • put detailed models to the test
 • see global statistical consequences: which processes are key?

•Observational constraints on many processes
 • solid and gas accretion rate
 • N-body dynamics
 • orbital migration rate

•See link between disk and planetary properties
•Predict yield of future instruments/space missions
•Continuously improving models
 • population syntheses depend on progress of formation theory as a whole
 • many new theoretical developments to test, many new obs. constraints to come
Resources
Population synthesis review papers
  -Benz et al., Protostars & Planets VI, 691, 2014
  -Mordasini et al., IJA, 201, 2015
  -Mordasini, Handbook of Exoplanets, 143, 2018

DACE data base: Bern population synthesis models
https://dace.unige.ch/evolution/index

                                     All NGPPS data publicly available
                                     via dedicated interac6ve online
                                     tool on DACE website

Freely available toy population synthesis model
http://nexsci.caltech.edu/workshop/2015/#handson
You can also read