AIR Earthquake Model for Australia - AIR Worldwide
←
→
Page content transcription
If your browser does not render page correctly, please read the page content below
AIR Earthquake        In 1989, an M5.6 earthquake

Model for Australia
                      struck Newcastle, New South
                      Wales, damaging 35,000 homes
                      and 3,000 businesses and causing
                      insured losses that rank it among
                      Australia’s costliest natural
                      disasters. AIR estimates that if this
                      earthquake were to recur today, it
                      could cost insurers more than AUD
                      7.3 billion. Companies operating in
                      this market need authoritative tools
                      to identify the risk management
                      strategies that will mitigate the
                      impact of the next catastrophe.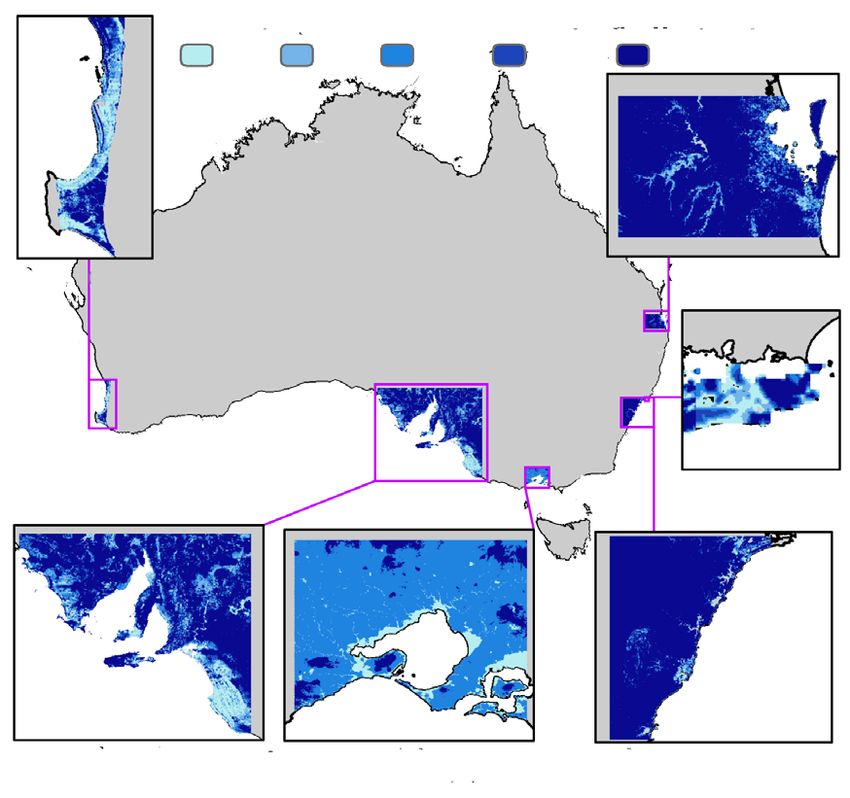
AIR EARTHQUAKE MODEL FOR AUSTRALIA
The AIR Earthquake Model for Australia Integrates All Viable Theories of Regional
Seismic Activity to Provide a Comprehensive
provides a significant level of detail Risk View
enabling superior risk differentiation Far from the boundaries of tectonic plates, Australia is
characterized as a stable continental region, which means data
based on factors including seismicity, on historical seismicity and active faults are scant. To augment
ground motion attenuation, site soil the sparse historical record and capture variation in earthquake
risk despite low seismicity, the AIR model makes use of
condition, local design requirements, information about neotectonic features (weak zones in the crust
construction class, occupancy type, or faults ruptured by prehistoric seismic events) that are likely
locations for future large earthquakes. Our historical catalog
building age, and height. is complete to the end of 2018 with magnitudes homogenized
to a common moment magnitude (Mw) scale using different
regression relationships that reflect different patterns in the data
!
observed for earthquakes that occurred either before or after
Darwin
1990.
To accommodate uncertainty surrounding the locations of
20°S
past earthquakes, the model features a background seismicity
component, which allows simulated earthquakes to occur
Brisbane
anywhere within a seismic source zone, including locations
where none have been previously known to have occurred.
!
30°S
Perth
Ground Motion Prediction Equations and High-
!
Sydney
Resolution Soil Data Capture Shaking Intensity
!
! Canberra
Adelaide !
!
at Each Site
Melbourne
40°S The geological environment of western Australia closely
Capital Cities
resembles that of the central and eastern North American
!
AIR's Fault Model Hobart
!
120°E 130°E 140°E 150°E craton (stable continental region). Eastern Australia experienced
some uplifting, folding, and volcanism as the continent drifted
The AIR model uses 391 neotectonic features to constrain the
location, upper-bound magnitude, and faulting style of large away from the Antarctic. Therefore, the rock underlying much
magnitude stochastic events.
of eastern Australia is not as old, hard, or cold as the craton in
western Australia.
To account for this variability in the geological environment, the
model employs two sets of ground motion prediction equations
(GMPEs) tailored for western and eastern Australia, respectively.
These two sets of GMPEs provide a comprehensive approach
to estimating ground motion throughout different areas within
Australia. Each set contains the latest GMPEs relevant for
eastern and western Australia to better capture the epistemic
uncertainty inherent in estimating ground motions in tectonically
stable regions.
2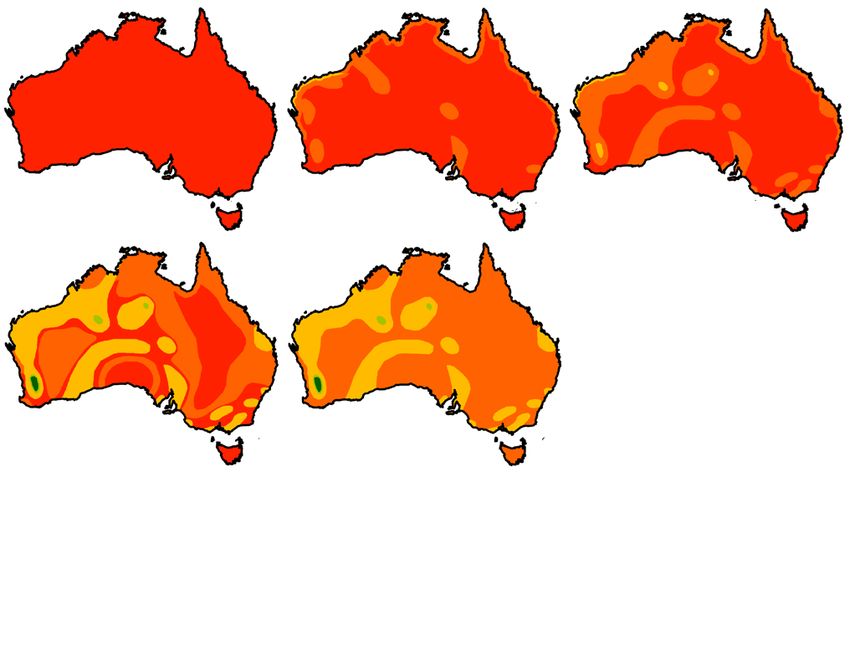
AIR EARTHQUAKE MODEL FOR AUSTRALIA

The modeled ground motion also accounts for local soil                                           Depth of Groundwater Table (m)
conditions, which can dramatically alter the intensity and                                         0-3        3-6    6-10      10-15    15<
frequency content of surface ground shaking at the location
of a risk. AIR has used geological maps and geotechnical
data to develop soil classification maps at various scales—
including resolutions as fine as 100 meters in the most                     Perth Area                                                 Brisbane Area
populated areas.

                                                                                                                                       Newcastle Area

                                                            Soil Types
                                                                 B
                                                                 BC
                                                                 C
                                                                 CD          Adelaide Area                    Melbourne Area           Sydney Area
                                                                 D           *Distance scales are different

                                                                 DE
                                                                 E       Groundwater depth data were developed from borehole logs
                                                                         and hydrological models for five liquefaction-modeled areas in
                                                                         Australia.

                                                                         Damage Functions that Capture Regional
                                                                         Differences in Vulnerability
Enhanced soil maps with resolutions as fine as 100 meters in             The vulnerability of Australia’s building stock can vary
metropolitan locations help to accurately capture the effect of site
amplification.                                                           regionally due to differences in building codes and
                                                                         preferred construction practices based on climate and
Advanced Liquefaction Modeling for Coastal                               historical earthquake and tropical cyclone experience.
Areas of High Exposure Concentration                                     The AIR model supports 127 distinct construction classes
Liquefaction occurs when soil saturated with water is shaken             and 114 unique occupancy classes. The vulnerability of
violently and temporarily loses its strength. It becomes                 buildings is further refined by height class (low-rise, mid-
unable to support the weight of buildings above it, causing              rise, high-rise, and tall) and by the year in which they were
them to tilt or even topple over. Differential settlement as             built.
liquefied soil shifts can break buried utility lines and float
pipelines and ducts to the surface.                                      Vulnerability has changed with the emergence and
                                                                         ongoing revision of building codes governing prescribed
The AIR model features a liquefaction module covering                    earthquake and wind loading. To account for this,
areas of high exposure concentration along the coasts.                   buildings are classified in the AIR model into five seismic
The potential for liquefaction depends on soil properties                design code levels from minimal earthquake resistance
near the surface and the amount of saturation due to                     to a more robust level of structural design. As a result,
groundwater depth. Input data for modeling liquefaction                  AIR damage functions for any given construction and
includes soil classification maps and maps of groundwater                occupancy class can vary based on these seismic design
depth developed by AIR using water well log data from local              code levels which are determined by a building’s location
agencies and high-resolution topographic data.                           and the year in which it was built

                                                                                                                                                        3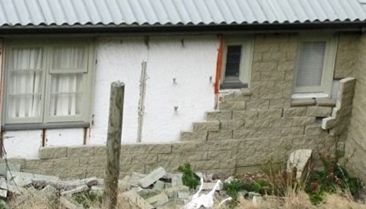
AIR EARTHQUAKE MODEL FOR AUSTRALIA

                                                                                  A Component-Based Approach to
       MASONRY VENEER CONSTRUCTION: A POPULAR                                     Modeling Large Industrial Facilities
       CONSTRUCTION FOR HOMES IN AUSTRALIA                                        Damage functions for more than 400 individual
                                                                                  industrial facility components—including tanks, flares,
                                                                                  boilers, cooling towers, and conveyor systems—are
                                                                                  aggregated to obtain damage functions that represent
                                                                                  the vulnerability of large industrial facilities at the facility-
                                                                                  level. These damage functions are developed using
                                                                                  weights that reflect the proportion of each component’s
                                                                                  contribution to total replacement value of the facility. This
                                                                                  component-based approach provides reliable assessment
                                                                                  of not only the physical damage to the facility but also
                                                                                  business interruption losses, which depend heavily on the
       Masonry veneer, one of the construction classes                            interactions between the facility components.
       supported by the model, comprises 35% of the
       single-family dwellings across Australia, with                             Leveraging AIR’s Detailed Industry
       significant popularity in the southeastern part of
                                                                                  Exposure Database for Australia
                                                                                  AIR has developed a high-resolution industry exposure
       the country. It uses wood frame stud walls as the
                                                                                  database (IED) for Australia based on information on risk
       lateral force resisting system, accompanied by a
                                                                                  counts, building characteristics, and construction costs
       nonstructural unreinforced masonry veneer linked to
                                                                                  from a wide variety of local sources. The benefits and
       it with clips or ties. Forces and deformations can be
                                                                                  uses of AIR’s IED are numerous. It provides a foundation
       transferred between the masonry veneer façade and
                                                                                  for all modeled industry loss estimates. Furthermore,
       the structural wood framing during ground shaking.
                                                                                  risk transfer solutions, such as industry loss warranties
       Given the substantial weight and brittle nature of the
                                                                                  that pay out based on industry losses, rely on the losses
       masonry veneer, this type of construction is much
                                                                                  obtained by analyzing the IED. Using Touchstone®,
       more vulnerable than wood frame housing with
                                                                                  companies can also leverage the IED for Australia to
       lighter exterior cladding.
                                                                                  disaggregate the exposure data in their own portfolios to
                                                                                  a highly detailed level for more realistic loss estimates.

                                                                                  A Comprehensive Approach to Modeled
                                                                                  Loss Validation
                                                                                  Each individual model component has been
                                                                                  independently validated against multiple sources and
        Pre - 1980              1980 - 1994             1995 - 2008
                                                                                  data from historical events. For example, the seismicity
                                                  Australia Vulnerability Zones   component is validated against the catalog of historical
                                                  Code Level Assignment
                                                        Pre Code                  events, the ground motion intensity module is compared
                                                        Low Code - I
                                                        Low Code - II
                                                                                  against ground motion recordings, simulated liquefaction
                                                        Moderate Code - I         has been compared against observed occurrences of
                                                        Moderate Code - II
                                                        Moderate Code - III
                                                                                  liquefaction, and modeled damage ratios have been
       2009 - 2018               Post - 2018
                                                        High Code - I             validated against damage experience in published
                                                        High Code - II
                                                        High Code - III           reports. In addition to these component-level validations,
                                                        Special Code +            the loss estimates produced by the AIR Earthquake Model
                                                                                  for Australia for past earthquakes have been validated
    The AIR model captures the temporal and spatial variation in the
    vulnerability of buildings in Australia through five age bands: pre-          against loss reports for historical events in Australia.
    1980, 1980-1994, 1995-2008, 2008-2018, and post-2018. These
    bands reflect the revision, adoption, and enforcement of relevant
    building code updates.

4
AIR EARTHQUAKE MODEL FOR AUSTRALIA
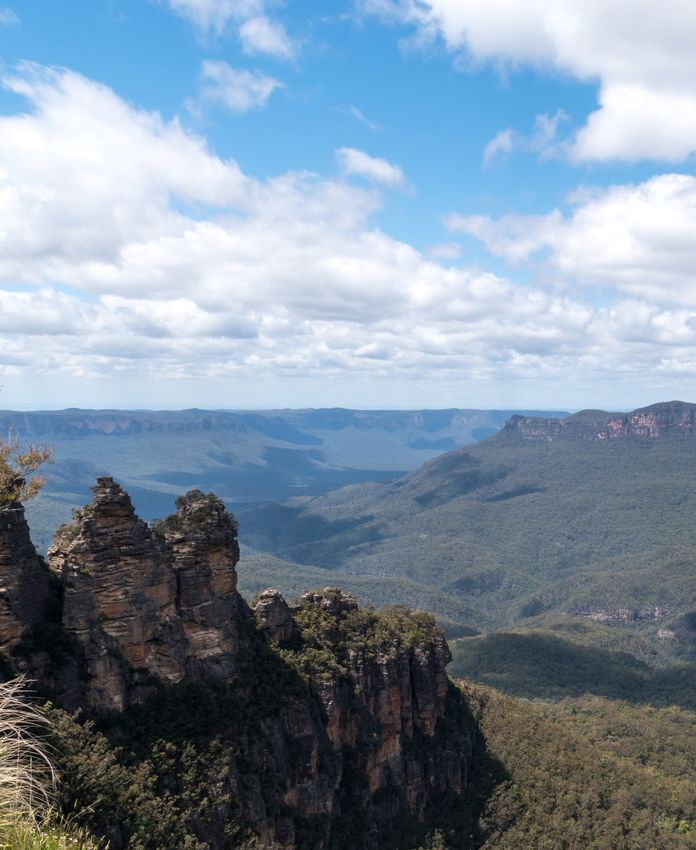
Large Loss Events
10,000
Losses ( Million AUD)
8,000
6,000 AIR’s modeled losses for select
earthquake events in Australia show
good agreement with reported losses.
4,000 (Vertical bars depict variation in reported
losses from multiple sources.)
2,000
-
1954 Adeliade 1989 Newcastle
2020 Historical Benchmark Loss Updated Model Loss
Model at a Glance
Modeled Perils Ground shaking from earthquakes and liquefaction
Model Domain Continental Australia and island of Tasmania
Supported Geographic 1-km grid
Resolution
Supported Construction 127 construction classes; 114 occupancy classes
Classes and Occupancies Unknown Damage Function: When detailed exposure data (e.g., construction type or height)
are unavailable, the model applies an “unknown” damage function that takes into account
CRESTA-specific construction characteristics
Industry Exposure Provides a foundation for all modeled industry loss estimates; can be leveraged to
Database disaggregate exposure data to a highly detailed level for improved loss estimates; includes
selected large industrial facilities (IFMs)
Model Highlights
— Includes thoughtfully developed relationships to consistently homogenize various earthquake magnitude scales to moment
magnitude
— Employs neotectonic faulting, an innovative approach to capturing earthquake hazard in a relatively seismically stable region
such as Australia
— Utilizes the latest high-resolution soil maps to capture the effect of site amplification on ground motion
— Employs two sets of GMPEs that have been tailored to the distinct attenuation properties of eastern and western Australia,
based on the latest research for both stable continental and active regions, considering both locally sourced and globally
available data
— Includes a liquefaction module, covering areas of highest exposure concentration along the west, south, and east coasts of
Australia
— Contains a suite of damage functions that has been vastly expanded to support numerous construction and occupancy
classes
— Damage functions are also region-specific to capture spatial and temporal variations in vulnerability across Australia resulting
from evolving seismic and wind design requirements
— Extensively validated vulnerability functions have been compared against published research and observed damage from
historical earthquakes
— Complete model has been comprehensively validated against observed intensity, damage, and loss data from various
historical events
5ABOUT AIR WORLDWIDE AIR Worldwide (AIR) provides risk modeling solutions that make individuals, businesses, and society more resilient to extreme events. In 1987, AIR Worldwide founded the catastrophe modeling industry and today models the risk from natural catastrophes, terrorism, pandemics, casualty catastrophes, and cyber incidents. Insurance, reinsurance, financial, corporate, and government clients rely on AIR’s advanced science, software, and consulting services for catastrophe risk management, insurance-linked securities, longevity modeling, site-specific engineering analyses, and agricultural risk management. AIR Worldwide, a Verisk (Nasdaq:VRSK) business, is headquartered in Boston, with additional offices in North America, Europe, and Asia. For more information, please visit www.air-worldwide.com. ©2020 AIR Worldwide | A Verisk Business
You can also read