Bulletin of the Geological Society of Greece - eJournals
←
→
Page content transcription
If your browser does not render page correctly, please read the page content below
Bulletin of the Geological Society of Greece

Vol. 47, 2013

                                                                        Improved earthquake location in the area of North
                                                                       Euboean Gulf after the implementation of a 3D non-
                                                                         linear location method in combination with a 3D
                                                                                          velocity model.

                                                                       Mouzakiotis E.               National Observatory of
                                                                                                    Athens, Institute of
                                                                                                    Geodynamics
                                                                       Karastathis K.               National Observatory of
                                                                                                    Athens, Institute of
                                                                                                    Geodynamics
                                                                       http://dx.doi.org/10.12681/bgsg.10974

        Copyright © 2016 E. Mouzakiotis, K. V.
                    Karastathis

 To cite this article:

 Mouzakiotis, E., & Karastathis, K. (2013). Improved earthquake location in the area of North Euboean Gulf after the
 implementation of a 3D non-linear location method in combination with a 3D velocity model.. Bulletin of the Geological
 Society of Greece, 47(3), 1185-1193. doi:http://dx.doi.org/10.12681/bgsg.10974

                            http://epublishing.ekt.gr | e-Publisher: EKT | Downloaded at 03/11/2018 02:21:01 |
Bulletin of the Geological Society of Greece, vol. XLVII 2013
Δελτίο της Ελληνικής Γεωλογικής Εταιρίας, τομ. XLVII , 2013
                                                            Proceedings of the 13th International Congress, Chania, Sept.
Πρακτικά 13ου Διεθνούς Συνεδρίου, Χανιά, Σεπτ. 2013
                                                            2013

IMPROVED EARTHQUAKE LOCATION IN THE AREA OF
NORTH EUBOEAN GULF AFTER THE IMPLEMENTATION
    OF A 3D NON-LINEAR LOCATION METHOD IN
   COMBINATION WITH A 3D VELOCITY MODEL

                             Mouzakiotis E.1 and Karastathis V. K.1
        1
            National Observatory of Athens, Institute of Geodynamics, aggelmo@geol.uoa.gr,
                                         Karastathis@noa.gr

                                                      Abstract
       Considerably improved hypocentral locations of the 274 earthquakes, with magni-
       tudes between 1.5 to 4.1 Ml recorded during the period from 2009 to 2010 by the
       Hellenic Unified Seismographic Network (HUSN), have been obtained for the area
       of North Euboean Gulf after the implementation of a 3D non-linear location algo-
       rithm and a previously calculated local 3D velocity model for both P and S wave
       phases. To assess the effectiveness of the 3D locations we compared the results with
       the solutions obtained with alternative 1D velocity models such as the minimum 1D
       model calculated with the VELEST algorithm and the 1D model used by the Nation-
       al Observatory of Athens (NOA) for daily earthquake analysis. We were further able
       to assess the location accuracy of each model by comparing the location results for
       a number of quarry blasts that occurred in the area in that period. The use of the lo-
       cal 3D velocity model provides considerably more accurate than the minimum 1D
       model which in turn provides more constrained locations from the 1D model of
       NOA. The epicentral locations calculated by each model are almost similar; howev-
       er the depth distribution of the events varies, with depth differences of up to 12 km
       for some earthquakes. The results prove that accurate, local models are necessary in
       order to achieve more accurate locations for the events in a local area.
       Key words: Relocation; Euboean Gulf Seismicity; Central Greece.

                                                     Περίληψη
       Σημαντικά βελτιωμένη ακρίβεια στον προσδιορισμό των εστιών των σεισμών που
       έγιναν στην περιοχή του Βόρειου Ευβοϊκού κόλπου και καταγράφηκαν από το
       σεισμολογικό δίκτυο του Εθνικόυ Αστεροσκοπείου Αθηνών, κατά την περίοδο 2009 με
       2010 επιτεύχθη με τη χρήση τρισδιάστατου μη γραμμικού αλγόριθμου καθορισμού των
       εστιακών συντεταγμένων σε συνδυασμό με τοπικό τρισδιάστατο μοντέλο ταχυτήτων
       για τα P και για τα S κύματα. Για να εκτιμηθεί η ακρίβεια του μοντέλου έγινε σύγκριση
       των εστιακών συντεταγμένων που υπολογίστηκαν από αυτό, με αυτά που
       υπολογίστηκαν από το βέλτιστο μονοδιάστατο μοντέλο της περιοχής και από το
       μονοδιάστατο μοντέλο που χρησιμοποιείται από το Εθνικό Αστεροσκοπείο Αθηνών
       για την ανάλυση της σεισμικότητας. Επί πλέον εκτίμηση της ακρίβειας των μοντέλων
       έγινε συγκρίνοντας τα αποτελέσματα καθορισμού εστιακών συντεταγμένων ενός

                                                XLVII, No 3 - 1185

       http://epublishing.ekt.gr | e-Publisher: EKT | Downloaded at 03/11/2018 02:21:01 |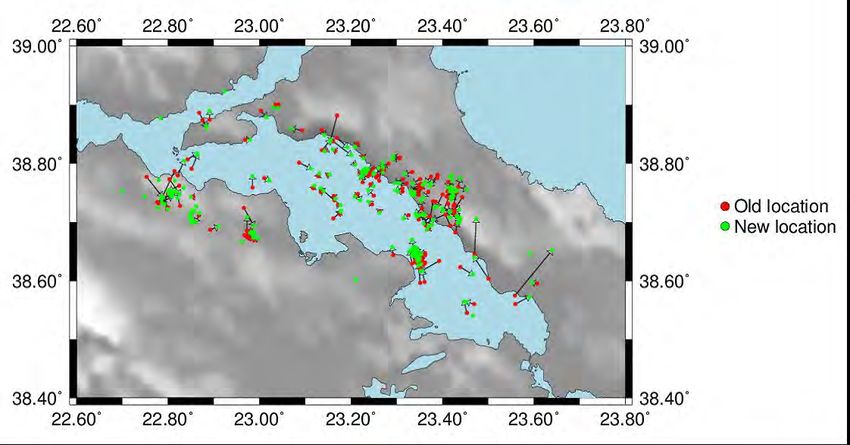
αριθμού λατομικών εκρήξεων. Το τριδιάστατο μοντέλο παρουσίασε τα μικρότερα
       σφάλματα. Το βέλτιστο μονοδιάστατο μοντέλο (minimum 1D) παρουσίασε με τη σειρά
       του μικρότερα σφάλματα από το μοντέλο του Εθνικού Αστεροσκοπείου Αθηνών. Οι
       επικεντρικές συντεταγμένες είναι παρόμοιες για τα 3 μοντέλα, υπάρχει όμως
       διαφοροποίηση στην κατανομή των βαθών. Από τα αποτελέσματα αποδεικνύεται ότι
       ένα αξιόπιστο τοπικό μοντέλο ταχυτήτων είναι σημαντικό για τον ακριβή
       προσδιορισμό των εστιακών συντεταγμένων της σεισμικότητας μιας τοπικής περιοχής.
       Λέξεις κλειδιά: Επανακαθορισμός εστιακών συντεταγμένων; Σεισμικότητα Ευβοϊκού
       κόλπου; Κεντρική Ελλάδα.

1. Introduction
Inadequate knowledge of the earth's velocity structure can lead to systematic errors in hypocentral
location of the earthquakes (Douglas, 1967; Dewey, 1971, 1972; Engdahl and Lee, 1976; Jordan
and Sverdrup, 1981; Pavlis and Hokanson, 1985; Pavlis, 1992) and it can subsequently lead to
incorrect evaluation of earthquake spatial patterns. This problem is more severe in cases of small
local earthquakes, since they are usually recorded only locally, where the velocity structure can be
much different than the average velocity structure of the region covered by the seismographic net-
work. The construction of three–dimensional models is required to correctly calculate the ray
paths, however, is not always feasible, since their calculation requires dense and well distributed
seismicity. Therefore in most cases for the regional seismicity monitoring the data are analyzed
with the use of 1D velocity models, representing the average velocity structure of the earth's crust
in a regional scale.
In this study we assess the performance of the 3D velocity model for the area of North Euboean
Gulf, previously calculated by Karastathis et al. (2011), in locating earthquakes. This is accom-
plished by relocating the seismicity data of the Hellenic Unified Seismographic Network (HUSN)
for this particular area and for a two years period between 2009 and 2010. The results were as-
sessed by comparing the location results of quarry blasts and by examining the error ellipsoids and
the event spatial distribution. It is important to note that the seismicity data used for the evaluation
of the model are totally independent to the ones used for the calculation of the 3D model.

2. Tectonics
The area of the North Euboean Gulf (Figure 1) is located in central Greece, between two major
structures: the North Aegean Trough and the Gulf of Corinth. The area itself contains a number of
notable fault zones. The most important and well documented fault structure is the Atalanti fault
zone (Poulimenos and Doutsos, 1996; Ganas 1998; Pantosti et al., 2001; Karastathis et al., 2007;
Pavlidis et al., 2004) with a NW–SE strike. Two other notable fault zones are the Kamena Vourla
fault zone and the Kallidromo fault zone, north of the Atalanti fault zone. Additionally, the Knimis
fault zone (Jackson et al. 1982) and some additional smaller fault zones in Malesina peninsula with
NE-SW direction (Palyvos, 2001) appear in the area.

3. Methodology and Data
Data from seven local stations belonging to the HUSN network, plus the additional station of
CHLKS, installed for the seismic monitoring of Athens, were utilized in this study (Figure 1).
These stations were the ones within the 3D velocity model area. Although we could not use the
outer stations, the information loss was not significant since the most of the events were of low
magnitude (< 3 Ml) and recorded only locally.

                                         XLVII, No 3 - 1186

       http://epublishing.ekt.gr | e-Publisher: EKT | Downloaded at 03/11/2018 02:21:01 |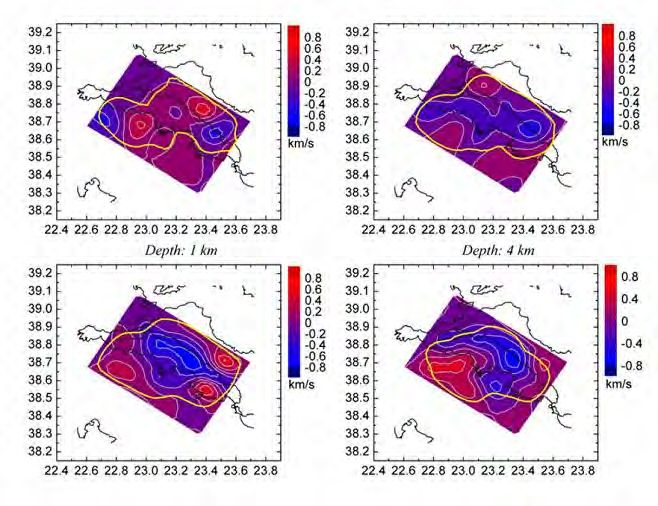
Figure 1 – The study area, the stations that were incorporated and the major fault zones
(Institute of Geology and Mineral Exploration — IGME, 1993; Jackson et al., 1982; Palyvos,
                                  2001; Tzanis et al., 2009).
In total 274 events were recorded with magnitudes larger than 1.5 Ml. The events recorded by five
local stations at minimum. We selected the 217 most reliably located events, with azimuthal gap
lower than 180o and with at least 5 P and 3 S wave phases. Many of the phases used have been
obtained by NOA’s bulletins and then revised when necessary. The dataset was completed with
other local phases not previously considered by NOA after manual picking.
The 1D velocity models utilized are: a) the 1D velocity model used for daily earthquake analysis
by NOA, b) the minimum 1D velocity model calculated by VELEST algorithm (Kissling, 1995) by
Karastathis et al. (2011) (Figure 2). The 3D velocity model (Figure 3) was suggested by
Karastathis et al. (2011) using a dataset acquired by a local seismographic network including 24
land and 6 OBS stations. The creation of the model was based on a successive application of the
1D minimum velocity model algorithm (Kissling et al., 1994) and linearized 3D inversion
(Thurber, 1989; Emberhard-Philips, 1990).
To accurately locate the earthquakes, the probabilistic non-linear location method provided by the
NonLinLoc software package was implemented. The velocity model is imported as a cubic grid
with a velocity value in each node. Travel-times between each node and each station are calculated
using a 3D version (Le Maur, 1994; Le Maur et al., 1997) of the Eikonal finite difference scheme
(Podvin and Lecomte, 1991).
The complete location probability density function (PDF) is accurately obtained by the Oct-Tree
importance sampling algorithm, which is based on recursive subdivision and sampling of cells in
3D space. Location PDF is calculated using the Equal Differential Time function (Lomax, 2005),
which is robust in the presence of outlier data:

                                       XLVII, No 3 - 1187

       http://epublishing.ekt.gr | e-Publisher: EKT | Downloaded at 03/11/2018 02:21:01 |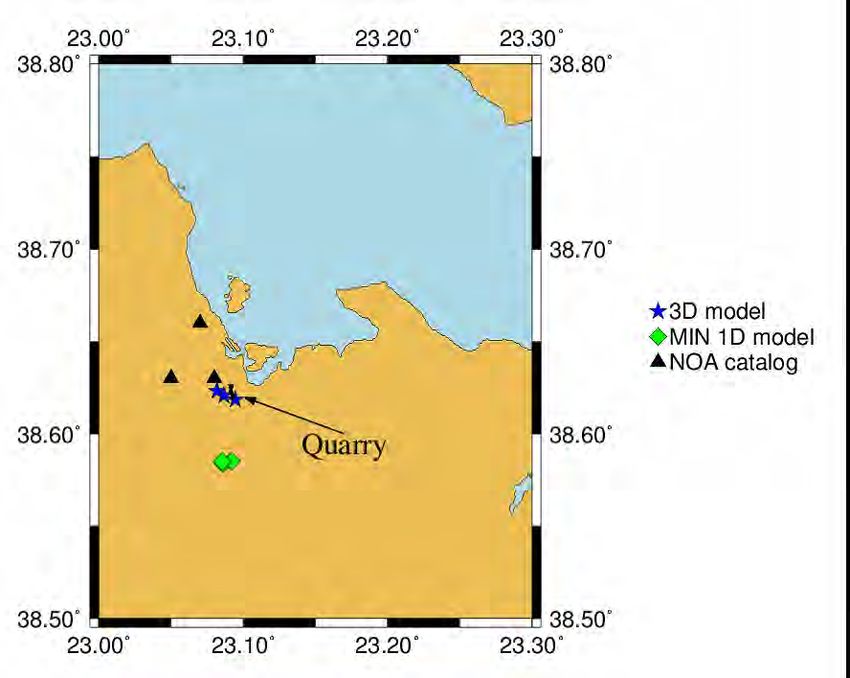
This method is not depended on the origin time, thus reducing the initial 4D problem to a 3D
search over latitude, longitude and depth.

  Figure 2 – NOA 1D (red line) and the minimum 1D (green line) models used in the study.

          Figure 3 – Local normalized 3D velocity model (Karastathis et al., 2011).

4. Results
Each model’s validity was initially assessed by locating three quarry blasts, shot in the Tragana
area and recorded by the HUSN network. The locations of the blasts given in the NOA’s catalog as
it can be seen in Figure 4 are obviously far from the actual site of the quarry.

                                      XLVII, No 3 - 1188

       http://epublishing.ekt.gr | e-Publisher: EKT | Downloaded at 03/11/2018 02:21:01 |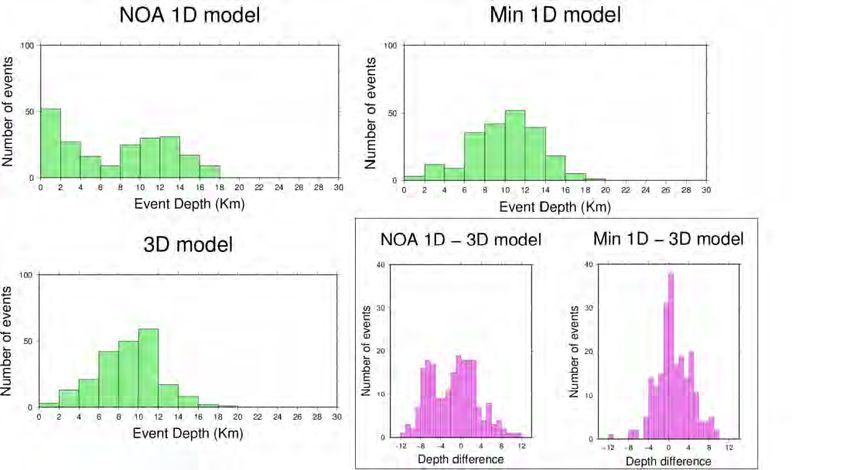
The 1D minimum model concentrated the blasts at the same position but epicenters are
systematically mislocated to the south by approximately 7Km. This was expected due to the lack
of seismographic stations south of the quarry. In spite of this limitation, however, the three blasts
were accurately located within the quarry, when using the local 3D model. These results prove the
validity of the model in a local scale.
The next step was to evaluate the model by a direct comparison of the location results of the
seismicity with those obtained by the 1D models. The results proved that the 3D model achieved
significantly better constrained event locations, compared to the other two models. In turn the
minimum 1D model provided more constrained locations compared to the NOA 1D model. The
average confidence ellipsoid volume was 55.4 Km3 for the 3D model, 78.9 Km3 for the minimum
1D model and 106 Km3 for the NOA 1D model. The average major semi-axis lengths were 4.8
Km, 5.3 Km and 6.8 Km, respectively, for the 3 models (Figure 5).
It is worth to note that despite the small number of seismographic stations, we obtained highly
constrained event locations for a large number of events, mainly in the central area, where the
azimuthal coverage was optimal. Thus, the unrealistic results given by the usual RMS error
minimizing procedure were considerably eliminated.
The results did not show any significant shift in the epicentral distribution for most of the events,
between the 3 models (Figures 6, 7). The picture however is quite different for the distribution of
Figure 4 – Map showing the location of the quarry blasts as obtained by the NOA’s catalogue
(black), the minimum 1D model (green) and the 3D model (blue).
the hypocentral depths between the 3 models, as seen in Figure 8. For the NOA 1D model this
distribution is quite unrealistic with a large number of events being located above the depth of 2
Km. The minimum 1D model showed an almost symmetrical distribution centered around the
depths of 10-12 Km with the majority of the events being located between 6 to 14 km. For the
local 3D model most events are located within 6 to 12 km. The number of events increases almost
linearly from 2 to 12 km and then drops rapidly, which indicates that the brittle-ductile transition
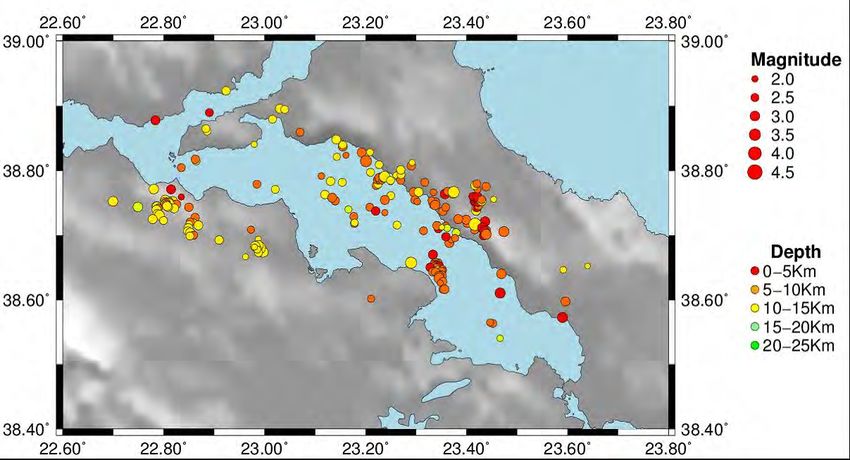
zone is at this depth. We can see from the results that the majority of the seismicity is located on
the western coast of the island of Euboea (Figure 9). The rest of the events are concentrated at
known fault areas. The two clusters in the NW part of the area are probably related to the Knimis
and Kalidromo fault zones. An exception is the cluster located offshore, east of Malesina peninsula
since the seismicity cannot be safely related to the Atalanti fault. The possibility that this cluster is
XLVII, No 3 - 1189
http://epublishing.ekt.gr | e-Publisher: EKT | Downloaded at 03/11/2018 02:21:01 |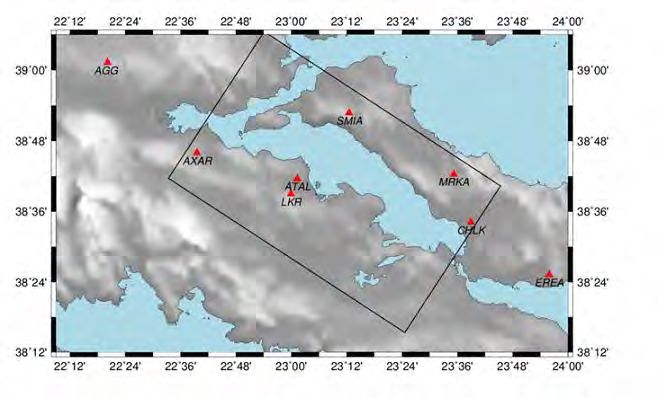
related to an active zone at the opposite coast cannot be dismissed. Finally no significant
seismicity appears to be attributed to the major fault zone of Atalanti.

Figure 5 – Distribution of the major ellipsoid semi-axes for the NOA 1D model (top left), the
               minimum 1D model (top right) and the 3D model (bottom left).
The results proved clearly that the local 3D velocity model is valid for the area and could assist
towards more accurate hypocentral locations. As it has already been mentioned, the velocity model
has been calculated on the basis of a totally different dataset, with different stations, event
locations and ray coverage. The successful location of the earthquakes is an indicator of the
independency of the model from the initial dataset used for its calculation. However we are
skeptical about the value of constructing such models for use in daily earthquake analysis. Indeed
locating events with this method requires a dense and evenly distributed seismographic network
within the area of the model, something not feasible due to the geomorphology limitations of
Greece.

 Figure 6 – Locations obtained by the NOA 1D model (red) and the 3D model (green). Only
             the events located with azimuthal gap lower than 180 o are shown.

                                       XLVII, No 3 - 1190

       http://epublishing.ekt.gr | e-Publisher: EKT | Downloaded at 03/11/2018 02:21:01 |
Figure 7 – Locations obtained by the minimum 1D model (red) and the 3D model (green).
          Only the events located with azimuthal gap lower than 180 o are shown.

Figure 8 – Depth distribution of the events for the NOA 1D model (top left), the minimum 1D
     model (top right) and the 3D model (bottom left). Depth differences for the located
  earthquakes, between the 3D and the 1D models are also presented in this figure (bottom
                                             right.

                                     XLVII, No 3 - 1191

      http://epublishing.ekt.gr | e-Publisher: EKT | Downloaded at 03/11/2018 02:21:01 |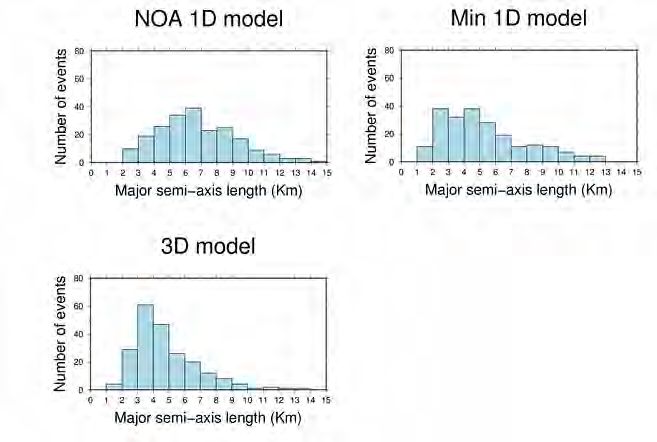
Figure 9 – Event locations map calculated with the use of the local 3D velocity model.

5. Acknowledgments
The seismicity data used were gathered by the Hellenic Unified Seismograph Network in the peri-
od of 2009-10. We would like to thank the scientific and technical personnel who worked for the
creation of this dataset. Thanks are also due to Dr G. Papadopoulos who provided the waveform
data of CHLK station for the entire study period. The CHLK station was part of the network estab-
lished for the monitoring of the metropolitan area of Athens for the Olympic Games of 2004. We
would also like to thank Lafarge Beton who provided us with information on the quarry blasts
used in that period. The calculation of the 3D local velocity model of the North Euboean Gulf was
based on the data funded by the General Secretariat for Research and Technology of Greece,
through the research project “AMPHITRITE”.
Thanks are due to professor Eleftheria Papadimitriou and professor Antonis Vafidis for their
constructive comments which improved the initial version of the paper.

6. References
Dewey J.W. 1971. Seismicity studies with the method of joint hypocenter determination, Ph.D.
        Thesis, University of California, Berkeley, California.
Dewey J.W. 1972. Seismicity and tectonics of western Venezuela, Bull. Seism. Soc. Am. 62,
        1711–1751.
Douglas A. 1967. Joint epicentre determination, Nature 215, 47–48.
Eberhart-Phillips D. 1990. Three-dimensional P and S velocity structure in the Coalinga Region,
        California, Journal of Geophysical Research 95, 15 343–15 363.
Engdahl E.R.and Lee W.H.K. 1976. Relocation of local earthquakes by seismic ray tracing, J.
        Geophys. Res. 81, 4400–4406.
Ganas A., Roberts G. and Memou P. 1998. Segment boundaries, the 1894 ruptures and strain
        patterns along the Atalanti Fault, central Greece, Journal of Geodynamics 26, 461–486.
Jordan T. H.and Sverdrup K. A. 1981. Teleseismic location techniques and their application to
        earthquake clusters in the south-central Pacific, Bull. Seism. Soc. Am. 71, 1105–1130.

                                      XLVII, No 3 - 1192

       http://epublishing.ekt.gr | e-Publisher: EKT | Downloaded at 03/11/2018 02:21:01 |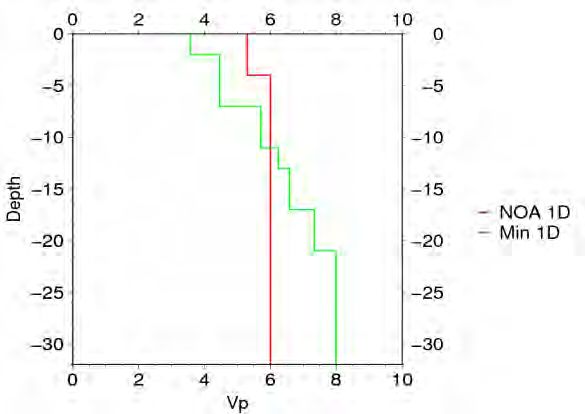
Karastathis V.K.,Ganas A.,Makris J., Papoulia J.,Dafnis P., Gerolymatou E.and Drakatos G.
                                            2007. The application of shallow seismic techniques in the study of active faults: the
                                            Atalanti normal fault, central Greece, Journal of Applied Geophysics 62, 215–233.
                                   Karastathis V.K., Papoulia J., Di Fiore B., Makris J., Tsambas A., Stampolidis A. and
                                            Papadopoulos G.A. 2011. Deep structure investigations of the geothermal field of the
                                            North Euboean Gulf, Greece, using 3-D local earthquake tomography and Curie Point
                                            Depth analysis. Journal of Volcanology and Geothermal Research 206, 106–120.
                                   Kissling E., Ellsworth W.L., Eberhart-Phillips D.and Kradolfer U. 1994. Initial reference models
                                            in local earthquake tomography, Journal of Geophysical Research 99, 19635–19646.
                                   Kissling E. 1995. Velest User's Guide, Internal report, Institute of Geophysics, ETH, Zurich.
                                   Le Meur H. 1994. Tomographie tridimensionnelle a partir des temps des premieres arrivees
                                            des ondes P et S, application a la region de Patras (Grece), These de Doctorat, Paris VII,
                                            France.
                                   Le Meur H., Virieux J.and Podvin P. 1997. Seismic Tomography of the gulf of Corinth: a
                                            comparison of methods, Annali di Geofisica, 40, 6, 1-24.
                                   Lomax A. 2005. A reanalysis of the hypocentral location and related observations for the great
                                            1906 California earthquake, Bull. Seism. Soc. Am., 9, 861 – 877.
                                   Palyvos N. 2001. Geomorphological study of the broader area of Atalanti, Fthiotis. Ph.D. Thesis.
                                            University of Athens, Greece, (in Greek).
                                   Pantosti D., De Martini P.M., Papanastassiou D., Palyvos N., Lemeille F. and Stavrakakis G.
                                            2001. A reappraisal of the 1894 Atalanti earthquake surface ruptures, central Greece,
                                            Bulletin of the Seismological Society of America 91, 760–780.
                                   Pavlides S.B., Valkaniotis S., Ganas A., Keramydas D. and Sboras S. 2004. The active fault of
                                            Atalanti — re-evaluation with new geological data. Bulletin of the Geological Society of
                                            Greece 36, 1560–1567 (in Greek).
                                   Pavlis G.L. and Hokanson N. B. 1985. Separated earthquake location. J. Geophys. Res. 90,
                                            12,777– 12,789.
                                   Pavlis G.L. 1986. Appraising earthquake hypocenter location errors - a complete, practical
                                            approach for single-event locations, Bull. Seism. Soc. Am., 76, 1699-1717.
                                   Pavlis G. L. 1992. Appraising relative earthquake location errors, Bull. Seism. Soc. Am. 82, no. 2,
                                            836–859.
                                   Podvin P. and Lecomte I. 1991. Finite difference computation of traveltimes in very contrasted
                                            velocity models: a massively parallel approach and its associated tools, Geophys. J. Int.,
                                            105, 271-284.
                                   Poulimenos G.and Doutsos T. 1996. Barriers on seismogenic faults in central Greece, J. Geodyn.
                                            22 (1-2), 119 – 135.
                                   Thurber C.H. 1983. Earthquake locations and three dimensional crustal velocity structure in the
                                            Coyote lake area, central California, Journal of Geophysical Research 88, 8226–8236.
                                   Tzanis A., Kranis H.and Chailas S. 2009. An investigation of the active tectonics in central-eastern
                                            mainland Greece with imaging and decomposition of topographic and aeromagnetic data,
                                            J. Geodyn., doi:10.1016/j.jog.2009.09.042.

                                                                          XLVII, No 3 - 1193

                                          http://epublishing.ekt.gr | e-Publisher: EKT | Downloaded at 03/11/2018 02:21:01 |
Powered by TCPDF (www.tcpdf.org)
You can also read