MEASURES PHASE-BASED ANTARCTICA ICE VELOCITY MAP, VERSION
←
→
Page content transcription
If your browser does not render page correctly, please read the page content below
Note: This document was written and provided by B. Scheuchl.

MEaSUREs Phase-Based Antarctica Ice
Velocity MAP, Version 1
This data set, as part of the NASA Making Earth System Data Records for Use in Research
Environments (MEaSUREs) Program, combines interferometric phases from multiple satellite
interferometric synthetic-aperture radar systems to derive the first comprehensive phase-based
map of Antarctic ice velocity. The precision in ice speed (20 cm/yr) and flow direction (5
degrees) over 80% of Antarctica is a factor 10 better than prior mappings based on feature and
speckle tracking. Phase-derived velocity are mostly for years between 2007 and 2018 while
regions covered by tracking-derived velocity (along the coasts) will mostly be representative of
years 2013-2017. Additional data acquired between 1996 and 2018 was used as needed to
maximize coverage.

See Antarctic Ice Sheet Velocity and Mapping Data for related data.

This is the most recent version of these data.

Version Summary
This is the first data set of its kind and supersedes the tracking-based continent-wide map
(MEaSUREs InSAR-Based Antarctica Ice Velocity Map, Version 2) due to significantly higher
accuracy.
Overview
Parameter(s): Snow/Ice > Ice Velocity

Data Format(s):      NetCDF

Spatial Coverage:
N: -60,
S: -90,
E: 180,
W: -180

Platform(s):
Phase portion:
ALOS, ALOS-2, ENVISAT, ERS-1, ERS-2, RADARSAT-1, RADARSAT-2

Tracking data:
ALOS, ENVISAT, ERS-1, ERS-2, LANDSAT-8, RADARSAT-1, RADARSAT-2, SENTINEL-
1A/1B, TanDEM-X, TERRASAR-X

Spatial Resolution: 450 m x 450 m

Sensor(s):    ASAR, C-SAR, OLI, PALSAR, PALSAR-2, SAR

Temporal Coverage: 1 January 2007 to 31 December 2018 (with some historic data added to
increase coverage)

Version(s):   V1

Temporal Resolution:        11 year

Metadata XML:        View Metadata Record

Data Contributor(s): Jeremie Mouginot, Eric Rignot, Bernd Scheuchl
Detailed Data Description

Format

The data are formatted in Network Common Data Form, Version 4 (NetCDF-4) (.nc) following
version 1.6 of the Climate and Forecast (CF) metadata conventions. For more information about
working with NetCDF formatted data, visit the UCAR Unidata Network Common Data Form Web
site.

File Naming Convention
This data set includes one file named antarctic_ice_vel_phase_map_v01.nc (450 m grid
spacing).

File Size
The size of this data set is approximately 40 GB.

Spatial Coverage
The data set spans the continent of Antarctica. Figure 1 provides a map of the spatial coverage.
Southernmost Latitude: 90° S
Northernmost Latitude: 60° S
Westernmost Longitude: 180° W
Easternmost Longitude: 180° E
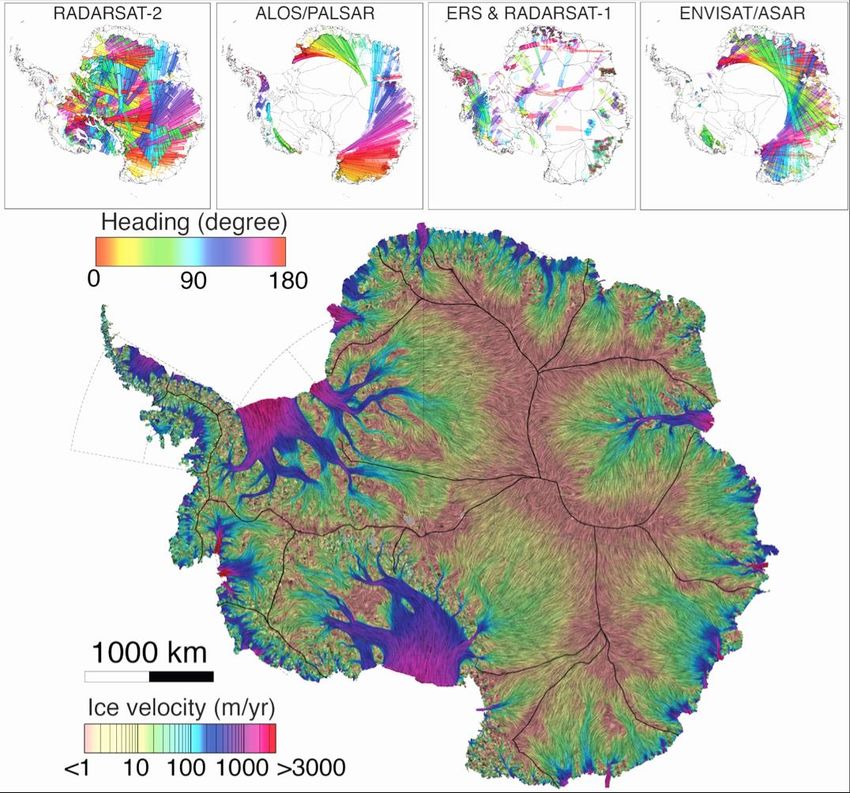
Spatial Coverage Map and Sample image

Figure 1. Mapping of ice motion in Antarctica using synthetic-aperture radar interferometric
phase data. Upper panels show the distribution of data tracks used from the Canadian
RADARSAT-2, Japanese ALOS PALSAR, European ERS and Canadian RADARSAT-1, and
European Envisat ASAR. Lower main panel shows a complete map of ice motion in Antarctica
combining phase data in the interior and speckle tracking in the fast-moving sectors, with speed
colored on a logarithmic scale from brown (less than 1 m/yr) to red (more than 3 km/yr) and flow
direction indicated by colored lines and showing the flow pattern of ice across the continent.
Projection is polar stereographic at 71° S secant plane [Mouginot et al. 2019].
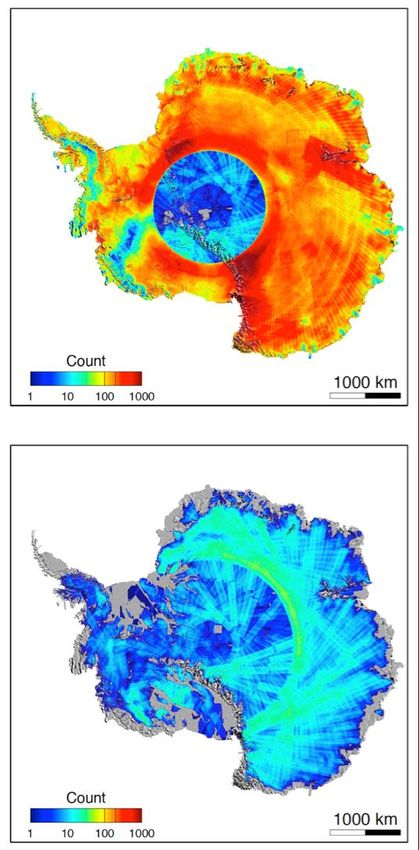
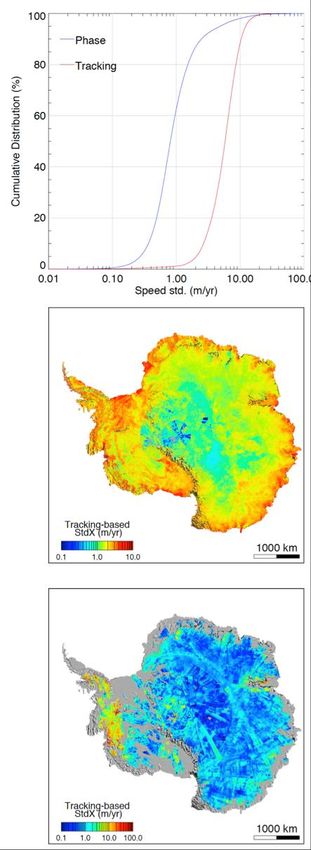
Spatial Resolution
The spatial resolution of the velocity map is 450 m.

Projection
Polar stereographic with true scale at 71° S. Refer to Polar Stereographic Projection and Grid
page for more information and polar stereographic grid definitions.

Temporal Coverage
The data were collected between 1996 and 2016. Detailed information is provided in the Data
Acquisition and Processing section.

Parameter or Variable
This data set provides a comprehensive, InSAR phase - based high precision ice velocity map
of the Antarctic Ice Sheet posted at 450 m grid spacing. Tracking based results are used to
augment the phase-based map in coastal areas, where phase analysis was not possible with
the available data. The velocity components for the x and y direction, as defined by the polar
stereographic grid, are stored in the NetCDF variables named VX and VY and are recorded in
m/yr. Error estimates for the velocity components are provided as variables ERRX and ERRY;
however, these values should be used more as an indication of relative quality rather than
absolute error. More information about the error estimates is provided in the Quality
Assessment section as well as in Mouginot et al. (2019). The data also include the standard
deviations for the velocity estimates (STDX,STDY), as well as a count of scenes (CNT) used to
estimate the values for each pixel. Figure 2 shows the error and standard deviation estimates
for both the phase based map and a tracking based map (the latter was blended with the former
to provide maximum coverage). Figure 3 shows the total number of measurements used to
estimate the velocity for both, phase-based and tracking-based map. Table 1 provides a
complete list of the variables and their descriptions.
Figure 2. Standard deviation maps of the absolute ice speed measurements in Antarctica. (top)
Lognormal cumulative distribution of the standard deviation over area mapped by both methods.
Standard deviation maps for tracking-based (middle) and phase-based (bottom) [Mouginot et al.
2019].
Figure 3. Number of stacked measurements for tracking-based (top) and phase-based (bottom)
to compute the composite velocity map [Mouginot et al. 2019].
Variable Description
The variables included in the NetCDF file are described in Table 1. All variables have grid
dimensions of 12445 x 12445 and are posted at 450 m spacing.
  Variable                     Description                   Data Type

 x            Cartesian x-coordinate                         double

 y            Cartesian y-coordinate                         double

 lat          Latitude                                       double

 lon          Longitude                                      double

 VX           Component of velocity in m/yr in x direction   float

 VY           Component of velocity in m/yr in y direction   float

 STDX         Standard deviation of vx                       float

 STDY         Standard deviation of vy                       float

 ERRX         Estimated error in m/yr in x direction         float

 ERRY         Estimated error in m/yr in y direction         float

 CNT          Count of scenes used per pixel                 integer

 SOURCE       Method of measurement (phase, tracking,
              hybrid)

Note: To convert the VX and VY velocity components into magnitude (speed) and direction
(angle), use the following equations:
(1) speed = √(vx2 + vy2)
(2) angle = arctan (vy / vx)
(3) error = √(errx2 + erry2)
(4) error of flow direction = error/(2*speed) (see Mouginot et al., 2012)
However, users should take care when computing the inverse tangent due to the function's
inherent ambiguities. While the standard arctan function typically does not account for angles
that differ by 180°, most modern computer languages and math software packages include the
function ATAN2, which uses the signs of both vector components to place the angle in the
proper quadrant.
Software and Tools
Unidata at the University Corporation for Atmospheric Research maintains an extensive list of
freely available Software for Manipulating or Displaying NetCDF Data.
Quality Assessment
A detailed description of these data and their quality is provided in Mouginot et al. 2019. The
precision of ice flow mapping varies with the sensor, the geographic location, the technique of
interferometric analysis (refer to Data Acquisition and Processing for details), the time period of
analysis, the repeat cycle, and the amount of data stacking. The sensor characteristics for the
phase map generation are summarized in Table 2.
The unwrapped phase uses C-Band sensors ( ~ 5.5 cm) with 1461 tracks from RADARSAT-1
& -2, 76 from ERS-1/2, 319 from Envisat ASAR, and L-Band sensors ( ~ 23.6 cm): 556
from ALOS/PALSAR and 3 from ALOS2/PALSAR2 (Fig. 1A). The combination of phase and
tracking mosaic covers 99.8% of Antarctica (Fig. 1B) with a significantly improved description
of ice flow from the ice divides in the deep interior to the periphery. The phase mosaic itself
does
not cover all of Antarctica for two reasons: 1) the interferometric phase is aliased in
areas of fast flow due to the long temporal baseline of the data (except the ASE); 2) some
sectors do not have sufficient multi-track coverage to provide reliable estimates of the vector ice
motion. Overall, the phase-based map covers 71% of Antarctica, or 9.9 million square km, while
tracking-based map covers 99.6%, or 13.8 million square km (Mouginot et al., 2017) . The
improvement in precision is especially significant along ice divides when examining the error in
flow direction [Mouginot et al., 2019].
Table 2. Sensor characteristics. Note: Phase error is determined for a single unwrapped phase
using the nominal repeat cycle assuming an conservative error of π radians (½ cycle) [Mouginot
et al. 2019].
SENSOR Radar Repeat Period Number of Phase
Frequency Cycle unwrapped Error
Band (days) phases (m/yr)
(wavelengt
h in cm)
ALOS/PALSAR L (23.6) 46 2006-2010 556 0.47ENVISAT/ASAR C (5.6) 35 2006-2010 319 0.15
ALOS2/PALSAR2 L (23.6) 12 2015 3 1.79
RADARSAT-1 C (5.5) 24 1997-2001 265 0.21
RADARSAT-2 C (5.5) 24 2009-2018 1196 0.21
ERS-1/-2 C (5.6) 1 or 3 1992-1996 76 5.11 or
1.70
Composite 1992-2018 15-20
phase/speckle cm/yr
map
Data Acquisition and Processing
Theory of Measurements
This data set provides new ice velocity map of Antarctic ice velocity that is ten times more
precise than prior maps and reveals ice motion at a high precision over 80% of the continent
versus 20% in the past. The ice motion vector map provides novel constraints on interior ice
motion and its connection with the glaciers and ice stream that control the stability and mass
balance of the Antarctic Ice Sheet.
The map was derived from a variety of satellite radar interferometry data. (See the Data
Sources section for a complete list.) Several analysis techniques using SAR data were used to
generate the maps:
1. Combination of interferometric phases of two independent tracks to retrieve the surface
flow vector [Mouginot et al. 2019], applied to a vast region of Antarctica
2. Speckle tracking in both along (azimuth) and across (range) track directions, used to
augment the phase map in coastal areas [Rignot, et al, 2011; Mouginot et al, 2012;
Mouginot et al. 2017].
3. Calculation of two dimensional offsets in amplitude imagery [Mouginot et al. 2012].
4. Combinations of (range) interferometric phases along two independent tracks Mouginot
et al, 2012]In all cases, surface parallel flow is assumed, a conventional approach for ice sheets. The
Landsat-8 data are processed using repeat image feature tracking (see Mouginot, et al. 2017).
Data Acquisition Methods
This digital image mosaic was built from the sources listed in Table 3.
Phase-derived velocity are mostly for years between 2007 and 2018 while regions covered by
tracking-derived velocity (along the coasts) will mostly be representative of years 2013-2017.
Additional data acquired between 1996 and 2018 was used as needed to maximize coverage.
SAR acquisitions between 2006 and 2018 were coordinated by the IPY Space Task Group and
its successor, the Polar Space Task Group (PSTG).
Data Sources
Table 3 describes the data sources used in this data set.
Platform/Sen Space Look Mode Rep Incide Resolu Frequency Year
sor Agency Dir. eat nce tion (GHz)
Cyc Angle Rg x
le Az (m)
(day
)
ERS-1 & Europea Right N/A 1-3 23 13x4 5.33 1996
2/SAR n Space
Agency
(ESA)
RADARSAT- Canadia Left/Ri Varies 24 18-47 12x5- 5.33 1997/2
1/SAR n Space ght 17x6 000
Agency
(CSA)
ENVISAT/AS ESA Right IS2 35 23 13x5 5.33 2007-
AR 2009
RADARSAT- CSA Left S5/EH4 24 41/57 12x5 5.33 2009-
2/SAR 2018
ALOS/PALS Japan Right FBS 46 39 7x4 1.27 2006-
AR Aerospa 2010
ce
Explorati
onAgency
(JAXA)
Sentinel- ESA Right IW-T 12 12x43 5.33 2014-
1/SAR OPS 2018
Landsat- USGS/N N/A Panchro 16 N/A 15x15 2013-
8/OLI ASA matic 2018
TanDEM- German right N/A 11 46.3 1.4x1.8 9.65 2011-
X/TerraSAR- Space 2016
X/SAR Agency
(DLR)
Version History
Version 1.0 was released July 2019. Refer to Table 4 for this data set's version history:
Ver Description
sio
n
V1 Initial version (July, 2019)
References and Related Publications
Rignot, E., J. Mouginot, and B. Scheuchl. 2011. Ice Flow of the Antarctic Ice Sheet. Science
333(6048): 1427-1430. doi: 10.1126/science.1208336.
Mouginot, J., B. Scheuchl, and E. Rignot. 2012. Mapping of Ice Motion in Antarctica Using
Synthetic-Aperture Radar Data. Remote Sensing 4(9): 2753-2767. doi: 10.3390/rs4092753.
Scheuchl, B., J. Mouginot, and E. Rignot. 2012. Ice velocity changes in the Ross and Ronne
sectors observed using satellite radar data from 1997 and 2009. The Cryosphere 6: 1019-1030.
doi: 10.5194/tc-6-1019-2012.
Mouginot, J., E. Rignot, and B. Scheuchl. 2015. Sustained increase in ice discharge from the
Amundsen Sea Embayment, West Antarctica, from 1973 to 2013. Geophysical Research
Letters 41: 1576–1584. doi: 10.1002/2013GL059069.
Mouginot, J., et al. 2017. Comprehensive Annual Ice Sheet Velocity Mapping Using Landsat-8,
Sentinel-1, and RADARSAT-2 Data. Remote Sensing 9(4): Art. #364. doi: 10.3390/rs9040364.Mouginot, J., E. Rignot, and B. Scheuchl. 2019. Continent-wide, interferometric SAR phase- mapping of Antarctic ice velocity. GRL (in publication) RELATED DATA COLLECTIONS ● MEaSUREs InSAR-based Antarctica Ice Velocity Map ● MEaSUREs Antarctic Grounding Line from Differential Satellite Radar Interferometry ● MEaSUREs InSAR-Based Ice Velocity Maps of Central Antarctica: 1997 and 2009 ● MEaSUREs InSAR-Based Ice Velocity of the Amundsen Sea Embayment, Antarctica ● MEaSUREs Antarctic Boundaries for IPY 2007-2009 from Satellite Radar RELATED WEB SITES ● NASA MEaSUREs Data at NSIDC ● NASA MEaSUREs Contacts and Acknowledgments Investigators Dr. Jeremie Mouginot 1,2 1 University of California, Irvine Department of Earth System Science Croul Hall Irvine, California 92697 USA 2 Institut des Géosciences de l’Environnement (IGE) Université Grenoble Alpes - FRANCE Dr. Eric Rignot University of California, Irvine Department of Earth System Science Croul Hall Irvine, California 92697 USA Dr. Bernd Scheuchl University of California, Irvine Department of Earth System Science Croul Hall Irvine, California 92697 USA Acknowledgments: These data were generated through a grant from the NASA MEaSUREs program.
Spaceborne Synthetic Aperture Radar (SAR) acquisitions were provided through the following
data agencies:
ALOS PALSAR, ALOS-2/PALSAR-2: Japan Aerospace Exploration Agency (JAXA)
ENVISAT ASAR, ERS-1, ERS-2: European Space Agency (ESA)
Sentinel-1: Copernicus/ESA
RADARSAT-1, RADARSAT-2: Canadian Space Agency (CSA), MDA
Landsat-8 (optical) data were made available by United States Geological Survey (USGS).
Data acquisitions between 2006 and 2018 are courtesy of the International Polar Year (IPY)
Space Task Group and its successor, the Polar Space Task Group (PSTG).
Contains modified Copernicus Sentinel data (2014-2017), acquired by the European Space
Agency, distributed through the Alaska Satellite Facility, and processed by Rignot, E., J.
Mouginot, and B. Scheuchl.

Document Information
DOCUMENT CREATION DATE
July 2019
You can also read