Venncast Report - Venn Investor Platform
←
→
Page content transcription
If your browser does not render page correctly, please read the page content below
March 2019

 Venncast
 Report
  Alex Botte, CFA, CAIA      Abstract
  Product Specialist, Venn
                             Allocators often receive fund performance on a delayed basis, notably for
                             non-public funds. Understanding timely portfolio performance can there-
                             fore be challenging. Venncast is a tool that provides users with up-to-date
                             performance estimates. In this study, we use master portfolios in Venn to
                             test how well Venncast works and provide an example of how allocators
                             may actually use it.

                             This article is not an endorsement by Two Sigma Investor Solutions, LP or any of its affiliates (collectively, “Two Sigma”) of the
                             topics discussed. The views expressed above reflect those of the authors and are not necessarily the views of Two Sigma.
                             This article (i) is only for informational and educational purposes, (ii) is not intended to provide, and should not be relied upon,
                             for investment, accounting, legal, or tax advice, and (iii) is not a recommendation as to any portfolio, allocation, strategy, or
                             investment. This article is not an offer to sell or the solicitation of an offer to buy any securities or other instruments. This
                             article is current as of the date of issuance (or any earlier date as referenced herein) and is subject to change without notice.
                             The analytics or other services available on Venn change frequently, and the content of this article should be expected to
                             become outdated and less accurate over time. Two Sigma has no obligation to update the article, nor does Two Sigma make
                             any express or implied warranties or representations as to its completeness or accuracy. This material uses some trademarks
tsvenn.com                   owned by entities other than Two Sigma purely for identification and comment as fair nominative use. That use does not imply
                             any association with or endorsement of the other company by Two Sigma or vice versa. See the end of the document for other
                             important disclaimers and disclosures.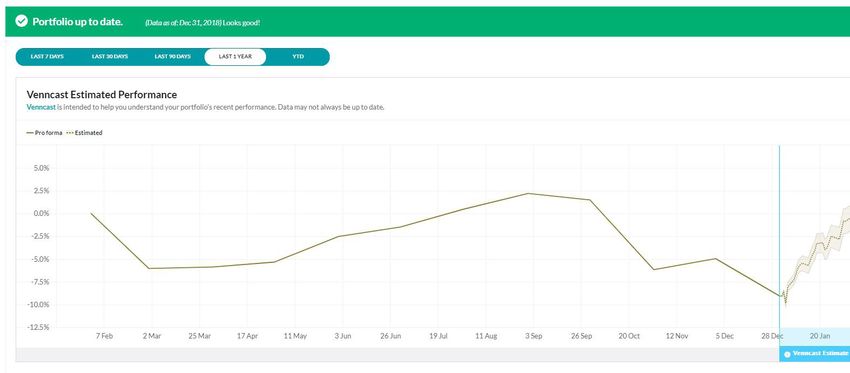
Introduction
Understanding current portfolio performance is important for many reasons, including
reporting, stakeholder communication, and market analysis. Because returns are
often only reported on a delayed basis, understanding current performance can be
challenging. Answering the basic question of “How is my portfolio doing?” should
not be so hard. Venncast can help users meet this challenge by displaying current
portfolio1 estimates before reported returns are available.

Exhibit 1 | Venncast Example for Venn’s Demo Portfolio2
Source: Venn, February 2019.

To do this, Venncast uses estimates of the portfolio’s current factor exposures, along   Exhibit 2 | Venncast Portfolio Results by
                                                                                         Month6
with the Two Sigma Factor Lens’s factor returns, which are readily available on Venn,    Source: Venncast, December 2018.

to infer portfolio performance and the error bands of that estimate.
                                                                                                                        # of      % of
                                                                                                          Total # of Successful Successful
How Accurate is Venncast?                                                                 Month           Portfolios Portfolios Portfolios

A natural question is, how well does Venncast actually work? We set up a study to try       1                   62                 48               77%
                                                                                            2                   62                 47               76%
to answer this question.3 We selected master portfolios on Venn that have at least 42
                                                                                            3                   62                 38               61%
months of returns.4 We used the first 36 months to calculate each portfolio’s factor        4                   62                 44               71%
exposures and residual return.5 Then we Venncasted the next six months for each             5                   62                 45               73%
                                                                                            6                   62                 47               76%
portfolio and compared these estimates to the corresponding six months of reported
                                                                                         Average                62                 45               72%
returns.

Here are the results of comparing the Venncast returns with the reported returns:

      • 62 master portfolios analyzed                                                      1 Venncast is also available at the strategy and investment levels.
                                                                                           2 We shortened the demo portfolio returns to end on December
      • After month six, ~76% of the portfolios’ reported returns were within the            31, 2018 in order to Venncast.
                                                                                           3 The study was based on the Venncast methodology updated
         Venncast error bands                                                                in January 2019. We would expect the results of the study for
                                                                                             Venncast before the update to be different.
                                                                                           4 We required 42 months of returns because Venncast requires 3
Exhibit 2, above, displays the results by month.                                             years of monthly portfolio history to generate factor exposures,
                                                                                             and Venncast forecasts performance for up to 6 months.
                                                                                           5 Venncast does not provide performance estimates for portfolios
How should we interpret these results? Are they acceptable? Should the percent of            with residual risk greater than 40%, so we removed such
                                                                                             portfolios from our sample. At that level of residual, it becomes
“successful” portfolios be higher or lower than 72% on average?                              difficult to provide a reasonable Venncast estimate because less
                                                                                             of the portfolio’s risk and return is captured by the Two Sigma
                                                                                             Factor Lens.
To answer these questions, let’s first discuss the Venncast error bands.                   6 “Successful” is defined here as reported portfolio returns falling
                                                                                             within the Venncast error bands.

                                                                       1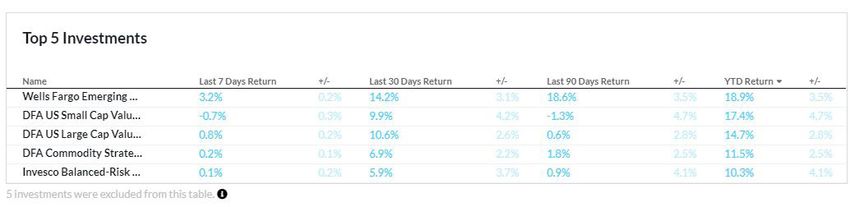
Venn recognizes that Venncast performance estimates are estimates only and carry
many uncertainties, which the error bands attempt to quantify. Uncertainties include
errors in estimating factor exposures, changing factor exposures, and the volatility of
the residual return. Therefore, the error bands are intended to reflect the volatility of
the residual return and the covariance of factor returns over the estimation period.
Couldn’t Venn “inflate” the successful percentages above just by widening the error
bands? Wider error bands may provide more “successful” Venncast performance
estimates, but they would also make the performance estimates less useful. Imagine a
case where Venncast estimates a +2% return over a six month period with error bands
of ±100%. That wouldn’t be very helpful at all!
Instead, Venncast shows error bands of one standard deviation. Therefore, we would
expect that reported portfolio returns would fall within the error bands around 68%
of the time.7 And, although the results of this study are a little bit higher than that
expectation, we don’t feel they are egregiously so. We would expect that as the
sample size (number of master portfolios, in our case) increases meaningfully, the
number of successful portfolios would move closer to 68%.
How Could Allocators Use Venncast?
Venncast can be useful in estimating how a portfolio is performing in the current
market environment before the underlying managers are able to report their returns.
For example, let’s go back to the demo portfolio displayed in Exhibit 1 and assume
it’s an allocator’s portfolio. The allocator has returns available for their managers
through the end of 2018. It’s now a month into the new year, and the allocator wants
to know how their portfolio is holding up in January given the strong market reversal.
In particular, they want to understand which factors and managers are driving
portfolio performance in order to anticipate performance questions and/or prioritize
conversations with managers.
The homepage of Venn displays an estimated cumulative return chart for the YTD
2019 period. Since the allocator has provided portfolio returns up until December 31,
2018, Venncast will estimate the portfolio’s performance from that date to today.
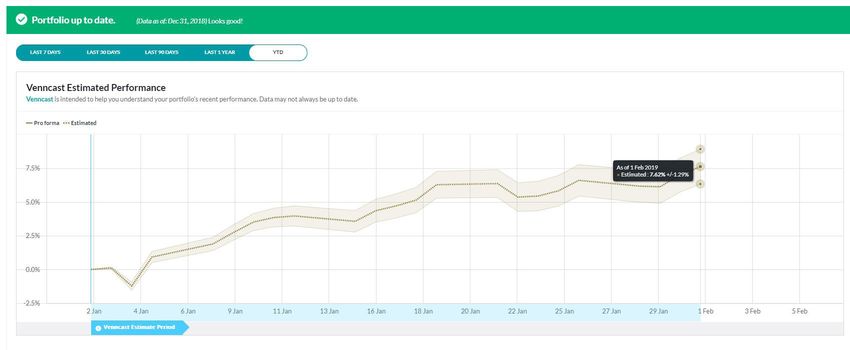
Exhibit 3 | Venncast YTD Estimated Performance for the Demo Portfolio
Source: Venn Analysis, February 2019.
7 According to the empirical rule.
2Venncast estimates that the portfolio has posted positive returns YTD 2019 (through
the end of January) of ~8% with error bands of ±1.3%. An allocator can dig into this
further by exploring attribution from two angles: factors and investments (i.e. funds/
managers).
First, they can analyze this estimated portfolio return from a factor perspective: which
factors are contributing to this ~8% positive performance? To begin this analysis, they’ll
need to understand which factors this portfolio is exposed to. Venn’s factor summary
within pro forma analysis estimates that the portfolio has two meaningfully positive
factor exposures: Equity and Small Cap, as displayed in Exhibit 4.
Exhibit 4 | Demo Portfolio Factor Exposures
Source: Venn Analysis, February 2019. Time period: January 2016 - December 2018, monthly data.
How are these two factors performing YTD? The allocator can use Venn’s Factor
Insights page to explore the daily factor performance. As displayed in Exhibit 5, both
factors have posted positive returns this year. Therefore, it’s likely that the portfolio’s
strong exposures to these factors have contributed positively to the overall portfolio’s
performance this year.
Exhibit 5 | Equity and Small Cap Factor Performance
Source: Venn Analysis, February 2019. Time period: January 1, 2019 - January 31, 2019, daily data.
Venncast provides estimates at the investment level as well, which are displayed
on Venn’s homepage. This allows allocators to analyze which specific funds are
contributing to their portfolio’s positive performance. Exhibit 6 shows the top 5
performing investments in the demo portfolio for the YTD period.
Exhibit 6 | Venncast YTD Estimated Performance for Investments in the Demo Portfolio
Source: Venn Analysis, February 2019.
3Three equity8 funds are at the top of the list: Wells Fargo Emerging Markets, DFA
U.S. Large Cap Value, and DFA U.S. Small Cap Value. This is unsurprising, as these
investments are meaningfully exposed to the Equity factor (as indicated on each
fund’s tearsheet), which, as demonstrated earlier, has done well this year. The
next two funds on the list are commodity-oriented9 funds: DFA Commodity and
Invesco Balanced-Risk Commodity.
Even though there was no Commodities exposure at the aggregate portfolio level,
commodity performance is having an impact at the investment level. An allocator
can look at the Commodities factor on the Factor Insights page to confirm its
positive performance YTD. As shown in Exhibit 7, this factor has also delivered
positive performance so far this year.
Exhibit 7 | Commodities Factor Performance
Source: Venn Analysis, February 2019. Time period: January 1, 2019 - January 31, 2019, daily data.
Finally, there are several investments in the demo portfolio that do not have
available Venncast estimates because of their large residual risk component.10 An
example is the Merger Institutional fund within the Alternatives sub-strategy of
the demo portfolio. While this fund’s risk can partly be explained by factors (as
displayed from the output of the fund’s tearsheet in Exhibit 8), a large component
of the risk is unexplainable by the Two Sigma Factor Lens. This investment, along
with others in the portfolio that have a high residual, may contribute to the ±1.3%
error bands around the portfolio Venncast estimate.
Exhibit 8 | Merger Institutional Factor Contributions to Risk
Source: Venn Analysis, February 2019. Time period: January 2016 - December 2018, monthly.
8 These funds fall within the equity category per the following
sources: Wells Fargo’s Fund Strategy, the DFA U.S. Large Cap
Value Fund’s Morningstar Category (U.S. Fund Large Value), and
the DFA U.S. Small Cap Value Fund’s Morningstar Category (U.S.
Fund Small Value).
In summary, Venncast estimated that the portfolio is expected to have delivered 9 These funds fall within the commodity category per each fund’s
Morningstar Category (Commodities Broad Basket).
~8% (±1.3%) positive returns. Venn expects these returns are coming from 10 Venncast does not provide performance estimates for invest-
ments with residual risk greater than 40%. As with portfolios
with residual risk above that threshold, it is difficult to provide
a reasonable Venncast estimate for such investments because
less of the investment’s risk and return is captured by the Two
Sigma Factor Lens.
4exposures to the Equity and Small Cap factors, which have both delivered positive
performance so far in 2019. Further, the investment-level breakdown indicates
that the funds contributing most to that performance are those that provide
exposure to those factors in addition to Commodities.
Conclusion
To conclude, Venn recognizes that, although Venncast performance estimates
are just that - estimates - they can provide a reasonable method to approximate
performance. It may be a helpful tool in understanding current portfolio
performance, especially for portfolios with investments that report returns on a
less than daily frequency.
Visit Venn today to view your portfolio’s Venncast performance estimate.
5IMPORTANT DISCLAIMER AND DISCLOSURE INFORMATION
This article is property of Two Sigma Investor Solutions, LP or its affiliates (collectively, “Two Sigma”). This article is for your private use and is for
informational and educational purposes only. This article is not an offer to any potential clients or investors for the provision by Two Sigma of
investment management, advisory or any other related services. This article is offered as-is and as-available. Except as required by law, Two Sigma
makes no representations or warranties of any kind concerning the article, including regarding its accuracy or completeness, and the recipient accepts
all risks in relying on this article for any purpose whatsoever.
Links from this website to third-party websites do not imply any endorsement by the third party of this website or of the link; nor do they imply any
endorsement by this firm of the third-party website or of the link.
Two Sigma Investor Solutions, LP (“TSIS”) operates Venn. TSIS is registered with the United States Securities and Exchange Commission (“SEC”) as
an investment adviser under the U.S. Investment Advisers Act of 1940, as amended. Registration with the SEC or with any state securities authority
does not imply a certain level of skill or training. No material on this website should be construed as or relied upon as investment, accounting, legal or
tax advice. This article does not purport to advise you concerning the nature, potential, value or suitability of any particular sector, geographic region,
security, portfolio of securities, transaction, investment strategy or other matter. No consideration has been given to the specific investment needs
or risk-tolerances of any recipient. The recipient is reminded that an investment in any security is subject to a number of risks, including the risk of a
total loss of capital, and that discussion herein does not contain a list or description of relevant risk factors. Past performance is no guarantee of future
results.
No assurance can be given that Venn will help clients achieve their investment or other objectives or prevent or otherwise limit substantial or complete
losses. Increased awareness of or optimization of risk factor exposures is not a guarantee of increased performance or decreased risk. Diversification
and asset allocation may not protect against market risk or loss of principal. Two Sigma makes no representations or warranties that any graph, chart,
formula or other device offered on Venn can in and of itself be used to determine which securities to buy or sell, or when to buy or sell them. You
should make an independent investigation of the information described herein, including consulting your own investment, tax, legal, accounting and
other advisors.
Views reflected in this article reflect significant assumptions and subjective judgments of the author(s) of this document and are subject to change
without notice. While the information herein was obtained from or based upon sources believed by the author(s) to be reliable, Two Sigma has not
necessarily independently verified the information and except as required by law provides no assurance as to its accuracy, reliability, suitability or
completeness. Two Sigma may have market views or opinions that materially differ from those discussed, and may have a significant financial interest in
(or against) one or more of such views or opinions.
This article may include certain statements and that are historic or forward-looking in nature, and are inherently subject to significant business,
economic and competitive uncertainties and contingencies. In addition, forward-looking statements are subject to assumptions with respect to future
business strategies and decisions that are subject to change.
© 2019 Two Sigma. All rights reserved. Two Sigma, the Two Sigma logo, Venn, VennSights and the Venn logo are trademarks of Two Sigma.
Certain data in this article may be derived from third party data and is displayed pursuant to the following notices / disclaimers:
Barra, LLC’s analytics and data (www.barra.com) were used in preparation of this information. Copyright 2019 Barra, LLC. All Rights Reserved.
Certain data derived from data by Global Financial Data, Incorporated.
Any data derived from the Bloomberg Commodity Index is provided under the following notice:
“Bloomberg®” and “Bloomberg Commodity IndexSM” are service marks of Bloomberg Finance L.P. and its affiliates (collectively, “Bloomberg”). The
Bloomberg Commodity IndexSM has been licensed by Bloomberg and UBS Securities LLC (and together with its affiliates, collectively, “UBS”) for use
for certain purposes by TSIS. Neither Bloomberg nor UBS are affiliated with TSIS, and Bloomberg and UBS do not approve or endorse this material, or
guarantee the accuracy or completeness of any information herein, or make any warranty, express or implied, as to the results to be obtained therefrom
and, to the maximum extent allowed by law, neither shall have any liability or responsibility for injury or damages arising in connection therewith.
6Any data derived from Bloomberg data other than the Bloomberg Commodity Index is provided under the following notice:
Source: Bloomberg Index Services Limited. BLOOMBERG® is a trademark and service mark of Bloomberg Finance L.P. and its affiliates (collectively
“Bloomberg”). BARCLAYS® is a trademark and service mark of Barclays Bank Plc (collectively with its affiliates, “Barclays”), used under license.
Bloomberg or Bloomberg’s licensors, including Barclays, own all proprietary rights in the Bloomberg Barclays Indices. Neither Bloomberg nor Barclays
approves or endorses this material, or guarantees the accuracy or completeness of any information herein, or makes any warranty, express or implied,
as to the results to be obtained therefrom and, to the maximum extent allowed by law, neither shall have any liability or responsibility for injury or
damages arising in connection therewith.
7You can also read