Mach 4 Test Results of a Dual-Flowpath, Turbine Based Combined Cycle Inlet - NASA
←
→
Page content transcription
If your browser does not render page correctly, please read the page content below
https://ntrs.nasa.gov/search.jsp?R=20060055388 2019-06-12T08:33:19+00:00Z

    Mach 4 Test Results of a Dual-Flowpath, Turbine Based
                   Combined Cycle Inlet
                            Cindy W. Albertson,1 Saied Emami,2 and Carl A. Trexler3
                                       NASA Langley Research Center
                                       Hampton, Virginia 23681-2199

             An experimental study was conducted to evaluate the performance of a turbine based
        combined cycle (TBCC) inlet concept, consisting of a low speed turbojet inlet and high speed
        dual-mode scramjet inlet. The main objectives of the study were (1) to identify any
        interactions between the low and the high speed inlets during the mode transition phase in
        which both inlets are operating simultaneously and (2) to determine the effect of the low
        speed inlet operation on the performance of the high speed inlet. Tests were conducted at a
        nominal freestream Mach number of 4 using an 8 percent scale model representing a single
        module of a TBCC inlet. A flat plate was installed upstream of the model to produce a
        turbulent boundary layer which simulated the full-scale vehicle forebody boundary layer. A
        flowmeter/back pressure device, with remote actuation, was attached aft of the high speed
        inlet isolator to simulate the back pressure resulting from dual-mode scramjet combustion.
        Results indicate that the inlets did not interact with each other sufficiently to affect inlet
        operability. Flow spillage resulting from a high speed inlet unstart did not propagate far
        enough upstream to affect the low speed inlet. Also, a low speed inlet unstart did not cause
        the high speed inlet to unstart. The low speed inlet improved the performance of the high
        speed inlet at certain conditions by diverting a portion of the boundary layer generated on
        the forebody plate.

                                                Nomenclature

BL        boundary layer
BP        back pressure
CRI       geometric internal contraction ratio
ESP       electronic scanning pressure
H         height
HSC       high speed cowl
HSI       high speed inlet
LSC       low speed cowl
LSI       low speed inlet
M         Mach number
M4BDF     Mach 4 Blow Down Facility
NASP      National Aero-Space Plane
p         pressure
q         dynamic pressure
Re        Reynolds number
T         temperature
TBCC      turbine-based combined cycle
δ*         boundary-layer displacement thickness
θ          cowl angle

1
  Senior Research Engineer, Vehicle Analysis Branch.
2
  Senior Research Engineer, Hypersonic Airbreathing Propulsion Branch.
3
  Senior Research Engineer, Retired.

                                                       1
                               American Institute of Aeronautics and Astronautics
Subscripts
aw adiabatic wall
e boundary-layer edge
FM flowmeter
le leading edge
max maximum
o stagnation
th inlet throat
w wall
1 freestream
I. Introduction
HE Turbine Based Combined Cycle (TBCC) engine1-3 is a multi-flowpath concept that utilizes turbojet
T propulsion from take-off to approximately Mach 4, which is then replaced by the ram/scram propulsion system
for increased velocities. This concept is applicable to hypersonic air-breathing cruise vehicles. As shown
schematically in Fig. 1, the concept consists of low and high speed flowpaths, with the low speed flowpath
incorporating the turbojet and the high speed flowpath incorporating the dual-mode scramjet.
Figure 1. Turbine Based Combined Cycle (TBCC) engine integration.
One of the concerns with TBCC configurations is the potential of the two flowpaths to interfere with each other
during the mode transition phase in which both the low-speed turbojet inlet and the high-speed dual-mode scramjet
inlet are operating simultaneously. In fact, there is little information available in the literature that relates the
combined operation of the high speed inlet to the low speed inlet. Inlet operability and performance are strongly
dependent on specific inlet geometries. Also, a clear definition of the effects of the vehicle boundary layer on the
low speed inlet and thus the high speed inlet is crucial. Therefore, the primary objectives of the present
experimental study are (1) to identify any interactions between the high and low speed inlets, and (2) determine any
high speed inlet performance enhancements or penalties resulting from low speed inlet operation. Secondary
objectives are to determine the contraction ratio capabilities of both inlets, the back pressure capability of the high
speed inlet, the high-speed inlet mass capture, and to support CFD analysis.
II. Description of Experiment
A. Model and Instrumentation
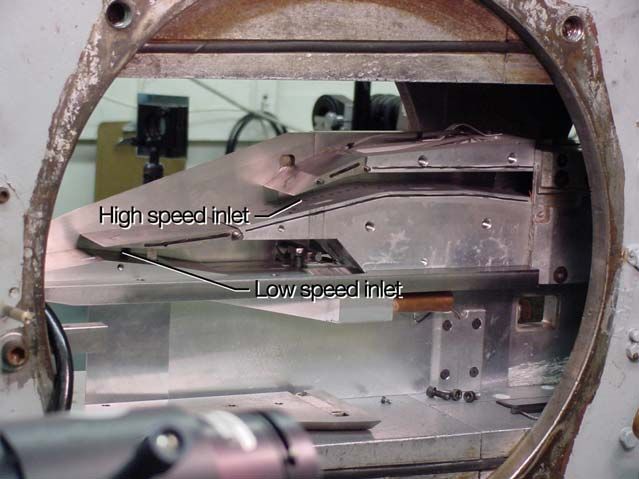
The model (Fig. 2) was an 8-percent scale, two-dimensional TBCC inlet module. Both the high and low speed
inlets incorporated variable geometry cowl flaps that could be remotely actuated during testing. The forebody ramp
located upstream of the low-speed inlet (LSI) was fenced to eliminate flow spillage. A 7.0 in. (17.8 cm) long
boundary-layer plate was installed upstream of the ramp to simulate vehicle forebody boundary-layer effects on inlet
performance. This plate spanned the 9 in. (22.9 cm) width of the M4BDF.
A flowmeter/back pressure device, with remote actuation, was attached aft of the high speed inlet (HSI)
isolator, to simulate combustion-induced back pressure (Fig. 2). This device was instrumented to allow the captured
mass flow through the HSI to be determined. The overall length of the inlet model and flowmeter was 35.6 in. (90.4
cm). The LSI was not back pressured during the tests discussed in this report.
The model instrumentation consisted of 75 static pressure taps, three high frequency pressure transducers, and
two thermocouples. The locations of the instrumentation are shown schematically in Fig. 3. Most of the
2
American Institute of Aeronautics and Astronauticsinstrumentation was located within the HSI because it was the main focus of the study. A photograph of the model
installed in the test section of the M4BDF is shown in Fig. 4. The fence and sidewall were removed to show the low
and high speed inlet flowpaths.
Figure 2. Schematic of TBCC inlet model with flowmeter.
Figure 3. Model instrumentation.
3
American Institute of Aeronautics and AstronauticsFigure 4. Model installed in the NASA Langley Mach 4 Blow Down Facility (fence and sidewall removed).
B. Test Facility and Data Acquisition
The model was tested in the NASA Langley Mach 4 Blow Down Facility (M4BDF).5 The M4BDF has
historically been used as a screening facility for various subscale inlet designs, including inlets developed under
NASA-led hypersonics programs4 (e.g.: NASP, Hyper-X, X-43B, X-43C), inlets designed by industry and academia
(Pratt & Whitney, Rocketdyne, Hampton University), and inlets designed under generic, in-house programs (e.g.:
streamlined-traced inlet, reverse sweep sidewall compression inlet, translating strut inlet, etc.). The M4BDF is a
relatively simple, inexpensive, quick-turnaround test facility that uses ambient-temperature air (nominally 520 °R or
289 K) expanded through a two-dimensional, fixed-geometry nozzle to Mach 4.03 upstream of the inlet. The exit
dimensions of the facility nozzle are 9.0 by 9.0 inches (22.9 by 22.9 cm) and the length of the test section is
approximately 15 inches (38.1 cm). Quartz windows are installed in the walls of the test section to provide visual
access for Schlieren and other nonintrusive techniques. The facility is typically operated at stagnation pressures
ranging from 150 to 250 psia (1.03 to 1.72 MPa), corresponding to freestream static pressures ranging from 0.950 to
1.58 psia (6.55 to 10.9 kPa) and freestream unit Reynolds numbers ranging from 15.75 x 106 ft-1 to 26.25 x 106 ft-1
(51.73 x 10⁶ m-1 to 86.12 x 10⁶ m-1). The freestream static temperature is nominally 122 °R (68 K).
Model static pressure data were acquired using a Pressure Systems Inc. Model 780B Electronically Scanning
Pressure (ESP) system controlled using commercially available software (Labview®)6 running on a Pentium®
processor. Other model data included HSI wall temperature measurements from thermocouples and potentiometer
outputs corresponding to the positions of the high and low speed cowl flaps and flowmeter/back pressure device
flap. These data were all acquired at 1 Hz. A separate high frequency DAS system was used to record the outputs
of the high frequency pressure transducers at 10 kHz. The high frequency data will be discussed in a separate
report.
C. Test Conditions and Procedure
The tests were conducted at a stagnation temperature and pressure of approximately 520 °R (289 K) and 200
psia (1.38MPa), respectively, and a nominal freestream Mach number of 4.03. The model was positioned at 0
degrees angle of attack. The flight conditions duplicated a freestream Mach number of 4.03, freestream dynamic
pressure of 1000 psf (47.9kPa), and vehicle angle of attack of 0 degrees. The local Reynolds number based on LSI
cowl height (full open) was 1.37 x 10⁶ for the inlet tests, compared to 1.49 x 10⁶ for flight. Most of the tests were
conducted with the 7.0 in. (17.8 cm) long boundary layer plate installed upstream of the model. This plate produced
a turbulent boundary layer which nearly matched the scaled flight boundary layer displacement thickness at the low
speed cowl (LSC) entrance plane (Table 1). The boundary layer displacement thicknesses shown in the table were
4
American Institute of Aeronautics and Astronauticscomputed using a flat plate boundary layer computer program7 and transition criteria developed during the NASP
program.8
Tunnel and Model Conditions
M1 To1 Po Re LSC δ* / HLSC δ*/ HLSC
(BL plate) (no plate)
4.03 520 R 200 psia 1.37x10⁶ 5.0 1.4
(289 K) (1.38MPa)
Flight Parameters
M1 To1 q1 Re LSC δ* / HLSC
4.03 520 R 1000 psf 1.49x10⁶ 5.4
(289 K) (47.9kPa)
Table 1. Test conditions compared to flight.
Initially, the wall temperature of the inlet model was at ambient temperature (approximately 530 °R or 294 K),
resulting in a moderately warm wall condition with a wall-to-adiabatic wall temperature ratio (Tw/Taw) of
approximately 1.10. The model wall temperature would decrease during the two minute run to an average
temperature of approximately 510 °R (284 K), resulting in a slight decrease in Tw/Taw to approximately 1.06.
A total of 91 runs were conducted with the TBCC inlet model to assess the influence of the LSI on the HSI
performance, the inlet operability of both the HSI and the LSI, and the backpressure performance of the HSI.
Variables included the HSI throat height (H HSI, th), HSI and LSI cowl angles (θ HSC and θ LSC, respectively), and the
throat height of the flowmeter/back pressure device. The HSI throat height was set prior to testing and ranged from
60% to 100% of the scaled design height. The HSI and LSI cowl angles could be varied during testing using
mechanical actuators. The throat height of the flowmeter/back pressure device for the HSI could also be varied
during testing using a mechanical actuator. Typically only one of the devices would be actuated at a time during a
run, as illustrated in Table 2.
HHSI, th/ H Design BL plate θ LSC θ HSC BP HSI?
installed?
0.60 no fixed varied no
0.60 no varied fixed no
0.60 yes fixed varied no
0.60 yes varied fixed no
0.60 yes fixed fixed yes
0.80 yes fixed varied no
0.80 yes varied fixed no
0.80 yes fixed fixed yes
1.00 yes fixed varied no
1.00 yes varied fixed no
1.00 yes fixed fixed yes
Table 2. Summary of model test parameters.
A test sequence corresponding to a HSI contraction ratio unstart is shown in Fig. 5. This type of test is typically
done to determine inlet operability limits with only minimum backpressure (i.e.: the throat of the backpressure
device is set to just above the choked flow limit. The HSI cowl angle, θ HSC, shown by the pink line, was slowly
increased, resulting in a slowly increasing contraction ratio. The LSI cowl angle was kept constant, as was the
5
American Institute of Aeronautics and Astronauticsflowmeter flap height. At some point, the pressure just upstream of HSI cowl, pHSC, suddenly increased, indicating
that the HSI had unstarted. Note that the pressure just upstream of the LSI cowl, pLSC, remained constant for this
case, indicating that the HSI unstart did not unstart the LSI.
H FM
po
p HSC
θ LSC θ HSC p LSC
0 25 50 75 100
Time, sec.
Figure 5. Variation of key parameters during a typical run (H HSI, th /H design = 0.60, boundary layer plate installed).
III. Results and Discussion
A. Shock Wave Patterns
Inviscid two-dimensional shock wave patterns corresponding to the LSC in the closed and fully opened
positions are shown in Figs. 6(a) and 6(b), respectively, for the design HSI throat height and with the HSC set at 0O
relative to the freestream flow. These patterns were derived using standard oblique shock wave relationships. With
the LSC closed (Fig. 6(a)), the LSC leading edge produces a shock well upstream of the HSC. When the LSC is
opened, it produces a compression corner at the LSC hinge, the angle of which increases with increasing LSC open
angle. The resulting shock wave pattern is shown in Fig. 6(b) with the LSC at the full open position. For this case,
the shock produced at the LSC hinge impacted the HSC near the HSC kink. The competing effects of the LSC
hinge shock and the LSI boundary-layer diversion on the HSI operability is evident in some of the test results to be
presented.
(a) LSC closed.
Figure 6. Inviscid, two-dimensional shock wave patterns (H HSI = H design).
6
American Institute of Aeronautics and Astronautics(b) LSC fully opened.
Figure 6. Concluded.
B. High Speed Inlet Contraction Ratio Unstart
Body centerline pressure distributions illustrating a typical HSI contraction-ratio induced unstart are shown in
Fig. 7. These distributions correspond to a reduced HSI throat height of 60% of the design height, the LSC in the
closed position (θLSC = 0O), and the flowmeter/back pressuring device set at minimum backpressure. During this
test, the HSC rotation angle (θ HSC) was increased, increasing the HSI geometric internal contraction ratio (CRIHSI).
Once CRIHSI was increased past a point, the pressure increased upstream of the HSI, as indicated by the pink
pressure distribution corresponding to t=60 sec. This indicates that the flow was spilling upstream of the HSI and
that the HSI had unstarted. Note that flow spillage from the HSI did not propagate upstream sufficiently to affect
the LSI, as indicated by LSI pressure distributions. The maximum CRIHSI prior to unstart (CRIHSI, MAX) corresponds
to the green pressure distribution (t=57 sec.) in Fig. 7.
The LSI influence on HSI contraction ratio unstart performance is shown by the dark blue diamonds in Fig. 8.
Here, CRIHSI, MAX is plotted as a function of θLSC. When the LSC was opened to 17% of its full open position, the
HSI could be operated at a higher contraction ratio prior to unstart. This effect was the result of the LSI diverting at
least a portion of the low energy boundary layer away from the HSI.
BODY CENTERLINE
CRI HSI
t=21 sec
Increasing
t=31 sec
HHSI,th = 0.60 Hdesign
t=41 sec
LSI closed
t=51 sec
t=57 sec
t=60 sec
p/p1
Distance
Figure 7. Typical body centerline wall static pressure distribution corresponding to a HSI contraction ratio unstart.
(H HSI = 0.60H design, BL plate installed, LSC closed).
7
American Institute of Aeronautics and AstronauticsCRI HSI,MAX
60% HSI design throat height
60% HSI design throat height, no BL plate
80% HSI design throat height
0 5 10 15 20 25 30 35
θ LSC, %max
Figure 8. Effect of LSC open position on HSI contraction ration unstart limits.
The effect of boundary-layer thickness is also indicated in Fig. 8. As expected, a thinner boundary layer
increased the contraction ratio unstart limit, due to lower flow energy loss. The contraction ratio unstart limit was
also higher at the larger HSI throat height of 80% of design, because the HSI captured a larger percentage of flow
outside of the boundary layer. The HSI could not be unstarted at its design throat height, even with the HSC at its
full open position.
C. High Speed Inlet Back-Pressure Induced Unstart
Body centerline pressure distributions illustrating a typical HSI back-pressure induced unstart are shown in Fig.
9. These distributions correspond to a reduced HSI throat height of 60% of the design height and the LSC in the
closed position. During this test, the height of the flowmeter/back pressure device was decreased, resulting in
increasing back pressure to the HSI. Just before unstart (t=160 sec.) the inlet reached its maximum permissible back
pressure. As the flowmeter height continued to decrease (t=162 sec.), the pressure increased upstream of the HSI,
indicating that the HSI had unstarted. Note that flow spillage from the HSI did not propagate forward sufficiently to
affect the LSI, as indicated by the LSI and forebody ramp pressure distributions. In fact, the LSI was not affected by
a HSI unstart during any of the tests.
8
American Institute of Aeronautics and AstronauticsBODY CENTERLINE
Increasing
t=45 sec back pressure
t=85 sec
t=106 sec
t=142 sec
t=160 sec
t=162 sec
p/p1
Distance
Figure 9. Body centerline wall static pressure distribution showing a HSI backpressure-induced unstart.
(H HSI = 0.60H design, BL plate installed, LSC closed).
The effect of the LSI on the HSI performance is shown in Fig. 10. Here the red line and symbols depict the
same pressure distribution shown in Fig. 9, obtained at t = 160 sec. just before the HSI unstarted. When the LSI was
opened to 50% of its full open position, the HSI could be operated at significantly higher pressures prior to unstart.
(Note that the HSI geometric contraction ratio is the same for both cases.) This effect was the result of the LSI
diverting at least a portion of the low energy boundary layer away from the HSI. Additionally, increasing the LSC
angle had the effect increasing the local Mach number upstream of the HSI. This would tend to improve the HSI
operability, at least to the point where the LSC hinge shock (Fig. 6(b)) became an offsetting factor. Results obtained
at the HSI design throat height and contraction ratio are shown in 11. Here, the beneficial effects of the LSI on HSI
backpressure capability is less clear. One interesting observation is that when the LSC was in the full open position,
the LSI would unstart, but did not cause the HSI to unstart, as shown by the red distribution in Fig. 11. The LSI
would unstart at approximately 75% of its fully opened position regardless of HSI operation.
9
American Institute of Aeronautics and AstronauticsBODY CENTERLINE
LSC closed
LSC 50% max open
p/p1
Distance
Figure 10. Body centerline pressure distribution showing effect of LSI cowl open angle on HSI backpressure-
induced unstart limit. (H HSI = 0.60 H design, matched CRI HSI, BL plate installed).
BODY CENTERLINE
LSC closed
LSC 33% max open
LSC 67% max open
LSC fully opened
p/p1
Distance
Figure 11. Body centerline pressure distribution showing effect of LSI cowl open angle on HSI backpressure-
induced unstart limit. (H HSI = H design, CRI HSI = CRI design, BL plate installed).
10
American Institute of Aeronautics and AstronauticsD. High Speed Inlet Performance Summary
The inlet performance can be summarized in terms of the maximum pressure measured in the HSI as a function
of geometric contraction ratio, as shown in Fig. 12(a) for the reduced HSI throat height of 60% of the design height.
Note that as the LSC was opened, the HSI could be operated at higher pressures. This trend could also be observed
when the HSI throat height was 80% of the design height, at least up LSC angles up to 33% the maximum (Fig.
12(b)). Increasing the LSC angle past this point tended to reduce the maximum HSI pressure obtainable prior to
unstart. This is most likely due to the effect of the secondary shock created at the joint of the LSI flap when the LSI
was opened, as shown in the shock wave patterns in Figs. 6(a) and 6(b). At the design HSI throat height (Fig.
12(c)), there was no significant performance benefit gained by opening the LSC. This trend is also indicated in the
pressure distributions shown in Fig. 11.
Pmax / p 1
θ LSC, % max
0%
17%
50%
CRI HSI
(a) H HSI = 0.60 H design.
Figure 12. Maximum HSI pressure as a function of CRI HSI and LSC position.
11
American Institute of Aeronautics and AstronauticsPmax / p 1
θ LSC, %max
0%
17%
33%
67%
100%
CRIHSI
(b) H HSI = 0.80 H design.
pmax /p 1
θ LSC , %max
0%
33%
67%
100%
CRI HSI
(c) H HSI = H design.
Figure 12. Concluded.
12
American Institute of Aeronautics and AstronauticsThe results for all three HSI throat heights are shown in Fig. 13. Note that the best performance in terms of
pmax/p1 was obtained with the HSI throat set at 80% of the design height and with the LSC set at 33% of its full open
position.
pmax /p 1 H HSI,th θLSC
60% 0%
60% 17%
60% 50%
80% 0%
80% 17%
80% 33%
80% 67%
80% 100%
100% 0%
100% 33%
100% 67%
100% 100%
CRI HSI
Figure 13. HSI performance summary
IV. Concluding Remarks
An experimental study was conducted to evaluate the performance of a turbine based combined cycle
(TBCC) inlet concept, consisting of a low speed turbojet inlet and high speed dual-mode scramjet inlet.
The main objectives of the study were (1) to identify any interactions between the low and the high speed
inlets during the mode transition phase in which both inlets are operating simultaneously and (2) to
determine the effect of the low speed inlet operation on the performance of the high speed inlet. Tests were
conducted at a nominal freestream Mach number of 4 using an 8 percent scale model representing a single
module of a TBCC inlet. A flat plate was installed upstream of the model to produce a turbulent boundary
layer which simulated the full-scale vehicle forebody boundary layer. A flowmeter/back pressure device,
with remote actuation, was attached aft of the high speed inlet isolator to simulate the back pressure
resulting from dual-mode scramjet combustion. Results indicate that the inlets did not interact with each
other sufficiently to affect inlet operability. Flow spillage resulting from a high speed inlet unstart did not
propagate far enough upstream to affect the low speed inlet. Also, when the LSC was opened more than
75% of its full open position, the LSI would unstart, but did not cause the HSI to unstart.
The net result of the dual flowpath system is that the LSI was beneficial to the operability of the HSI
for HSI throat heights of 60% and 80% of the original design height. This was due to the removal of the
boundary layer which outweighed the effect of the secondary shock created at the joint of the LSC flap
when the LSC was opened to certain positions. The Mach number ahead of the HSI also increased, as the
LSC was opened, which tended to increase the contraction ratio limit of the HSI. At the design HSI throat
13
American Institute of Aeronautics and Astronauticsheight, the boundary layer was a smaller percentage of the inlet height, resulting in negligible overall
benefit. Overall, the best performance in terms of maximum back pressure was obtained with the HSI
throat set at 80% of the design height and with the LSC set at 33% of its full open position.
Acknowledgments
The authors would like to thank Mr. Lloyd Wilson for preparing the model for testing and operating
the M4BDF. The authors would also like to thank Mr. Roger Jones for preparing the vehicle and model
figures used in this report.
References
1
Snyder, L. E., Escher, D. W., DeFrancesco, R. L., Gutierrez, J. L., and Buckwalter, D. L., “Turbine
Based Combination Cycle (TBCC) Propulsion Subsystem Integration,” 40th AIAA/ASME/SAE/ASEE Joint
Propulsion Conference and Exhibit, July 11-14, 2004, Fort Lauderdale, Florida, AIAA 2004-3649.
2
Marshall, A. W., Gupta, A. K., Lewis, M. J., and Lavelle, T., “Critical Issues in TBCC Modeling,”
th
40 AIAA/ASME/SAE/ASEE Joint Propulsion Conference and Exhibit, July 11-14, 2004, Fort Lauderdale,
Florida, AIAA 2004-3827.
3
Clough, J. A. and Lewis, M. J., “Comparison of Turbine-Based Combined-Cycle Engine Flowpaths,”
th
12 AIAA International Space Planes and Hypersonic Systems and Technologies Conference, December
15-19, 2003, Norfolk, Virginia, AIAA 2003-6932.
4
Moses, P. L., Rausch, V. L., Nguyen, L. T. and Hill, J. R., “NASA Hypersonic Flight
Demonstrators – Overview, Status, and Future Plans,” Acta Astronautica [online journal], Vol. 55 (2004),
pp. 619-630, URL: http://www.sciencedirect.com.
5
Rodi, P. E., Emami, S., and Trexler, C. A., “Unsteady Pressure Behavior in a Ramjet/Scramjet Inlet,”
Journal of Propulsion and Power, Vol. 12, No. 3, May – June 1996, pp. 486-493.
6
Labview, Data Acquisition Software Package, National Instruments, Austin TX, URL:
http://www.ni.com/labview/.
7
Trexler, C. A., and Smart, M, K., “Test and Evaluation of X-43C Inlet Designs at a Simulated Mach
5 Flight Condition,” 2003 Joint JANNAF CS/APS/PSHS/MSS Meeting, Colorado Springs, Colorado,
December 1-5, 2003.
8
Lau, K. Y., and Vaporean, C. N., “Parametric Boundary Layer Transition Study for NASP-Like
Configurations Using Linear Stability Analyses,” NASP Mid-Term Technology Review, Paper 283,
Monterey, CA, April 1992.
14
American Institute of Aeronautics and AstronauticsYou can also read