First Quarter 2019 - Investors
←
→
Page content transcription
If your browser does not render page correctly, please read the page content below
First Quarter 2019
May 1, 2019
Earnings Conference Call Supplement
(Unaudited Results)

Ted Doheny, President & CEO
Bill Stiehl, SVP & CFO
Lori Chaitman, VP Investor Relations
                                       1
Safe Harbor and Regulation G Statement This presentation contains “forward-looking statements” within the meaning of the safe harbor provisions of the Private Securities Litigation Reform Act of 1995 concerning our business, consolidated financial condition and results of operations. Forward-looking statements are subject to risks and uncertainties, many of which are outside our control, which could cause actual results to differ materially from these statements. Therefore, you should not rely on any of these forward-looking statements. Forward-looking statements can be identified by such words as “anticipate,” “believe,” “plan,” “assume,” “could,” “should,” “estimate,” “expect,” “intend,” “potential,” “seek,” “predict,” “may,” “will” and similar references to future periods. All statements other than statements of historical facts included in this press release regarding our strategies, prospects, financial condition, operations, costs, plans and objectives are forward-looking statements. Examples of forward-looking statements include, among others, statements we make regarding expected future operating results, expectations regarding the results of restructuring and other programs, anticipated levels of capital expenditures and expectations of the effect on our financial condition of claims, litigation, environmental costs, contingent liabilities and governmental and regulatory investigations and proceedings. The following are important factors that we believe could cause actual results to differ materially from those in our forward looking statements: global economic and political conditions, currency translation and devaluation effects, changes in raw material pricing and availability, competitive conditions, the success of new product offerings, consumer preferences, the effects of animal and food-related health issues, pandemics, changes in energy costs, environmental matters, the success of our restructuring activities, the success of our financial growth, profitability, cash generation and manufacturing strategies and our cost reduction and productivity efforts, changes in our credit ratings, the tax benefit associated with the Settlement agreement (as defined in our most recent Annual Report on Form 10-K), regulatory actions and legal matters, and the other information referenced in the “Risk Factors” section appearing in our most recent Annual Report on Form 10-K, as filed with the Securities and Exchange Commission, and as revised and updated by our Quarterly Reports on Form 10-Q and Current Reports on Form 8-K. Any forward-looking statement made by us is based only on information currently available to us and speaks only as of the date on which it is made. We undertake no obligation to publicly update any forward looking statement, whether written or oral, that may be made from time to time, whether as a result of new information, future developments or otherwise. Our management uses non-U.S. GAAP financial measures to evaluate the Company’s performance, which exclude items we consider unusual or special items. We believe the use of such financial measures and information may be useful to investors. We believe that the use of non-U.S. GAAP measures helps investors to gain a better understanding of core operating results and future prospects, consistent with how management measures and forecasts the Company's performance, especially when comparing such results to previous periods or forecasts. Please see Sealed Air’s May 1, 2019 earnings press release for important information about the use of non-U.S. GAAP financial measures relevant to this presentation, including applicable reconciliations to U.S. GAAP financial measures. Information reconciling forward-looking U.S. GAAP measures to non-U.S. GAAP measures is not available without unreasonable effort. Website Information We routinely post important information for investors on our website, www.sealedair.com, in the "Investors" section. We use this website as a means of disclosing material, non-public information and for complying with our disclosure obligations under Regulation FD. Accordingly, investors should monitor the Investors section of our website, in addition to following our press releases, SEC filings, public conference calls, presentations and webcasts. The information contained on, or that may be accessed through, our website is not incorporated by reference into, and is not a part of, this document. © 2019 Sealed Air 2
Q1 2019 Financial Results
   Solid performance against macro headwinds and tough YoY comparable

   Q1 2019 Adj. EPS $0.59 increased 16%
        Earnings Growth: Adj. EBITDA $216 M; +5% as reported, +10% constant dollar
             Margins expanded 130 bps to 19.4%
             Share count 155 M vs 165 M prior year; +$0.04 positive impact to Adj. EPS
             Exiting Q1 2019 with Net Debt of $3.3B and Net Leverage Ratio of 3.7x
        Sales Growth +3% in constant dollar: Food Care +3% and Product Care +2%
             Positive price across all regions and both divisions
             Volume excluding acquisition down 1%
        Reinvent SEE transformation and savings on track

                                                Reaffirms 2019 outlook

© 2019 Sealed Air                                                                        3
The 4P’S ℠ of Reinvent SEE ™
… Performance, People, Products, Processes & Sustainability
Grow faster than the markets we serve
… with leading brands & packaging solutions for Fresh Food & e-Commerce
… grow market share, move into adjacent markets with greater speed & efficiency
… accelerate returns on highly differentiated innovations
SEE Operational Excellence … reinventing how we innovate to solve
Double Speed to Market on Innovations
Channel Optimization
Customer Service Enhancements
Product Cost Efficiency
SG&A Productivity
Increase Operational Leverage (P/G) to accelerate earnings power
… target operating leverage above 40% per year
… three year restructuring program to drive total annualized savings of ~ $225 M by the end of 2021
… costs of new program estimated to be $190 M to $220 M, with less than three year payback
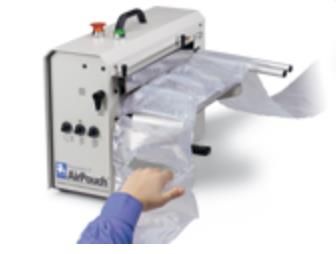
© 2019 Sealed Air 4Acquisition of Automated Packaging Systems (APS)
Expands Automation, Technical Service and Sustainable Packaging Offerings
Business Overview Service & Parts, 8%
Innovative solutions leader, automated equipment, materials and services
Equipment,
Invented Autobag ® bagging machines and pre-opened bags on a roll, three 16%
recycled film solutions under the EarthAware ® brand
Sales
Employs more than 1,200 people, serves customers in over 60 countries and
operates 7 manufacturing sites in the U.S. and U.K. Materials,
76%
Generated sales of $290M in 2018, an increase of 10% YoY
Transaction Overview
Rest of World, 3%
Purchase price of $510M on a cash and debt free basis
SEE to fund with cash on hand and credit facilities Europe, 22%
Expected close early Q3 2019, subject to reg. approval and closing conditions
Plan to update FY 2019 outlook on Q2 earnings call, tentatively July 31, 2019
NAM, 75%
© 2019 Sealed Air Source: Automated Packaging Systems presentations 5APS Acquisition Aligns with Reinvent SEE Strategy
Expands Automation, Technical Service and Sustainable Packaging Offerings
Speed to Market on Innovations …
Highly complementary and additive capabilities to SEE
Expertise in engineering, automation technology and sustainability
Innovation supported by robust patent portfolio
Strengthens sustainability portfolio
Channel Optimization & Customer Service Enhancements …
Access to additional growth opportunities in e-Commerce, fulfillment and food markets
APS’s best-in-class technical service expertise and equipment-service-materials-solutions model
Product Cost Efficiency & Productivity Improvements …
Expect cost synergies, resulting from supply chain and operational efficiencies
Transaction expected to be accretive to Adjusted EBITDA in 2019
Broadens portfolio to drive growth in e-commerce, fulfillment and food packaging markets
© 2019 Sealed Air 6APS Acquisition Aligns with our 4P’S ℠ of Reinvent SEE ™
High-Growth Automation Capabilities and Disciplined Corporate Culture
Performance Track record of growth and innovation ✓ ✓
People High performance culture ✓ ✓
Products Comprehensive portfolio with systems solutions approach ✓ ✓
Processes Operational excellence from innovate to solve ✓ ✓
Sustainability Organizational commitment to societal impact ✓ ✓
Complements Sealed Air’s Capabilities and Core Strengths
© 2019 Sealed Air 7Q1 2019 YoY Regional Sales Performance
Constant dollar +3%, growth in all regions excluding EMEA
Europe,
* North Middle East Asia South
America & Africa Pacific America
As reported % Change 2% -9 % -3 % -7 %
Constant Dollar % Change 3% -1 % 3% 25 %
% of Sales 59 % 21 % 15 % 5%
Q1 2019 Net Sales: $1.1 B
As reported % Change: - 2%
Constant Dollar % Change: + 3 %
© 2019 Sealed Air * North America includes U.S. Canada, Mexico and Central America 8Q1 2019 Sales Trends
Favorable price and acquisition sales offset by volume and FX headwinds
As Reported Growth (%) Constant $ Growth (%)
Food Care (2) Food Care 3
Product Care (0.5) Product Care 2
Sealed Air (2) Sealed Air 3
* North America 2 * North America 3
EMEA (9) EMEA (1)
Asia Pacific (3) Asia Pacific 3
South America (7) South America 25
Sealed Air (2) Sealed Air 3
** Volume (%) Excl. Acq. Price (%)
Food Care 0.4 Food Care 3
Product Care (4) Product Care 1
Sealed Air (1) Sealed Air 2
* North America (2) * North America 1
EMEA (1) EMEA 1 * North America includes U.S.
Asia Pacific 0.3 Asia Pacific 0.1 Canada, Mexico and Central America
South America (0.1) South America 25 ** Volume includes mix impact
© 2019 Sealed Air
Sealed Air (1) Sealed Air 2 9Total Company Q1 2019 Net Sales & Adj. EBITDA
In constant dollar, Adj. EBITDA up 10% on 3% sales growth
($ millions) -2% Net Sales * Volume includes mix impact
25 26 Reported U.S. GAAP Measures,
Continuing Operations
1,131 Q1-19 Net Earnings: $64 M
-16 1,113 Q1-18 Net Loss: ($208 M)
-53
Constant Dollar Growth: 3 %
Q1 2018 Price * Volume Acquisition FX Q1 2019
+5% Adj. EBITDA
13
22
-7 216
205 -7 -10
Constant Dollar Change: 10 %
Q1 2019 Margin: 19.4 %
Q1 2018 Margin: 18.1 %
Q1 2018 Price/Cost * Volume Restructuring Operating Costs FX Q1 2019
Spread Savings (incl. income
from acquisition)
© 2019 Sealed Air 10Food Care Q1 2019 Net Sales & Adj. EBITDA
In constant dollar, Adj. EBITDA up 12% on 3% sales growth
($ millions) -2% Net Sales * Volume includes mix impact
21 3
696
680
-40
Constant Dollar Growth: 3 %
Q1 2018 Price * Volume FX Q1 2019
+6% Adj. EBITDA
9
17 1
-11 143
135 -8
Constant Dollar Change: 12 %
Q1 2019 Margin: 21.0 %
Q1 2018 Margin: 19.3 %
Q1 2018 Price/Cost * Volume Restructuring Operating FX Q1 2019
Spread Savings Costs
© 2019 Sealed Air 11Product Care Q1 2019 Net Sales & Adj. EBITDA
Volume decline due to tough YoY comparable and a more challenging industrial sector
($ millions) -0.5% Net Sales * Volume includes mix impact
26
435 4
433
-13
-19
Constant Dollar Growth: 2 %
Q1 2018 Price * Volume Acquisition FX Q1 2019
-4% Adj. EBITDA
4
4
78
-2 75
-7 -2
Constant Dollar Change: -1 %
Q1 2019 Margin: 17.3 %
Q1 2018 Margin: 18.0 %
Q1 2018 Price/Cost * Volume Restructuring Operating Costs FX Q1 2019
Spread Savings (incl. income
from acquisition)
© 2019 Sealed Air 12Free Cash Flow, Consolidated
Reaffirming $250 M Free Cash Flow guidance for full year 2019
($ millions) Three Months Ended March 31,
Cash Flow 2019 2018
Adjusted EBITDA 216 205
Interest Payments, Net (40) (38)
Payments for Diversey and stranded costs - (14)
Restructuring and Associated Payments (25) (3)
Tax Payments (13) (19)
Net Change in Working Capital(1) (31) (40)
Other Assets/Liabilities (42) (125)
Cash Flow Provided by Operations 65 (34)
Capital Expenditures (49) (43)
Free Cash Flow, Consolidated(2) 16 (77)
(1) Includes cash used in/provided by trade receivables, inventory, net and accounts payable
(2) Free Cash Flow for the three months ended March 31, 2018 was use of cash of ($63)
© 2019 Sealed Air million, excluding $14 million payment related to the sale of Diversey and Stranded Costs 13Total Company 2019 Financial Outlook
Solid Q1 and Reinvent SEE on track
Net Sales Adj. EBITDA Adj. EPS Free Cash Flow
~ $4.8 B $925 M - $945 M $2.65 - $2.75 ~ $250 M
As Reported: ~ 2 % As Reported: 4 – 6 % D&A: ($175 M) Capex: ($200 M)
Unfavorable Currency: ($130 M) Unfavorable Currency: ($25 M) Int. Exp., Net: ($190 M) Int. Payments, Net: ($190 M)
Food Care: ($100 M) Food Care: ($20 M) Adj. Tax Rate: 26 % Tax Payments: ($130 M)
Product Care: ($30 M) Product Care: ($5 M)
Constant Dollar Growth: ~ 5 % Diluted Shares: 156 M Restructuring: ($115 M)
Food Care: ~ 4 %
Product Care (incl. Acq.): ~ 5.5 %
Reaffirms 2019 outlook
© 2019 Sealed Air Note: Adjusted EBITDA, Adjusted EPS, Free Cash Flow, D&A and Tax Rate guidance excludes the impact of special items 14The 4P’S ℠ of Reinvent SEE ™
… Performance, People, Products, Processes & Sustainability
Capitalize on rapidly growing fresh food, e-commerce markets and high-value brands
Create profitable growth with differentiated and sustainable innovations
Drive operational excellence culture to world-class performance for margin expansion
Leverage our high performance culture
Generate higher returns and deliver long-term shareholder value
We solve our customers’ most critical packaging challenges with innovative solutions
that leave our world, environment, and communities better than we found them
© 2019 Sealed Air 15© 2019 Sealed Air 16
© 2019 Sealed Air 17
U.S. GAAP Summary & Reconciliations

                                                                                            Three Months Ended Mar. 31,
                                                                                                2019            2018
                    Net Sales                                                               $1.1 billion      $1.1 billion
                    Pre-tax Earnings from Continuing Operations                             $95 million     $114 million
                    Net Earnings/(Loss) From Continuing Operations                          $64 million    $(208) million
                    EPS From Continuing Operations                                               $0.41           $(1.25)
                    Effective Tax Rate                                                          32.1%            283.3%
                    Operating Cash Flow                                                     $65 million     $(34) million

                                                                                            Three Months Ended Mar. 31,
                    ($ millions)
                                                                                                2019            2018
                    U.S. GAAP Net earnings (loss) from continuing operations                     64.3            (208.0)
                    Interest expense, net                                                        44.9               42.0
                    Income tax provision                                                         30.4              321.5
                    Depreciation and amortization                                                41.1               40.4
                    Depreciation and amortization adjustments                                    (0.9)              (0.2)
                      Special items
                      Restructuring charges                                                       7.4                8.6
                      Other restructuring associated costs                                       16.7                2.2
                      Foreign currency exchange loss due to highly inflationary economies         0.8                 —
                      Charges related to acquisition and divestiture activity                     3.7               10.8
                      Gain from class-action litigation settlement                                 —              (12.7)
                      Other Special Items                                                         7.4                0.2
                    Pre-tax impact of Special Items                                              36.0                9.1
                    Non-U.S. GAAP Total Company Adj EBITDA from continuing operations           215.8             204.8
© 2019 Sealed Air                                                                                                            18
U.S. GAAP Summary & Reconciliations
Three Months Ended Mar. 31,
2019 2018
Net Diluted Net Diluted
($ millions, except per share data)
Earnings EPS (Loss)Earnings EPS
U.S. GAAP net earnings (loss) and
$64.3 $0.41 $(208.0) $(1.25)
diluted EPS from continuing operations
Special Items 27.9 0.18 293.4 1.76
Non-U.S. GAAP Adjusted net earnings
and adjusted diluted EPS from $92.2 $0.59 $85.4 $0.51
continuing operations
Weighted average number of common
155.4 165.3
shares outstanding - Diluted
Mar. 31, 2019
($ millions)
(unaudited)
Total debt $3,567.5
Less: cash and cash equivalents (236.0)
Net Debt $3,331.5
© 2019 Sealed Air 19U.S. GAAP Summary & Reconciliations
North America includes U.S. Canada, Mexico and Central America
2018 Net Sales by Region
($ millions) * North Total
EMEA South America Asia Pacific
Three Months Ended America Company
Mar. 31 639.0 257.9 59.0 175.1 1,131.0
Jun. 30 660.2 262.4 55.4 177.2 1,155.2
Sep. 30 703.6 247.0 55.6 180.0 1,186.2
Dec. 31 732.1 271.2 59.5 197.5 1,260.3
Twelve Months Ended
2,734.9 1,038.5 229.5 729.8 4,732.7
Dec. 31, 2018
© 2019 Sealed Air
* North America includes U.S. Canada, Mexico and Central America 20You can also read