Analysts' Conference Presentation - February 2021 - DISCLAIMER This presentation contains selected, preliminary and unaudited financial figures ...
←
→
Page content transcription
If your browser does not render page correctly, please read the page content below
Analysts‘ Conference Presentation
February 2021

 DISCLAIMER
 This presentation contains selected, preliminary and unaudited financial figures regarding fiscal year 2020
ELMOS CORPORATE OVERVIEW
           Corporate Highlights                                   Sales Breakdown FY 2020                Financial Highlights FY 2020

   ~6 Elmos ICs
      on average in every new car
                                                                         Automotive focused:
                                                                             Sales by industry   233 million Euro sales
                                                                                                     in fiscal year 2020
                                                            Non-automotive
                                                                               15%
         product segments:                                                                               percent research & development ratio
     6   Ranging, Optical, Sensor ICs, Motor Control,
         Lighting, Safety/Power/Custom ICs
                                                                                                   20    record spending in R&D activities despite
                                                                                                         COVID-19 pandemic
                                                                                         85%
                                                               Automotive

   16 locations worldwide incl. 7 R&D centers
      HQ located in Dortmund, Germany                                  Global presence:
                                                                                                   40 million Euro net cash
                                                                                                      underlining Elmos’ strong financial position
                                                                         Sales by region

                                                                         Rest of World
                                                                   US
 >35 years experience in analog
     mixed signal IC solutions
                                                                          9%
                                                                         2%
                                                                                           EU      78 percent equity ratio
                                                                                                      emphasizing Elmos’ financial solidity

                                                                                         46%

                                                                       43%

1,150    employees thereof 350+ product
         developers & engineers                         Asia/Pacific                             746 Euro million market capitalization
                                                                                                     (as of Feb. 12, 2021)
                                                                                                                                                     2
ELMOS INNOVATIVE SOLUTIONS FOR GLOBAL MEGA TRENDS
Leading innovator in future mobility
 #1 FOR ULTRASONIC ICS
 #1 FOR HVAC FLAPS
 #1 FOR GESTURE CONTROL
 #1 FOR AMBIENT AND REAR LIGHT

                                          USER EXPERIENCE   ADAS & AUTONOMOUS DRIVING   SAFETY

        COMFORT                        ELECTRIFICATION                 LIGHTING
                                                                                                 3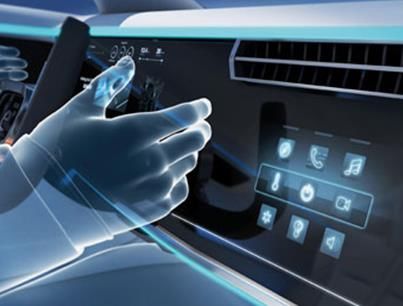
HIGHLIGHTS OF FISCAL YEAR 2020
The year 2020 was dominated by managing the effects of the COVID-19 pandemic…

         Q1 2020                                        Q2 2020                                      Q3 2020                              Q4 2020
Elmos presents new dynamic LED rear      Start of short-time work program at         Introduction of voluntary severance       Suspension of short-time work as a
light applications at CES in Las Vegas   Dortmund fab                                program for German employees              result of increasing orders in Q4

First COVID-19 hygiene and protective    Management Board and senior                 Conversion into a European stock          Q3 results reflect impact of pandemic,
measures are implemented at all          executives voluntarily waive a part of      corporation (Societas Europaea – SE)      but significant recovery with very strong
Elmos locations                          their remuneration                          completed, strengthening the              growth in Q4 expected
                                                                                     international positioning of Elmos
Announcement not to extend the           First virtual Annual General Meeting                                                  Management Board contract of Dr. Jan
cooperation with the Fraunhofer          approves all agenda items                   Despite slight improvements of COVID-     Dienstuhl (CSO) extended until 2023
Institute after June 2020                                                            cases in Germany and other countries
                                         Expansion of short-time work to             during the summer, all protective         Extension of protective measures in
Travel ban, meeting & visitor            further non-productive areas                measures maintained at Elmos              connection with the second hard
restrictions; closure of social areas                                                                                          lockdown in Germany and other
within Elmos                             Additional solidarity contribution by the   Q2 results continue to be impacted by     countries around the globe
                                         Management Board and senior                 the COVID-19 pandemic
Extensive remote-office regulation       executives                                                                            Purchase agreement signed to acquire
                                                                                     Elmos presents solutions for ambient      Dortmund based engineering provider
New foundry cooperation                                                              lighting and gesture control at the DVN   Online Engineering GmbH
with Samsung                                                                         Car Smart Interior Online Expo
                                                                                                                               Dr. Anton Mindl retires after 15 years
Elmos buys back 7.7% of the                                                                                                    as CEO of Elmos at the end of the year;
share capital as a result of the                                                                                               Dr. Arne Schneider to become the new
successful public buyback offer                                                                                                CEO as of Jan. 01, 2021
                                                                                                                                                                     4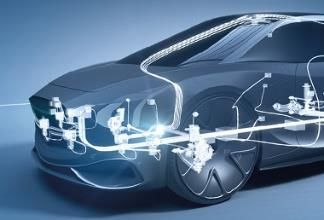
HIGHLIGHTS OF FISCAL YEAR 2020
…but also many important strategic milestones have been achieved.
Q1 2020 Q2 2020 Q3 2020 Q4 2020
Elmos presents new dynamic LED rear Start of short-time work program at Introduction of voluntary severance Suspension of short-time work as a
light applications at CES in Las Vegas Dortmund fab program for German employees result of increasing orders in Q4
First COVID-19 hygiene and protective Management Board and senior Conversion into a European stock Q3 results reflect impact of pandemic,
measures are implemented at all executives voluntarily waive a part of corporation (Societas Europaea – SE) but significant recovery with very
Elmos locations their remuneration completed, strengthening the strong growth in Q4 expected
international positioning of Elmos
Announcement not to extend the First virtual Annual General Meeting Management Board contract of Dr. Jan
cooperation with the Fraunhofer approves all agenda items Despite slight improvements of COVID- Dienstuhl (CSO) extended until 2023
Institute after June 2020 cases in Germany and other countries
Expansion of short-time work to during the summer, all protective Extension of protective measures in
Travel ban, meeting & visitor further non-productive areas measures maintained at Elmos connection with the second hard
restrictions; closure of social areas lockdown in Germany and other
within Elmos Additional solidarity contribution by Q2 results continue to be impacted by countries around the globe
the Management Board and senior the COVID-19 pandemic
Extensive remote-office regulation executives Purchase agreement signed to acquire
Elmos presents solutions for ambient Dortmund based engineering provider
New foundry cooperation lighting and gesture control at the DVN Online Engineering GmbH
with Samsung Car Smart Interior Online Expo
Dr. Anton Mindl retires after 15 years as
Elmos buys back 7.7% of the CEO of Elmos at the end of the year;
share capital as a result of the Dr. Arne Schneider to become the new
successful public buyback offer CEO as of Jan. 01, 2021
5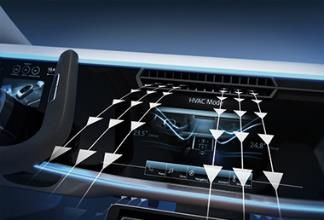
MARKET ENVIRONMENT: STRONG DECLINE DUE TO PANDEMIC
Automotive Market
1
Light vehicle production in million units (IHS)
-5,5%
-16,2%
94,1
89,0
74,5
2018 2019 2020p
Regional market development YoY 2020/2019:
Europe (-22%)
China (-4%)
North America (-20%)
1IHS Light Vehicle Production (January 2021) 6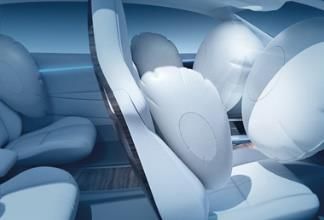
FY 2020: SALES AT THE UPPER END OF GUIDANCE RANGE
1
Yearly sales (in million Euro) & gross margin (in %) Quarterly sales (in million Euro) & gross margin (in %)
Gross margin
Continuing operations +68.0%
Discontinued operations 294.8 68.7
277.6 21.4 64.2
250.4 23.7 58.8
228.6 46.4% 232.6
20.4
21.7
45.2%
43.9%
43.7% 40.9
42.3% 42.0%
40.6%
273.4
253.9 39.8%
230.1
206.9
29.1%
2016 2017 2018 2019 2020 Q1 2020 Q2 2020 Q3 2020 Q4 2020
FY 2020 sales performance is at the upper end of the given guidance As expected, we benefited from the recovery of the automotive market
range (between 227 and 233 million Euro) and strong IC demand in the last quarter of the year
FY 2020 sales decrease 14.9%2 due to the COVID-19 pandemic The ratio of orders received for the next three months to sales over the
Decrease in gross margin is reflecting the lower fixed costs absorption past three months (book-to-bill) was well above one at the end of the
as a result of the under-utilization in production due to the lower sales reporting period
volume
1Gross margins in years 2016 to 2019 relate to continuing and discontinued operations; in year 2020 to continuing operations only.
2Sales decrease refers to continuing operations only.
7FY 2020: EBIT ALSO AT THE UPPER END OF GUIDANCE RANGE
1
Yearly EBIT (in million Euro) & EBIT margin (in %) Quarterly EBIT (in million Euro) & EBIT margin (in %)
Reported EBIT
97.3m Euro
51.0 8.9
45.3 7.1
38.4 3.2 13.0%
11.0%
18.4%
15.3% 15.4% 5.4%
23.1
-25.7%
10.1%
8.7
-10.5
3.7%
Q1 2020 Q2 2020 Q3 2020 Q4 2020
2016 2017 2018 20192 2020
EBIT margin achieved our mid-term target level in 2017, 2018 and 2019 Fast turn-around in Q4 2020 as production volumes have significantly
2020 EBIT was heavily impacted by the sales decrease and lower fixed increased after the crisis-related low-point in Q3 2020
costs absorption Q4 2020 EBIT margin of 13% is approaching pre-crisis performance
The implemented operational measures such as short-time work, levels
voluntary salary cuts and additional savings prevented a further
deterioration of our profitability
1EBIT and EBIT margins in years 2016 to 2019 relate to continuing and discontinued operations; in year 2020 to continuing operations only.
2Operational EBIT/EBIT margin without consideration of the result from the sale of the subsidiary SMI and without deduction of the restructuring expenses for the termination of the cooperation with the Fraunhofer Institute IMS.
8CAPEX AND R&D EXPENSES
1 2
CAPEX (in million Euro & in % of sales) R&D expenses (in million Euro & in % of sales)
43.6 47.7
41.4 44.6
37.2
36.0 36.0
33.8 20.5%
23.2
18.8 15.7%
14.9% 14.9% 14.8% 15.1%
13.5% 13.0%
8.1%
10.1%
2016 2017 2018 2019 2020 2016 2017 2018 2019 2020
Capex for FY 2020 amounted to only 18.8 million Euro or 8.1% of sales To further strengthen our innovative leadership we have not reduced
Investments in new equipment have been restricted due to the crisis our R&D activities during the COVID-19 pandemic
Despite travel bans and limited customer meetings, we could once
again achieve a very good result for our design wins in 2020
1Capital expenditures for intangible assets and property, plant and equipment less capitalized development expenses.
2R&D expenses in years 2016 to 2019 relate to continuing and discontinued operations; in year 2020 to continuing operations only.
9CASH FLOW
1
Operating cash flow (in million Euro) Adjusted free cash flow (in million Euro)
Supported by
SMI sale
48.4
45.6 76.9
37.9
33.5
27.3
9.1
3.6
-3.3
-5.2
2016 2017 2018 2019 2020 2016 2017 2018 2019 2020
The cash flow from operations in FY 2020 declined mainly due to the Despite the overall challenging business development with declining
lower income sales and lower income levels, we could achieve a positive adjusted free
cash flow in FY 2020
The adjusted free cash flow in the previous year was significantly
positive due to the cash inflow from the SMI transaction
1Cash flow from operating activities less capital expenditures for/plus disposal of intangible assets and property, plant and equipment (incl. payments from disposals of consolidated companies and payments for shares) 10EQUITY AND NET CASH
Shareholders’ equity (in million Euro & in % of total assets) Net cash (in million Euro)
Supported by Influenced by Supported by Influenced by
SMI sale share buyback SMI sale share buyback
339.7 74.3
310.2
266.6
240.1 55.4
231.6
40.2
74.0% 77.3% 78.4% 33.2
71.3% 72.2%
16.9
2016 2017 2018 2019 2020 2016 2017 2018 2019 2020
The further increase of the equity ratio to 78% at the end of FY 2020 Since more than 10 years now, Elmos is able to achieve a net cash
underlines the financial solidity of Elmos position at year-end
Despite the massive impacts of the global pandemic, the equity and Thanks to this strong financial position, we were able to successfully
financial base of Elmos is stronger than ever complete a buy-back of 7.7% of our own shares in March 2020, which
was the main reason for the reduction in net cash year-over-year,
holding 9.9% at the end of year
11GUIDANCE FOR 2021
Automotive Market Outlook Elmos 2021 Guidance (as of February 17, 2021)
1
Light vehicle production in million units (IHS)
Q1 2021
Sales: 76 ± 3 million Euro
-16,2% +13,7% EBIT: 14.5% ± 1.5%-points
89,0 84,7 Ø exchange rate: 1.20 EUR/USD
74,5
Full Year 2021
Significant increase in sales and EBIT compared to the previous year
Capital expenditures significantly higher year on year
2019 2020p 2021e Positive adjusted free cash flow above previous year expected
Est. regional market development YoY 2021/2020:
Europe (+14%) Notes to guidance 2021:
China (+6%) The 2021 guidance is based on relevant market and industry forecasts, which are
associated with certain risks due to the ongoing COVID 19 pandemic and are also
North America (+25%) likely to be subject to greater fluctuations over the course of the year.
Our forecast ability is also significantly affected by the current allocation within
the IC market, combined with delivery constraints of key components based on
the global capacity bottlenecks.
1IHS Light Vehicle Production (January 2021) 12SHAREHOLDER STRUCTURE SET FOR LONG-TERM PERSPECTIVE
Elmos Semiconductor SE shareholder structure Elmos 5-year share price development
Public buyback offer 2020 (Offer price per share: 17.50 Euro)
Market capitalization (as of Feb 12, 2021)
A total of 1.54 million shares bought back for ~27 million Euro
746 million Euro
Elmos now holds 1,978,206 treasury shares / 9.840% of share capital
Close Feb. 12, 2021
40 € 37.15 €
19,969% 35 €
34,040% 30 €
Free float
40.854% 25 €
15,001%
20 €
6,814% 15 €
14,337%
9,840%
10 €
Weyer Beteiligungsgesellschaft mbH and related parties
Jumakos Beteiligungsgesellschaft mbH 5€
ZOE-VVG GmbH and related parties
Treasury Stock
0€
Free float, thereof:
6.814% Teslin Capital Management BV as of May 2020 Jan-2016 Jan-2017 Jan-2018 Jan-2019 Jan-2020 Jan-2021
13FINANCIAL CALENDAR / RESEARCH COVERAGE / IR CONTACT
Event Date Elmos Semiconductor SE – basic share data
1
Preliminary results 2020 February 17, 2021 ISIN / WKN: DE0005677108 / 567710
1
Final results 2020 March 17, 2021 Stock symbol: ELG
1
Quarterly results Q1/2021 May 6, 2021 Code: ELGG.De
Annual General Meeting May 20, 2021 Class: Non-par value bearer shares
1
Quarterly results Q2/2021 August 4, 2021 Segment: Prime Standard, Regulated Market
1
Quarterly results Q3/2021 November 4, 2021 Share capital: 20,103,513 € / shares
Institution Analyst Recommendation Investor Relations
Deutsche Bank Robert Sanders Hold Ralf Hoppe
Hauck & Aufhäuser Christian Sandherr Buy Head of Investor Relations & Public Relations
Oddo BHF Stéphane Houri Buy Phone +49 231 7549 7000
Warburg Research Malte Schaumann Buy Email ralf.hoppe@elmos.com
1TheGerman Securities Trading Act (Wertpapierhandelsgesetz) and the Market Abuse Regulation (EU) oblige issuers to immediately announce any information that may have a substantial price impact, irrespective of the communicated
schedules. Therefore it is possible that we will announce key figures of quarterly and annual results ahead of the dates listed above. As we can never rule out changes of dates, we recommend checking dates and news ahead of schedule on the
Company’s website (www.elmos.com).
14DISCLAIMER This presentation contains forward-looking statements based on beliefs of Elmos‘ management. Such statements reflect the company‘s current views with respect to future events and are subject to risks and uncertainties. Many factors could cause the actual results to be materially different, including, among others, changes in general economic and business conditions, changes in currency exchange rates and interest rates, introduction of competing products, lack of acceptance of new products or services and changes in business strategy. Actual results may vary materially from those projected here. Elmos does not intend or assume any obligation to update these forward-looking statements. Elmos Semiconductor SE Heinrich-Hertz-Str. 1 | 44227 Dortmund | Germany | Telephone: + 49 231 75 49 0 | info@elmos.com | www.elmos.com
You can also read