The
nesto-meter
February 2021
←
→
Page content transcription
If your browser does not render page correctly, please read the page content below
The nesto-meter February 2021
February 2nd, 2021,

And just like that, January 2021 is already behind us!
While we thought ringing in the new year would
open up a whole new chapter, it is now obvious that
things haven’t suddenly and magically gone back
to normal just yet.

As January 2021 showed a much higher level of inter-
est for new purchases amongst our users compared
to the same period last year, we can’t help but think
COVID-19 still has a big effect on consumers’ gener-
al habits as well as the overall market seasonality in
terms of homebuying. Mortgage rates are still going
down, despite the fact that we thought they were
already at the lowest they could possibly be in 2020,
and it certainly influences our canadian users
behavior as well.

In this February 2021 issue, which covers data from
January 2020 to now, adding both december 2020
and January 2021 to the mix, you will find updated
data on our 4 key monthly metrics: Rates volatility
and variance, mortgage type trends, purchase price
vs down payment and purchase timing intent.

As for our monthly deep dive, our team decided to
look back at 2020 and compare our users preferences
in terms of down payment percentage and lenders,
between banks, credit unions and mortgage
financing companies.
KEY
         TAKEAWAYS
  In January 2021, fixed rates were the ones moving again,
          just like it was the case for most of 2020

While our best insurable variable rate back in January 2020
    was at 2.95%, it is now at 1.30%, a 1.65% difference!

60% of our nesto users were looking to buy a new property in
 January 2021, compared to 48% a year ago, in January 2020.

   In both QC and ON, 65-70% of our application requests
for a new property were from users who just started looking
                  versus found a property.

   In Ontario, the median purchase price was at 540 000$
    in January 2021, a 50 000$ drop since November 2020

     Canadians renewing their mortgage in 2020 tend
     to turn their back on big banks, for the benefit of
              mortgage financing companies.

5% down payment is what most canadian borrowers decided
            to opt for in 2020, at almost 58%.
#1 RATES
A. Volatility

Fig. 1: Number of times the lowest rates offered by nesto to its users changed per month across provinces between
January 1st 2020 and January 25th, 2021. Lowest rates looked at were fixed and variable insured (5-19.99% down
payment) as well as fixed and variable insurable (20%+ down payment) and corresponds to the lowest rate nesto
could offer its clients at the time.

In terms of mortgage rates, amongst many other things, 2020 has been
a very unpredictable year! Looking at our lowest rates for insured (5-19.99%
down payment) and insurable (20%+ down payment) mortgages, both 5-year
fixed and variable, since January 2020, those rates have 68 times, for an average
of 5.23 times a month and a peak of 14 changes for the month of April 2020 alone.

Comparing January 2021 to the last months of 2020, we can see an increase in
the number of rate changes in Quebec and Ontario, usually a result of lenders
trying to gain market share as the homebuying season starts up. This year, it’s
hard to put our finger on the most recent influences to our first 2021 rate drop
as seasonality patterns have gone out the window.
Volatility - by type

Fig. 2: Number of times the lowest rates offered by nesto to its users changed per month across provinces between
January 1st 2020 and January 25th, 2021 and comparing fixed to variable rates. Lowest rates looked at were fixed
and variable insured (5-19.99% down payment) as well as fixed and variable insurable (20%+ down payment).

Amongst the changes we noticed in January 2021, fixed rates were the ones
moving most often, just like it was the case for most of 2020. While Quebec rates
changed only once in the last month, the remaining canadian provinces saw 2
rate changes. While these recent changes appear to be driven by competition,
it’s important to mention that we are once again seeing rates surpass what we
thought was previously was the lowest level we would see.
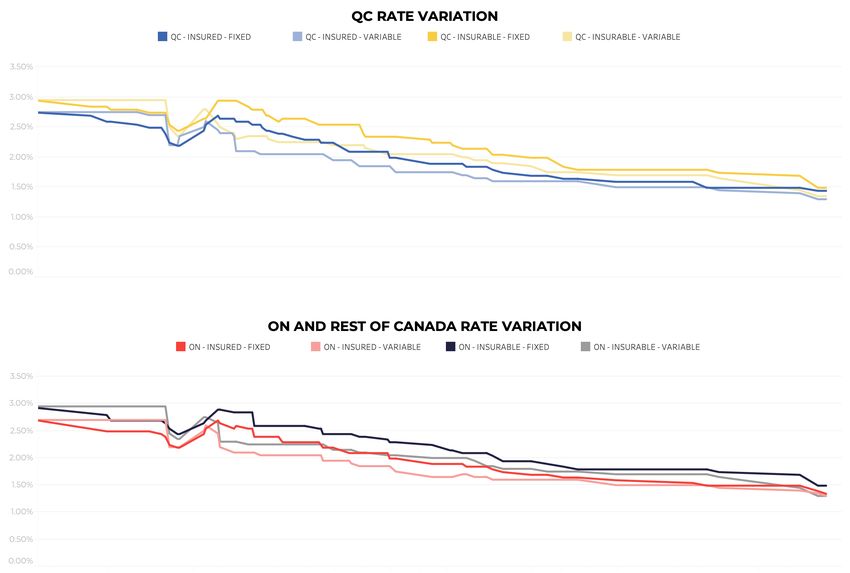
B. Variance: Lowest rates

Fig. 3: These graphs show the rate variance from January 1st 2020 to December 25th 2021 in Quebec
compared to Ontario and the rest of Canada.

So, our best rates have changed 68 times in the last 12 months but,
by how much?

According to this graph, since January 2020, the highest insurable variable rate
reached 2.95% while the lowest was at 1.30%, a 1.65% difference. Our data also
indicates that the trend we observed at the end of 2020 is still in effect for the
beginning of 2021: fixed and variable rates for the same category (insured or
insurable) remain close to each other, especially insured rates, with only a
0.04-0.1% difference between them compared to the usual 1.00% in previous
years. In a normal environment, lenders could and likely would increase the
discount offered with their variable rates in order to increase the attractiveness
of the product and balance their fixed vs variable selling ratios. Today, we’re
not seeing enough reduction to the variable discounts in order to influence
consumer decisions.
Table 1: This table represents the effect of a 1.65% rate difference on a 350k home, with 10% down payment
and a 25 year amortization after a 5 year term.

This table represents the effect of a 1.65% rate difference on a 350k home,
with 10% down payment and a 25 year amortisation after a 5 year term.
You think 1.65% ain’t that much? Let’s see!

Scenario 1: You signed a mortgage at 2.95%, our highest insurable variable rate
of the past 12 months. This 1,65% rate difference would have you end up paying
$25,000 more in interest over the course of only 5 years!

Scenario 2: You signed a mortgage at 1.30%, our lowest insurable variable rate
seen this year (and since many years!). In this situation, you’ll end up saving
over $15,000 in monthly mortgage payments over 5 years!
#2
MORTGAGE
TYPE TRENDS
Purchase
vs Renewal
vs Refinance

Fig. 4: Trends for proportion of purchases (new mortgages) vs renewals vs refinances from January 1st 2020
to January 25th, 2021. Sum is 100% for each month.

In the mortgage world, like in most industries, every year follows a similar
“pattern”, which creates seasonality: The buying season, the renewal season,
refinance season and so on. In 2020, with the pandemic disturbing every aspect
of what we considered normal, there was no such thing as seasonality, or at least,
it didn’t influence the mortgage market when and where we’d expect it to.

Now, what about 2021? Are we starting to see actual trends?

Heading into the new year, from November 2020 to January 2021, we can see
purchases (new homes) are taking a major portion of user intent. In fact, 60%
of our nesto users were looking to buy a new property in January 2021, compared
to 48% a year ago, in January 2020.

As the interest for new purchases increases, refinances are down about 5% from
November 2020, while renewals remain stable. Just like every year, the first week
of January was full of refinance applications resulting from many Canadians
reviewing their household budgets. We expected refinance volume to increase
throughout the month but to our surprise it was overshadowed by new purchase
requests.
#3
PURCHASE
TIMING
INTENT
Fig. 5: Purchase intent: proportion of users “ready to buy” vs “just looking” in nesto’s mortgage process,
showing month by month from January 1st 2020 to January 25th, 2021.

As stated earlier, almost 60% of our users had the intent to purchase a new
property in January 2021, but were they ready to buy, or just getting started
in the process (self declared: Just looking)?

In the upper graph, we notice users who declared to be “just looking” have
gained enormous traction since November, continuing into the new year,
representing over 68% of our users’ timing intent.

As for overall demand, we recognized a large volume increase through Q4 that
is snowballing into Q1. The demand has resulted in nesto adjusting staffing
priorities in order to facilitate what we predict to be another very active
and busy year in the real estate and mortgage space.
By Province

Fig. 6: Purchase timing intent proportion of users “ready to buy” vs “just looking” in nesto’s mortgage process,
from January 1st 2020 to January 25th 2021 in Quebec and Ontario.

Looking at this timing intent from a province to province perspective, we notice
the same pattern is reflected in both QC and ON, with 65-70% of our application
requests for a new property being from users who have just started looking
versus found a property.

Following the 2020 trend, we can expect these “just looking” to evolve towards
more “live deals (self declared: my offer is accepted)” over the coming weeks.
#4
Property value
and down payment
Fig. 7: Graph of intended purchase price vs down payment (in dollars and percentage) from January 1st 2020
to January 25th 2021.

After an increase of the median amounts for both the projected property value
and down payment in October 2020, in November, the same amounts dropped
again, our median purchase price going from 449,000$ back to 400,000$ and
our median down payment amount, down from 62,000$ to 50,000$. From
December 2020 to January 2021, median price and down payment continued
their downward trend, the median down payment percentage down to nearly
10%, much lower than January 2020, at 13%.
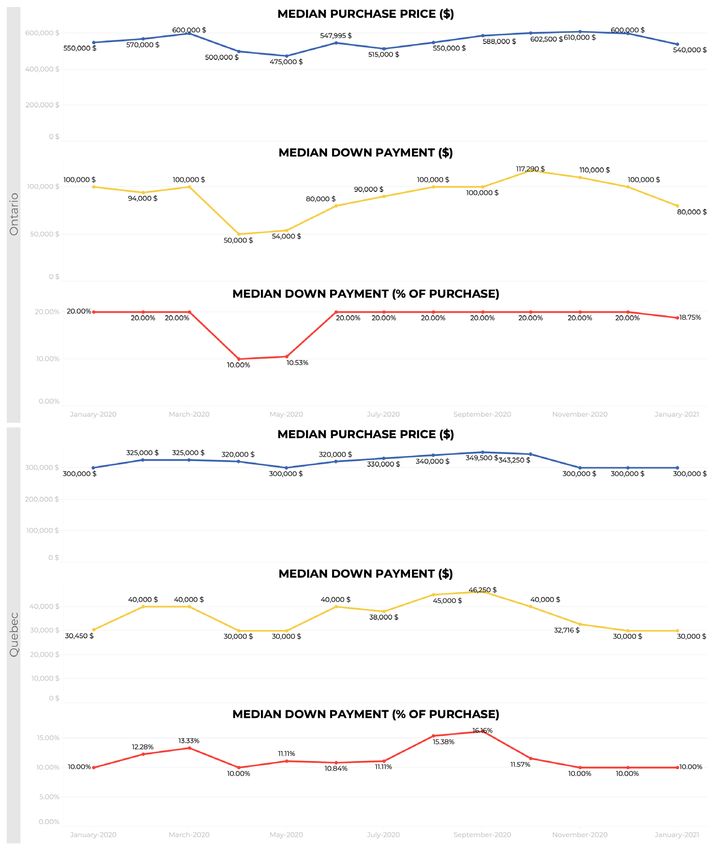
By province

Fig. 8: Graph of intended purchase prices vs down payment (in dollars and percentage)
from January 1st 2020 to January 25th 2021 in Ontario and Quebec.

Comparing the data by province helps highlight the changes in the generic
view, and understand that Quebec and Ontario are two, very different
mortgage markets!

In Ontario, many of our tracked metrics dropped since November 2020.
The median purchase price was at 540 000$ in January 2021, a 50 000$ drop
in only 2 months. While the median down payment also dropped by 30 000$
since last November, the percentage of median down payment remains
very close to 20%, with a slight decrease in January 2021.

In Quebec, the down payment percentage remains stable, at 10% of the property
value since November. Comparing year to year, it seems like we had very similar
numbers back in January 2020.

A trend we recognize through our user engagement that is more prominent
in Ontario vs Quebec, is that many young home buyers in ON are starting off
with a substantial gift from the bank of mom and dad. We will take a deeper
look into the gifted down payment applications in a future report.
DEEP
DIVE
A look at 2020
1. Who are nesto users renewing
   their mortgage from?

 Fig 9: Looking at the top 5 lenders nesto users were renewing from in 2020 by province.
When the time comes to renew their mortgage, canadian customers will often
shop around for a better rate or better conditions, especially if they weren’t able
to do so the first time around. Since 2020 was such a particular year in so many
ways, we were interested to see which lenders our nesto users would most
generally renew their mortgage from, by province. To be clear, the lenders
within the graph above are the existing lenders holding the users mortgage
when the user engages nesto for a better rate and mortgage product offer.

Amongst our Quebec renewals, the vast majority were previously with
Desjardins (34%), followed by National Bank, RBC and other big banks.
Considering Desjardins holds the most sizable share of the broker channel
mortgage market in Quebec, it’s not surprising they appear most frequently,
but we do believe this ratio is further influenced by the press that has plagued
the major Quebec lender over the last 24 months.

In Ontario and BC, those who decided to renew their mortgage with nesto were
also mostly coming from big banks. This is to be expected but at the same time,
highlights a major discrepancy with what borrowers are expecting from their
bank in exchange for their years of loyalty and timely payments compared to
what they are offered as renewal terms. It’s also not surprising that we don’t see
many users shopping for a better deal when their current lender is a “mortgage
financing company” such as MCAP, First National, etc who’s only line of business
is mortgages.

In Alberta, nesto renewers currently with a big bank are just as likely to investi-
gate their options but one noteworthy find was that MCAP, a mortgage finance
company generally known for best rates and customer service, was the existing
lender on about 15% of our user requests. This anomaly is somewhat concerning
and could be related to MCAP’s position on the economic issues facing the
province, resulting in less competitive renewal offers to influence borrowers
to move lenders or pay them out as opposed to be renewed.

Overall, what our 2020 data tells us about renewals is that the majority of
Canadians with strong credit and repayment history are taking the time to look
for better rates and conditions for their next mortgage, often turning their back
on the big bank that gave them their first savings account. Borrowers who
remain a little too nervous to leave the bank will still do their homework, and
leverage the non-bank offers received by mortgage brokers to negotiate with
against their bank’s mortgage specialist. Most of our users believe it isn’t worth
the time they would need to take off work to beg their bank for something
they feel that they deserved up front.
2. How much down payment
   (%) are consumers down for?

Fig 10 : Percentage of down payment % nesto users opted for in 2020.

In Canada, the minimum down payment required to become a homeowner is 5%,
and that’s the percentage most of our users decided to opt for in 2020, at almost 58%
of the total requests. Does this have anything to do with their plans being altered due
to COVID-19? Is the major increase in home pricing responsible for that minimum
down payment? Our user responses varied greatly but one common theme used as
justification for putting 5% down was related to the many accessible investment
instruments that may yield returns exponentially higher than the cost of mortgage
financing at < 2%. In other words, many financially savvy borrowers who are beneath
the 20% down payment required to avoid CMHC insurance have been opting to use
the bare minimum needed as downpayment to retain as much money as possible
in their existing investment vehicles.

In second came 20% down payment, which is also the minimum amount required to
avoid paying mortgage insurance and very close 3rd was 10%, a good balance between
decreasing the mortgage amount, insurance premium ratio, and keeping money aside
to cover all of the other expenses related to being a homeowner.
Fig 11: Percentage of down payment nesto users opted for in 2020, divided by month.

Looking at the same numbers, but on a monthly scale, we can clearly see the trend
developing through the pandemic towards a minimal down payment as reported last
fall. From March to July 2020, nesto users would rather put 10% than 20% down
payment on a house, while the 20% down payment was always much more popular
in the months preceding the first lockdown.

As fall 2020 hit, 20% down payments started to gain in popularity again, surpassing
10% down payments every month until 2021.
3. Bank vs mortgage
   financing company:
   What’s our users choice?

Fig 12: Percentage of nesto users choosing banks and credit unions versus mortgage financing companies in 2020

What type of mortgages lenders did our nesto users opt for in 2020:
Big banks and credit unions or mortgage financing companies?

Looking at our first graph, showing our overall data for the whole country,
Canadians chose mortgage financing companies over banks and credit unions
66% percent of the time in 2020, that’s 2 times out of 3! While banks and unions
gained some traction during the fall, they reached a small 21% of our overall de-
mand at the end of the year. Each lender that we decide to support serves
a purpose and whether our users end up with a mortgage financing company,
credit union, or big bank, we’re proud that they had an unbiased and transparent
opportunity to understand the best mortgage products(and rates too!) for their
needs using our platform.
CONCLUSION
From the end of 2020 to the beginning of 2021, we saw
a major increase of interest for new purchases: 60% of our
nesto users were looking to buy a new property in January
2021, compared to 48% a year ago, in January 2020. While
these intentions might not result in immediate purchases
(68% of our users admit to be “just looking), it is still an
uncommon trend for that particular time of the year.

Are low rates influencing this behavior? Most certainly!
While our best insurable variable rate back in January 2020
was at 2.95%, it is now at 1.30%, a 1.65% difference! And there
is still no indication of a rate increase anytime soon.

Looking back at 2020, it is interesting to note that a vast
majority of our users are opting for mortgage financing
companies as opposed to the traditional leaders, being big
banks, when it comes to contracting a mortgage. While
most of our users had opted for the 5% minimum required
down payment this year, the pandemic has clearly not yet
made a noticeable reduction to the amount of Canadians
at this moment in time who are qualified and actively
shopping for a home.
METHODOLOGY
The data used for this study comes from nesto’s
online application and is solely based on the
experience of nesto.ca customers/users, not the
national market as a whole.

Data is collected from thousands of monthly users
declaring their intent or completing online applica-
tions across Canada. The data is anonymized and
aggregated for analysis.

Data presented within our Rate volatility and
variances report refer to nesto’s “best rate” at
any given moment. nesto’s best rate comes
from any one of our many lending partners
at any given moment.

Author: Chase Belair,
Co-Founder and Principal Broker at nesto

For press and research-related requests,
email us at media@nesto.ca.
You can also read