Evaluating The Cape: pre and post occupancy evaluation update January 2020 - Energy Consumers Australia
←
→
Page content transcription
If your browser does not render page correctly, please read the page content below
Evaluating The Cape: pre and post occupancy
evaluation update January 2020

Research team:
Dr Trivess Moore1 (RMIT University), Dr Nicola Willand (RMIT University), Dr Sarah Holdsworth (RMIT University), Dr
Stephen Berry (University of South Australia), Dr David Whaley (University of South Australia), Dr Graeme Sherriff
(University of Salford), Dr Aimee Ambrose (Sheffield Hallam University) and Leonie Dixon (Masters student, RMIT
University).

Background and research objectives:
The residential sector in Australia, as with other countries, is a significant contributor of overall environmental
impact including greenhouse gas emissions and material consumption. The current minimum regulatory performance
requirements for new housing in Australia fall significantly short of the targets set by other developed nations as part
of a sustainable future. Recent research has found that more than 80% of detached housing in Australia is only built
to the minimum regulatory requirements (currently 6.0 stars on the Nationwide House Energy Rating Scheme), with
less than 1.5% built to the economically and environmentally optimal sweetspot (7.5+ stars)2 for the life of the dwelling.

The way we design and construct housing has a significant impact on households and society. For example, a poorly
designed and/or built home can add significant energy costs or be hard to keep cool during heatwaves in summertime
and warm during winter. Across Australia we are seeing an increasing issue emerge in relation to energy poverty and
negative health outcomes due to poor quality housing and rapidly increasing energy prices.

There are ways in which we deliver sustainable housing in Australia so that we improve the quality of life of occupants
in the houses, as well as reducing associated social and environmental impacts.

While there is some research in Australia about the benefits of sustainable housing (e.g. Lochiel Park in South
Australia) there is still a need for more evidence to inform policy development and broader debates about housing
performance in Australia. This research project aims to provide evidence of the qualitative and quantitative lived
experience of a housing development which is attempting to deliver higher quality housing in order to guide other new
housing developments and future revisions of minimum performance regulations for housing in Australia.

Research methods:
The research involves a pre- and post-occupancy evaluation of households who have purchased land and have
built, or are building, a house at The Cape3. There are currently 14 households involved in the research from stage
1 – 3 of the development. Of these, 8 are now living in their homes with the rest at various stages of the design and
construction process.

The research involves both qualitative and quantitative data collection as per the following.

Before moving:
•    Semi-structured interviews with participants to explore their housing histories, how they use their current homes
     (e.g. space, resources), motivations for building at The Cape, expectations of how their new housing will perform
     and reflections on the design and development process to date. Some households joined the research just
     after they moved into their new homes at The Cape so a modified initial interview was conducted with those
     households.

1   For further information on the project please contact Dr Trivess Moore on 03 9925 9071 or trivess.moore@rmit.edu.au
2   https://doi.org/10.1016/j.enpol.2019.06.017
3   A
     new sustainable housing development in Victoria which goes significantly beyond minimum regulatory performance and sustainability
    requirements. See https://www.liveatthecape.com.au/ for further information.
•    Energy and water consumption/generation and cost analysis to understand the performance and utility usage of
     the homes and to set baselines for comparison. Use of smart meter (electricity, renewable energy) and utility bill
     data (electricity, renewable energy, gas, water) to undertake yearly, seasonal, weekly and daily analysis.
•    Thermal comfort monitoring (temperature and humidity using a Hobo sensor, one in the main living area, one
     in the main bedroom) to understand the thermal performance and set baseline for comparison of changes.
     Temperature and humidity data recorded at 30-minute intervals and analysis was undertaken for yearly, seasonal,
     weekly and daily analysis.

After moving:
•    Semi-structured interviews 1 year post move with participants to explore how they use their new homes, their
     experience of their new house and reflections on the design and development process and any key lessons for
     changes to design or the process. These will help to contextualise, validate and explain the technical data.
•    Energy and water consumption and renewable energy generation (as per pre-move monitoring).
•    Thermal comfort monitoring (as per pre-move monitoring).

Other analyses which may be undertaken in the future include blower door tests, indoor air quality testing as well as
life cycle analysis of the house construction.

The research project began in September 2018 and is expected to continue until at least 2022 to ensure that
longitudinal data is collected.

Summary results and analysis January 2020:
Most participating households aimed to live in The Cape permanently, with some planning to transition down to
their new home on a more permanent basis over a number of months or years. There were also a small percentage
of households using the home as a holiday house. There were a range of motivations from the households as to why
they had bought land and planned to build a home at The Cape. Motivations ranged from wanting to reduce living
costs and environmental impact through to being part of a like-minded community. Some households already lived in
the area and were looking to move into sustainable and quality housing, while others were from Melbourne (or further
afield) and were looking to transition living down at The Cape.

The expectations from all the households was that the houses would perform much better than their existing housing
and would have low operating costs due to the improved design, materials and use of renewable energy technologies.
Some of the households expected that they would be able to achieve a net zero energy lifestyle in the homes across
the year. The households also spoke of how they were looking forward to the house being more thermally comfortable,
not just in extreme weather events but across the year and having a more consistent temperature throughout all
areas of the home. Importantly they believed this could be achieved without the need for much (if any) mechanical
heating and cooling. Many spoke of how the house was just one step for them in making larger sustainability changes
in their lives and expected to make other changes such as switching to an electric car in the future.

In interviews with households after they moved, they reported that the housing was thermally comfortable, that they
rarely had to use their heating and cooling systems and their energy and water bills had significantly fallen. Overall
the majority of households were extremely happy with the performance and quality of the homes4. There were some
reflections on minor things which could have been done differently in terms of design or technology inclusions (e.g.
changing some materials for aesthetic or performance reasons). The use of the development guidelines provided by
the developer and the use of a design review panel helped to ensure improved outcomes from having inputs from
sustainable housing experts.

The participants also spoke about how friendly the community was, even though it was still under development.
Residents spoke about how the existing community welcomed new households and there were a number of community
events starting to occur in the development. Some of the residents who were not yet living in the development would
drive down from Melbourne to participate in some of the community activities such as the community gardening days.

4 One household reported some issues with quality of their build but these were not related to any of the sustainability features. The builder
   was working to rectify the defects and it is not expected there will be any long term impact on the performance of the house.
Monitoring the temperature of the constructed homes through their first year of occupation found that the homes
maintain a stable and comfortable year-round temperature band typically between 18 – 25 degrees Celsius. The
homes have been designed to a minimum of 7.5 stars with many in the development achieving 8.0 stars and beyond.
At 7.5 stars the energy required for heating and cooling (76 MJ/m2 /annum) is 40% less than compared to a 6.0
star house (127 MJ/m2 /annum). What we found in the interviews with households is that they were using their air
conditioning systems less than the assumptions in the modelling software (e.g. FirstRate 5) would suggest, turning
them on only on a handful of occasions across summer and winter as they felt the homes performed well enough
with some active thermal comfort actions such as opening and closing blinds and windows. This is supported by the
example data below in Figure 1 and Figure 2. There are several benefits of this improved performance. The first is that
there is a reduction in energy consumption to maintain thermal comfort which reduces energy costs. The second is
that the home spends a greater percentage of the time in the healthy temperature range (without needing mechanical
heating and cooling) as identified by the World Health Organisation which may improve health outcomes for the
occupants. Thirdly, the data shows that if there is an energy blackout, the homes would maintain thermal comfort
for an extended period of time which is important given issues with the current energy networks. Fourthly, it means
that the homes can include smaller heating and cooling appliances (or removing them all together) reducing capital,
maintenance and replacement costs over the life of the home.

Looking at the extreme heat day (Day 14) in Figure 1 where the external temperature reached almost 42 degrees
Celsius, the internal temperature of the bedroom was 10 degrees Celsius cooler and the living area was around 14
degrees cooler than outside. In Figure 2 it can be seen that during winter there were a number of days where the
minimum outdoor temperature dropped to below 0 degrees. The bedrooms on those days dipped to around 14 degrees
and the main living area did not often drop to much below 18 degrees. The households reported that the homes
warmed up quickly in winter even when there was little sun during the day. This is supported by the monitored data.
Across the monitored homes the average temperature in the kitchen/living area during January was 22.6 degrees with
a maximum of 27.4 degrees and a minimum of 19.2 degrees. During July the average was 18.6 degrees with a maximum
of 25.1 degrees and a minimum of 14.8 degrees.

                      45

                      40

                      35

                      30

                      25
   Temperature (°C)

                      20

                      15

                      10

                      5

                      0
                      Day 31   Day 03   Day 06   Day 09        Day 12        Day 15          Day 18        Day 21       Day 24   Day 27   Day 30

                                                   BoM Outdoor Temperature       H3 KL Internal       H3 Bed Internal

Figure 1: Example home at The Cape during a summer month with monitoring of kitchen/living (KL) and main bedroom (Bed) compared to
external temperatures.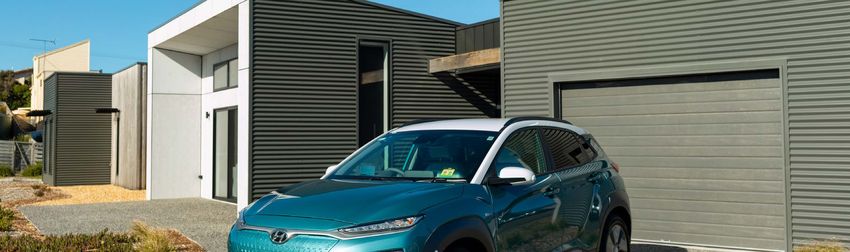
30

                       25

                       20

                       15
    Temperature (°C)

                       10

                       5

                       0

                       -5
                        Day 31     Day 03     Day 06     Day 09        Day 12        Day 15          Day 18         Day 21      Day 24   Day 27   Day 30

                                                           BoM Outdoor Temperature       H3 KL Internal       H3 Bed Internal

Figure 2: Example home at The Cape during a winter month with monitoring of kitchen/living (KL) and main bedroom (Bed) compared to
external temperatures.

Analysis of the energy consumption and generation of renewable energy on 5 occupied homes in the study is
presented in Table 1. The data shows that energy imported from the grid ranged from 1,048kWh per year to 2,612 kWh
per year or from 2.9-7.2 kWh/day with an average of 5.2kWh/day. Excess renewable energy generation exports ranged
from 2,625 kWh per year to 5,420 kWh per year or 7.2-14.8kWh per day and an average of 12.4kWh/day. As the analysis
from Damien Moyse (Renew) shows in Table 2, this results in a reduction in energy consumption of 88% compared
to a typical new 6 star home of comparable size in Victoria. In this context the house at The Cape are performing as
expected and in line with data from other sustainable housing developments in Australia (e.g. Lochiel Park). Some of
the homes at The Cape have recently added battery storage to take further advantage of the energy their renewable
energy systems are generating. Analysis of the impact of these batteries will be forthcoming.

Table 1: Energy imported and exported (renewable energy) for monitored homes at The Cape.

                                 Annual Import         Daily Import             Annual Export                 Daily Export
                                  (kWh/year)            (kWh/day)                (kWh/year)                    (kWh/day)

 House A                             1,048                  2.9                      5,420                          14.8

 House B                              2,357                 6.5                      4,950                          13.6

 House C                             2,612                   7.2                     2,626                            7.2

 House D                             2,020                  5.5                      5,040                          13.8

  House E                            1,450                  4.0                      4,570                          12.5

  Average                            1,897                  5.2                      4,521                          12.4
Table 2: Comparison of Cape houses against typical Victorian 6 Star Dual Fuel Home

                                                                           Electricity Import                   Gas Usage
                                                                              (kWh/year)                        (MJ/year)
 Victorian 6-Star Dual Fuel Usage                                                    4,296                         41245
 Savings of Cape v 6 Star Dual Fuel                                                  2,399                         41245
 Savings of Cape v 6 Star Dual Fuel (%)                                              56%                           100%
 Total Energy Savings of Cape homes                                               13,855
 Total Energy Savings of Cape homes (%)                                              88%

This reduction in energy consumption was noticed by the households who reported that their energy costs were
significantly lower than their previous homes, estimating that they had now dropped to under $500 a year; a figure
confirmed by their energy bills and the modelling we undertook which found economic savings of $2,307/year. Some
households were in credit on their energy bills. If the energy savings ($2,307/year) found at The Cape were replicated
across all new housing in Victoria it would lead to economic savings for those households of almost $91 million per
year and across Australia it would be almost $180 million per year. If all new housing, which is estimated at 118,300
houses per year, was built to the standard of The Cape across the next decade there could be accumulated economic
savings for these households of more than $5 billion.

Table 3: Economic savings for housing at The Cape for single house, all new housing in Victoria and all new housing in Australia (2018).

 Single house      All new housing in Victoria        All new housing in Australia
 $2,307            $90,895,800                        $179,639,346

Table 4: Accumulated economic savings of all new housing over a decade meeting performance of The Cape ($ millions)

  Year    1         2         3         4         5          6         7         8           9       10        Total
    1     $179      $179      $179      $179      $179       $179      $179      $179        $179    $179      $1,790
    2               $179      $179      $179       $179      $179      $179      $179        $179    $179      $1,790
    3                         $179      $179       $179      $179      $179      $179        $179    $179      $1,432
    4                                   $179       $179      $179      $179      $179        $179    $179      $1,253
    5                                              $179      $179      $179      $179        $179    $179      $1,074
    6                                                        $179      $179      $179        $179    $179      $895
    7                                                                  $179      $179        $179    $179      $716
    8                                                                            $179        $179    $179      $537
    9                                                                                        $179    $179      $358
   10                                                                                                $179      $179
                                                                                                               $10,024

In relation to reduced environmental impacts, housing at The Cape is saving 4.4 tonnes of CO2-e per year compared
to a standard 6 star duel fuel newly built house in Victoria. This increases to a saving of 11.2 tonnes of CO2-e per year
when the house is combined with an electric vehicle. This would be the equivalent of taking up to 80,000 cars off our
roads each year
Table 5: Estimated tonnes of CO2-e savings by housing built to standards at The Cape for one year.

    Single house      All new housing in Victoria     All new housing in Australia
    4.38              172,572                         341,058

Assumptions for modelling
•      The baseline data for the typical new 6 star duel-fuel house in Victoria was taken from modelling by Renew. This
       was cross-checked with previous RMIT research.
•      The baseline energy performance was then adapted for housing in other states using energy consumption data
       from https://www.energyrating.gov.au/document/report-energy-use-australian-residential-sector-1986-2020
•      While solar generation data will differ by state and location we have assumed for the model that the generation
       from the PV panels is similar for each state.
•      I used approvals for new houses (not apartments) from ABS in 2018 as a proxy for houses constructed which were
       assumed to be consistent in future years:

           Approvals houses 2018 from ABS
           Victoria                   39400
           NSW                        29800
           QLD                        24300
           SA                         8000
           WA                         12300
           Tas                        2700
           NT                         500
           ACT                        1300
           Total                      118300

•      This gave a per state number which when combined with the state based energy consumption variation was able
       to provide a per state number for economic savings and environmental savings.
•      Environmental savings were based upon Renew’s model of CO2e savings. Conversion to number of cars assumed
       1 car was equal to 4.3 tonnes of CO2e. Environmental savings was adjusted per state based upon the above
       energy adjustment approach.

Acknowledgements:
The research would not be possible without the assistance of key stakeholders in the development of The Cape
including Brendan Condon and Clint Hare. We are also grateful for the time and participation of the households
involved in the project. Some of the data presented above has been prepared by Leonie Dixon as part of her Masters
research project at RMIT University and by Damien Moyse and others at Renew.
You can also read