Experimental Study of Performance of Solar Chimney
←
→
Page content transcription
If your browser does not render page correctly, please read the page content below
IOP Conference Series: Materials Science and Engineering

PAPER • OPEN ACCESS

Experimental Study of Performance of Solar Chimney
To cite this article: A A Hassan et al 2021 IOP Conf. Ser.: Mater. Sci. Eng. 1094 012046

View the article online for updates and enhancements.

                               This content was downloaded from IP address 46.4.80.155 on 10/05/2021 at 13:06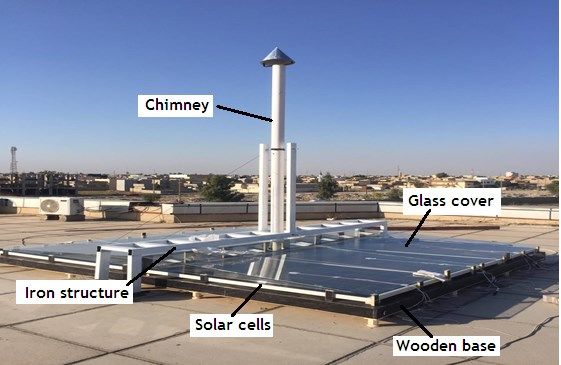
INTCSET 2020                                                                                                             IOP Publishing
IOP Conf. Series: Materials Science and Engineering              1094 (2021) 012046           doi:10.1088/1757-899X/1094/1/012046

Experimental Study of Performance of Solar Chimney

                      A A Hassan, Omer Khalil Ahmed and E F Abbas
                      Technical college, Kirkuk, Northern technical university, Iraq

                     E-mail: afnan_hwj@ntu.edu.iq

                     Abstract. In this paper, a practical study was conducted with and without solar panels to show
                     their effect on the performance of the hybrid solar chimney in the city of Kirkuk in Iraq. Six
                     cells were placed between the base of the collector and the glass cover, which gives freedom to
                     the air to move up and down the cells. Also, it is showed that the speed is higher when using
                     PV until it reaches 1.8 m/s while the air leaving the collector and the energy coming out of the
                     chimney and the efficiency of the solar collector and the efficiency of the chimney. The
                     practical results showed that the chimney base is the ideal location for the turbine, as the air
                     velocity is higher than other locations, and the air velocity increases during the day to reach its
                     highest velocities at 1 pm. The maximum kinetic and electrical power and the amount of heat
                     reached 37, 950, and 280 watts, respectively, in February at 1 pm. The results also showed that
                     the location of the photovoltaic cell determines the degree of its temperature, as the solar cells
                     that are in the middle are characterized by high temperature, while the solar cells that are on the
                     ends are at a lower temperature and the solar cell temperature also depends on the surrounding
                     weather conditions. High-efficiency values are observed for all months in the early morning
                     hours due to the solar cells’ low temperature. The highest recorded electrical efficiency values
                     were 17.8% in December.
                     Keywords. Solar chimney, Photovoltaic cell, Performance, Experimental, Assessment.

1. Introduction
The increase in the traditional fuel prices and the resulting environmental pollution led the scientists to
search for renewable and non-polluting sources of the environment [1]. Solar energy was one of the
most vital energies that scientists tried to take advantage of because solar energy is available and does
not need advanced technology and not polluting the environment [2]. However, what is wrong with
solar energy systems is the low efficiency, and the researchers tried to improve these systems’
efficiency. There are currently many systems for generating electricity using solar energy, and solar
chimneys or solar updraft towers are one of the technologies used for this purpose [3]. The solar
chimney includes a circular area of glass placed at a certain distance from the Earth’s surface, and in
the center of this circle, there is a high chimney similar to the chimneys utilized in electrical power
stations. The solar radiation heats the air trapped between the glass layer and the ground, which is
painted black to work as the absorbing plate in the solar collectors. The air density below the glass
cover decreases because of its high temperature and moves up towards the chimney to rotate special
turbines similar to wind turbines. In 1982, the first solar chimney was built in Manzanares in Spain.
The chimney had a height of 195 m and a radius of 5 m with a collection area with a diameter of 244
m, and one of the major disadvantages of solar chimneys is its low efficiency [4]. Scientists and
researchers have conducted several studies to enhance the efficiency of solar chimneys by integrating
              Content from this work may be used under the terms of the Creative Commons Attribution 3.0 licence. Any further distribution
              of this work must maintain attribution to the author(s) and the title of the work, journal citation and DOI.
Published under licence by IOP Publishing Ltd                          1
INTCSET 2020 IOP Publishing
IOP Conf. Series: Materials Science and Engineering 1094 (2021) 012046 doi:10.1088/1757-899X/1094/1/012046
and adding other technologies and means to improve the performance of the solar chimney [5].
Photovoltaic-Solar Chimneys (PV/SC) are one of the proposed designs to increase the efficiency of
solar chimneys. This technique relies on the use of solar chimneys to cool solar panels. Several studies
and designs have been presented in recent years to assess the performance of these hybrid solar
chimney systems [6]. Eryener et al.[7] presented a novel type of solar chimney, which is called a
transpired solar chimney. The transpired solar chimney utilized transpired metal sheets in place of the
glass cover, which is used in the conventional solar chimney. The air enters the upper metal surface
instead of the perimeter. A laboratory model for this type was built at Trakya University in Edirne-
Turkey. Several tests were conducted during the summer and winter seasons to study the design and
operational parameters on the performance of the modified solar tower. The efficiency of the new
solar chimney was increased by 3 times the efficiency of the conventional solar chimney. Eryener and
Kuscu [8] suggested a new concept of the solar chimney which called a hybrid transpired solar
chimney and consists of photovoltaic panels and transpired solar collectors. The photovoltaic panels
cover 42% of the area of the transpired solar chimney. The efficiency of the solar chimney is ranging
between (16-18%)
2. Methodology
Solar energy systems are characterized by their low energy density and low efficiency. The research
trends in the current period aim to enhance the efficiency of solar energy systems using different
methods. This paper aims to assess the performance of an innovative system of the PV/solar chimney
under Iraqi weather conditions. The experiments were conducted in Kirkuk city in Iraqi (35.47 No,
44.39 oE). The experimental data were recorded from 9 am to 4 pm. The experiments were conducted
in December-2019 and in January, February, and March-2020. The paper includes the following
sections: the practical work is clarified in Section 3; in Section 4, the calculations of the performance
and efficiencies estimation are clarified; the outcomes are presented and discussed in Section 5;
finally, the conclusions and recommendations are presented in Section 6.
3. Practical study
To study the performance of this solar photovoltaic chimney, a pilot model was constructed, as shown
in Figure (1). The system was placed on the roof of the Technical College/Kirkuk building, at the
height of 12 m above ground level. This system consists of the following parts:
1- Iron structure, 2- Six solar cells, 3- Glass cover, 4- Chimney, 5- Measuring devices, and 6-
Electrical load.
Figure 1. PV/Solar chimney pilot model.
2INTCSET 2020 IOP Publishing
IOP Conf. Series: Materials Science and Engineering 1094 (2021) 012046 doi:10.1088/1757-899X/1094/1/012046
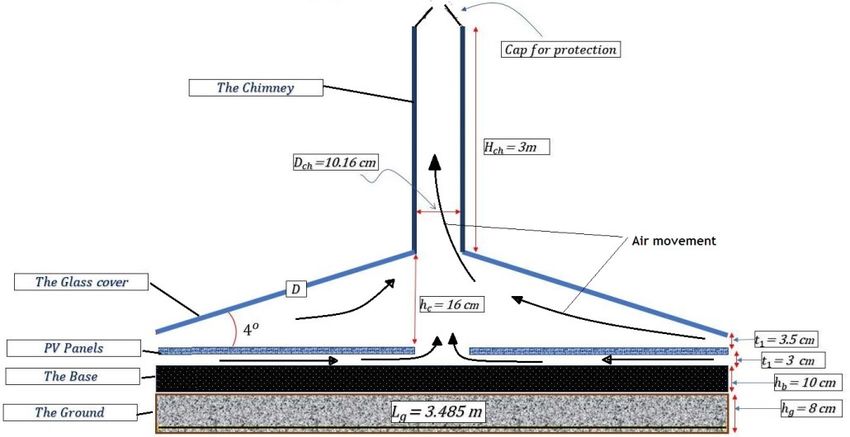
Specifications of these cells are shown in Table 1. The six solar cells were linked in series. The current
design differs from the previously studied designs, such as in [9], because the air moves below and
above the solar cells to absorb the most considerable possible amount of heat that causes low
efficiency of the solar cells, Figure 2.
Table 1. PV/cell specifications.
Parameters Unit Parameters Unit
Open Circuit Voltage Short Circuit
21.9 V 9.01 A
(Voc) Current (Isc)
Maximum Power at the
250 W Cell Type Multicrystalline
standard condition
Operating
Maximum Power voltage 35 V 25 oC
Temperature
Maximum Power Current 15 A Dimensions (m) (1.64×0.990×0.04)
hc=15.33
cm
Figure 2. Dimensions of the experimental model.
4. Performance calculations
The thermal efficiency of the solar chimney can be calculated as [10]:
(1)
Aco is the total area of the solar cells, and it is a square area of 10.8 m2.
It is the total solar radiation on a horizontal surface (W/m2).
Qu represents the heat gained by the chimney and calculated as[11]:
̇ (2)
Where is the temperature of outlet air and measured by the thermocouples at the exit of the
chimney.
is the ambient air temperature and also measured by a thermocouple
is the air specific capacity of the air and evaluated as[12]:
[ ] (3)
Also, ̇ represents the mass flow rate of air and calculated as[6]:
̇ (4)
is the density of moving air at the inlet of the chimney and calculated by[13]:
3INTCSET 2020 IOP Publishing
IOP Conf. Series: Materials Science and Engineering 1094 (2021) 012046 doi:10.1088/1757-899X/1094/1/012046
(5)
is the average of the air velocity, which is calculated experimentally by hot-wire anemometer
along with the chimney height.
is the cross-sectional area of the chimney and equal to ( 81 cm2).
The electric efficiency of the new solar chimney was evaluated as [14]:
(6)
PK represents the electrical energy generated by the turbine at the base of the solar chimney [15]
(7)
Where: the efficiency of the used turbine and its value (85 %) [15].
PW represents the kinetic power produced by the system and calculated experimentally from the
following relation [16]:
(8)
While PPV represents the electric energy produced by solar cells. It is well known that the electric
energy produced depends on the temperature of the solar cell and calculated as[17]:
(9)
V and I represent the voltage and current of the solar cells, respectively.
The error analyses are one of the essential criteria that determine the suitability of a novel solar
chimney to produce electric power. Table (2) shows the uncertainty of the instruments utilized in the
practical work, then the uncertainty of the obtained results is evaluated by the following equation [18]
2 2 2
R 1 2 ........ n (10)
x1 x2 xn
Table 2. Specifications of the instruments.
Equipment Measurement Error
Hotwire Anemometer Wind Velocity ± (2%)
Multi-meter DC Current ±(0.7%)
Digital Thermometer Temperature ± (0.5 ◦C)
Multi-meter DC Voltage ±(0.4%)
5. Results and discussions
Figure ( 3 ) shows the variation of the ambient air temperature and solar radiation values
during the test months. The recorded temperatures ranged between 4 oC in December and 23
in February. In contrast, the highest recorded solar radiation value was 707 W/m2 at 1:00 pm
in February.
4INTCSET 2020 IOP Publishing
IOP Conf. Series: Materials Science and Engineering 1094 (2021) 012046 doi:10.1088/1757-899X/1094/1/012046
Ambiant Temperatuer (℃)
25
20
15
10
5
December January Febraury
0
10:00
10:30
11:00
11:30
12:00
12:30
13:00
13:30
14:00
14:30
15:00
15:30
16:00
9:00
9:30
Time (Hour)
(a) Ambient air temperature
800
Solar radiation (w/m2)
700
600
500
400
300
200
December January February
100
0
12:00
15:30
10:00
10:30
11:00
11:30
12:30
13:00
13:30
14:00
14:30
15:00
16:00
9:00
9:30
Time (Hour)
(b) Solar radiation
Figure 3. Variation of the ambient air temperature and solar radiation.
5.1. Air velocity
Generally, the designs of solar chimneys are based on converting solar energy into kinetic energy and
then use this kinetic energy to rotate special turbines that generate electricity. Figure ( 4 ) shows the
variation of the air velocity at the chimney base for different months. The first impression of the
change in air velocity at the base of the chimney shows the escalation of air velocity values to reach
the highest speed at 1 pm for all months, and then it decreases after that. This escalation in the air’s
speed is due to the increased solar radiation values, which caused an increase in the air temperature
trapped under the glass cover because of the greenhouses’ phenomenon. The increase in temperature
reduces its density, which causes air to move towards the chimney [19]. It is also noted that the
measured air velocity rates for February are higher than the other two months due to the high values of
solar radiation, which is the primary driver of air movement in solar chimneys. The highest recorded
air velocity was 1.8 m/s for February at 1:00 pm. As mentioned previously, the air velocity was
measured at the inlet, middle, and chimney outlet. Figure 5 shows that the air velocity at the chimney
inlet is higher than the air velocity in the middle and the chimney outlet because of the effect of
friction and the decrease in air temperature while passing through the chimney. This behavior is
consistent with the published literature [20].
5INTCSET 2020 IOP Publishing
IOP Conf. Series: Materials Science and Engineering 1094 (2021) 012046 doi:10.1088/1757-899X/1094/1/012046
2
Inlet Chimney Velocity (m/s)
1.8
1.6
1.4
1.2
1
0.8
0.6
Vch,i(December) Vch,i(January) Vch,i(February)
0.4
0.2
0
10:00
10:30
11:00
11:30
12:00
12:30
13:00
13:30
14:00
14:30
15:00
15:30
16:00
9:00
9:30
Time (Hour)
Figure 4. Variation of the air velocity at the chimney base (chimney inlet) for different months.
2
Vch,in
1.8
Vch,mid
Chimney velocity (m/s)
1.6
Vch,out
1.4
1.2
1
0.8
0.6
0.4
0.2
0
10:00
10:30
11:00
11:30
12:00
12:30
13:00
13:30
14:00
14:30
15:00
15:30
16:00
9:00
9:30
Time (hour)
Figure 5. Variation of the air velocity inside the chimney at different locations for February.
5.2. Temperature of the solar cells
The high temperature of the solar cells causes a decrease in their efficiency, and therefore one of the
most important goals of the current article is to cool the solar cells and take advantage of the excess
heat to generate electricity by the technology of the solar chimney. Six solar panels were used and
distributed symmetrically. The thermal sensors are fixed to three plates on one side, and they are
named in the left, middle, and right cells to show their temperature. Figure (6) shows the change of
temperature for the three solar cells for the three months ( December, January, and February). It is
noted that the temperature of the solar panels increases to reach the highest temperature at 1 pm for the
three panels and other months and then decreases. The increase and decrease in the cell temperature
are related to the increase in solar radiation values during the first half of the day and its decrease in
the second half of the day [21]. It also turns out that the central solar cell was at a higher temperature
than other panels, and the reason is that its presence in the middle of the model reduces the impact of
the external wind on the solar panels, which contributed to reducing the temperature of the solar
6INTCSET 2020 IOP Publishing
IOP Conf. Series: Materials Science and Engineering 1094 (2021) 012046 doi:10.1088/1757-899X/1094/1/012046
panels installed in the ends (left and right solar cells). It is also noted that the temperatures of the solar
cells measured in February are higher than in December and January due to the high values of solar
radiation and the high temperature of February at the study site [22].
35
Tpv,l
30
Tpv,m
PV-Temperature (℃)
25 Tpv,r
20
15
10
5
0
10:00
10:30
11:00
11:30
12:00
12:30
13:00
13:30
14:00
14:30
15:00
15:30
16:00
9:00
9:30
Time (hour)
(a) PV Temperature for December
60
Tpv,l
PV-Temperature (℃)ا
50 Tpv,m
40 Tpv,r
30
20
10
0
11:00
10:00
10:30
11:30
12:00
12:30
13:00
13:30
14:00
14:30
15:00
15:30
16:00
9:00
9:30
Time (Hour)
(b) PV Temperature for January
70
Tpv,l
60 Tpv,m
PV-Temperature (℃)
50 Tpv,r
40
30
20
10
0
15:30
10:00
10:30
11:00
11:30
12:00
12:30
13:00
13:30
14:00
14:30
15:00
16:00
9:30
Time (Hour)
(c) PV temperature for February
Figure 6. PV temperature for different months.
5.3. Kinetic Power
The kinetic power of the system was calculated using Equation (8). Figure (7) shows the variation of
the kinetic power. It is noticed that the kinetic power rates increased in February due to the increase in
solar radiation [23], and the highest kinetic energy of 35 W was recorded at 1 pm in February. Also, it
is noticed that the increase of solar radiation led to an increase in the kinetic power during the day.
7INTCSET 2020 IOP Publishing
IOP Conf. Series: Materials Science and Engineering 1094 (2021) 012046 doi:10.1088/1757-899X/1094/1/012046
5.4. Electric Power and Thermal power
The solar cells are connected in series, and the total electrical power produced is calculated using
Equation ( 9 ). Figure (8) shows the change in the electric power produced during the day for various
months. It appears clearly that the rates of electrical power were at their highest levels in January due
to the decrease in solar cell temperature and the increase of solar radiation. As the published literature
indicates, the increase in the amount of incident solar radiation and the decrease in the solar cell
temperature at the same time leads to an increase in the electrical energy produced [24].
40
December
35
Jaunary
30
February
Kinetic Power (W)
25
20
15
10
5
0
12:30
10:00
10:30
11:00
11:30
12:00
13:00
13:30
14:00
14:30
15:00
15:30
16:00
9:00
9:30
Time (Hour)
Figure 7. Variation of the kinetic power.
1000
December
900
January
800
February
Electrical Power(W)
700
600
500
400
300
200
100
0
13:00
10:00
10:30
11:00
11:30
12:00
12:30
13:30
14:00
14:30
15:00
15:30
16:00
9:00
9:30
Time (Hour)
Figure 8. Variation of the electric power during the day for different months.
The results also showed that increasing the values of solar radiation leads to an increase in the amount
of thermal power in the system, which is calculated using Equation (2) and these results are shown in
Figure (9), and this heat can be used for home uses such as heating, water heating, etc. The thermal
power in February was higher than the other months due to the high values of solar radiation, and the
maximum value for the thermal power was 284 W at 1 pm. Simultaneously, the lowest value for
thermal efficiency during the day was in December, which is identical to the results published in [25].
8INTCSET 2020 IOP Publishing
IOP Conf. Series: Materials Science and Engineering 1094 (2021) 012046 doi:10.1088/1757-899X/1094/1/012046
300
December
275
January
250
February
225
Heat Energy (W)
200
175
150
125
100
75
50
25
0
10:00
10:30
11:00
11:30
12:00
12:30
13:00
13:30
14:00
14:30
15:00
15:30
16:00
9:00
9:30
Time (Hour)
Figure 9. Variation of the heat power during the day in different months.
5.5. Efficiency of the system
The electrical efficiency of photovoltaic systems is the most crucial factor in determining the
suitability of these systems for different uses. The electrical efficiency of the PV/solar chimney is
calculated using Equation (6). Figure (10) shows the change of the hourly electrical efficiency during
the day. It is noted that the shape of the change in electrical efficiency is concave up. In all the
considered months, high-efficiency values are observed in the early morning hours due to the low
temperature of the solar cells. The highest recorded electrical efficiency value was 17.8% in
December. This behavior is normal and has been observed in previous research that deals with the
study of PV/T solar systems, such as in [26]. Figure (11) shows the change of the hourly thermal
efficiency during the day. The thermal efficiency in February was higher than the other months due to
the high values of solar radiation, and the maximum value for this efficiency was 68% at 12:30 noon.
In comparison, the lowest value for thermal efficiency during the day was in December, which is
identical to the results published in [27].
19
17
Electrical Efficiency (%)
15
13
11
9
December January
February December)( متعدد الحدود
7
January)( متعدد الحدود February)( متعدد الحدود
5
11:30
14:00
10:00
10:30
11:00
12:00
12:30
13:00
13:30
14:30
15:00
15:30
16:00
9:00
9:30
Time (Hour)
Figure 10. The change of the hourly electrical efficiency during the day.
9INTCSET 2020 IOP Publishing
IOP Conf. Series: Materials Science and Engineering 1094 (2021) 012046 doi:10.1088/1757-899X/1094/1/012046
80
December
70
January
60
Thermal Efficiency (%)
February
50
40
30
20
10
0
10:30
10:00
11:00
11:30
12:00
12:30
13:00
13:30
14:00
14:30
15:00
15:30
16:00
9:00
9:30
Time (Hour)
Figure 11. The change of the hourly thermal efficiency during the day.
6. Conclusions and recommendations
From the results obtained, the following observations were concluded:
1- The air velocity at the chimney inlet is higher than the air velocity in the middle and the
chimney outlet. The highest recorded air velocity was 1.8m/s in February at 1:00 pm.
2- The results indicated the solar cell location determines the degree of its temperature, as the
solar cells in the middle are characterized by high temperatures, while the solar cells that are
on the ends are at a lower temperature.
3- The air velocity inside the chimney and the solar cell temperature depends mainly on the
surrounding weather conditions.
4- In all the considered months, high-efficiency values are observed in the early morning hours
due to the low temperature of the solar cells.
5- The highest recorded electrical efficiency value was 17.8% in December.
7. References
[1] O K Ahmed 2018 A Numerical and Experimental Investigation for a Triangular Storage
Collector (Sol Energy) vol 171 pp 884–892
[2] H Nasraoui, Z Driss, A Ayedi and H Kchaou 2019 Numerical and Experimental Study of the
Aerothermal Characteristics in Solar Chimney Power Plant with Hyperbolic Chimney Shape
(Arab J Sci Eng) vol 44 no 9 pp 7491–7504
[3] C B Maia, F V M Silva, V L C Oliveira and L L Kazmerski 2019 An Overview of the use of
Solar Chimneys for Desalination (Sol Energy) vol 183 pp 83–95
[4] Zou Z, Gong H, Wang J and Xie S 2017 Numerical Investigation of Solar Enhanced Passive
Air Cooling System for Concentration Photovoltaic Module Heat Dissipation (J. Clean.
Energy Technol) vol 5 no 3 pp 3–8
[5] A B Kasaeian, S Molana, K Rahmani and D Wen 2017 A Review on Solar Chimney Systems
(Renew Sustain Energy Rev) vol 67 pp 954–987
[6] O K Ahmed, A S Hussein, R W Daoud and Z H Ali 2020 A New Method to Improve the
Performance of Solar Chimneys (in AIP Conference Proceedings) vol 2213
[7] D Eryener, J Hollick and H Kuscu 2017 Thermal Performance of a Transpired Solar Collector
Updraft Tower (Energy Convers Manag) vol 142 pp 286–295
10INTCSET 2020 IOP Publishing
IOP Conf. Series: Materials Science and Engineering 1094 (2021) 012046 doi:10.1088/1757-899X/1094/1/012046
[8] D Eryener and H Kuscu 2018 Hybrid Transpired Solar Collector Updraft Tower (Sol Energy)
vol 159 pp 561–571
[9] N Fadaei, A Kasaeian, A Akbarzadeh and S H Hashemabadi 2018 Experimental Investigation of
Solar Chimney with Phase Change Material (PCM) (Renew Energy) vol 123 pp 26–35
[10] L Boutina, A Khelifa, K Touafek, M Lebbi and M T Baissi 2018 Improvement of PVT Air-
Cooling by the Integration of a Chimney Tower (CT/PVT) (Appl Therm Eng) vol 129 pp
1181–1188
[11] H H Al-Kayiem and O C Aja 2016 Historic And Recent Progress In Solar Chimney Power
Plant Enhancing Technologies (Renew Sustain Energy Rev) vol 58 pp 1269–1292
[12] X Zhou, J Yang, J Wang and B Xiao 2009 Novel Concept For Producing Energy Integrating A
Solar Collector With A Man Made Mountain Hollow (Energy Convers Manag) vol 50 no 3
pp 847–854
[13] O K Ahmed and Z A Mohammed 2017 Influence of Porous Media on the Performance of
Hybrid PV/Thermal Collector (Renew Energy) vol 112 pp 378–387
[14] K S Ong and C C Chow 2003 Performance of a Solar Chimney (Sol Energy) vol 74 pp 1–17
[15] A Koonsrisuk and T Chitsomboon 2013 Mathematical Modeling of Solar Chimney Power
Plants (Energy) vol 51 pp 314–322
[16] X Zhou, J Yang, B Xiao and G Hou 2007 Simulation of a Pilot Solar Chimney Thermal Power
Generating Equipment (Renew Energy) vol 32 no 10 pp 1637–1644
[17] O K Ahmed, K I Hamada and A M Salih 2019 Enhancement of the Performance of
Photovoltaic / Trombe Wall System using the Porous Medium : Experimental and
Theoretical Study (Energy) vol 171 pp 14–26
[18] R S Figliola and D E Beasley 1996 Theory and Design for Mechanical Measurements(Meas Sci
Technol) vol 7 no7
[19] M A Al-Dabbas 2011 A Performance Analysis of Solar Chimney Thermal Power Systems
(Therm Sci) vol 15 no 3 pp 619–642
[20] M O Hamdan 2011 Analysis of A Solar Chimney Power Plant in the Arabian Gulf Region
(Renew Energy) vol 36 no 10 pp 2593–2598
[21] O K Ahmed, K I Hamada and A M Salih 2019 Performance Analysis of PV/Trombe with Water
and Air Heating System: an Experimental and Theoretical Study (Energy Sources, Part A
Recover Util Environ Eff) vol 86 pp 716–722
[22] O K Ahmed and Z A Mohammed 2017 Dust effect on the Performance of the Hybrid
PV/Thermal Collector (Therm Sci Eng Prog)
[23] S Kiwan, M Al-Nimr and I Salim 2020 A Hybrid Solar Chimney/Photovoltaic Thermal System
for Direct Electric Power Production and Water Distillation (Sustain Energy Technol
Assessments) vol 38 p 100680
[24] N Gupta, A Tiwari and G N Tiwari 2017 A Thermal Model of Hybrid Cooling Systems for
Building Integrated Semitransparent Photovoltaic Thermal System (Sol Energy) vol 153 pp
486–498
[25] K A Omer and A M Zala 2018 Experimental Investigation Of PV/Thermal Collector With
Theoretical Analysis (Renew Energy Focus) vol 27 pp 67–77
[26] D Chemisana, J I Rosell, A Riverola and C Lamnatou 2016 Experimental Performance of a
Fresnel-Transmission PVT Concentrator for Building-Façade Integration (Renew Energy)
vol 85 pp 564–572
[27] P Guo, Y Wang, Q Meng and J Li 2016 Experimental Study on an Indoor Scale Solar Chimney
Setup in an Artificial Environment Simulation Laboratory (Appl Therm Eng) vol 107 pp
818–826
11You can also read