River Murray Weekly Report
←
→
Page content transcription
If your browser does not render page correctly, please read the page content below
River Murray Weekly Report
For the week ending Wednesday, 16 June 2020
Trim Ref: D21/25021
Rainfall and inflows
Rainfall was widespread across most of the southern Basin this week (Map 1). The Bureau of Meteorology (BoM)
reported a cold front moved across south-east Australia at the start of the week and this was then followed by a
large complex low pressure system that developed in central New South Wales and eastern Victoria. In the
Australian Alps, the low system resulted in snowfall at Perisher, Falls Creek, Mt Hotham and Mt Buller.
Weekly rainfall in NSW included 32 mm at Hume Dam and 25 mm at Hay on the Murrumbidgee river. In Victoria,
the Ovens river at Harrietville recorded 69 mm and Eildon Dam recorded 38 mm, while Mount Buller recorded
75 mm contributing to snow base. In South Australia, Renmark recorded 4.2 mm while Goolwa recorded 27 mm.

Map 1 – Murray-Darling Basin rainfall for the week ending 9 June 2021. Source: Bureau of Meteorology.

BoM are forecasting further rainfall in the coming days, with totals of between 50 and 100 mm along the ranges in
the upper Murray catchment.

There was no significant response to rainfall in the upper Murray catchments this week. Specific information about
flows at key locations can be found at the MDBA’s River Murray data webpage.

     Subscribe to the River Murray Weekly Report                    River Data website                  Water in Storages
River Murray Weekly Report

River operations
   •     Total active storage increasing
   •     Operational releases from Menindee Lakes ceased with baseflows now supporting the Lower Darling
   •     Stevens Weir pool lowered over winter
   •     Mildura Weir pool lowering planned for mid-July

River Levels
River users can monitor River Murray levels and flow forecasts at key locations on the MDBA’s River Murray data
webpage to assist in planning any river activities. Up-to-date river data for sites can also be found on BoM’s
website, at the WaterNSW real-time data website, Victoria’s DELWP water monitoring website and South Australia’s
WaterConnect website.

Water quality impacts
The Murray and Lower Darling Regional Algal Coordinating Committee has amber alerts in place for blue-green
algae at several sites on the River Murray and Kolety/Edward-Wakool River systems. The locations of these sites are
available on the WaterNSW website. It is important that water users regularly keep up to date with algal alerts,
notices, and health warnings. This information is available through Goulburn-Murray Water and WaterNSW.

River operations
Total active storage increased by 131 GL over the last week to 4,734 GL (58% capacity).
At Dartmouth Reservoir, the storage increased 23 GL last week to 2,497 GL (65% capacity). The release, measured
at Colemans gauge, is targeting 250 ML/day.

Photo 1 – Confluence of Fainter and Rocky valley creek in the upper Murray (Image courtesy Hugo Bowman)

       Subscribe to the River Murray Weekly Report                River Data website                      Water in Storages
River Murray Weekly Report
Over the past week the Hume Reservoir storage increased by 68 GL to 1,480 GL (49% capacity). The current release
is 600 ML/day to facilitate maintenance works at the dam. Over the coming week, the release is expected to
remain near 600 ML/day. Downstream on the Kiewa and Ovens rivers rainfall has seen each tributary increase to
near 2,000 ML/day at Bandiana and 2,700 ML/day at Wangaratta.
The Lake Mulwala level is currently near 124.85 m AHD, within the normal operating range (124.6 to 124.9 m AHD).
Diversions to Mulwala Canal and Yarrawonga Main Channel ceased for the 2020-21 water year on 15 May. The
release from Yarrawonga Weir averaged around 4,800 ML/day throughout the week and may increase to above
5,000 ML/day over the coming week as higher flows are received from the Kiewa and Ovens.
The regulator gates at Kolety (pronounced Kol-etch)/Edward River and Gulpa Offtakes remain out of the water,
meaning flows into these systems are varying with River Murray levels. Downstream on the Kolety/Edward River at
Stevens Weir, the pool is being lowered and the regulator gates are expected to be removed from the water in the
coming days. Whilst the pool is lowered, and flow in the Kolety/Edward River is low, there will be no flow into
Wakool River or Yallakool and Colligen Creeks. Flows downstream of Stevens Weir are expected to vary around
800 ML/day over the coming week.
On the Goulburn River, the flow measured at McCoys Bridge averaged around 1,000 ML/day. The flow is being
managed above the normal minimum flow of 350 ML/day for the benefit of native fish in the lower Goulburn River,
using entitlements held by environmental water holders. No IVT deliveries are planned for June. For more
information see the Goulburn-Murray Water website. Information regarding opportunities for allocation trade
between the Goulburn and Murray Valleys is available at the Victorian water register website.
Diversions to National Channel have remained around 300 ML/day and are expected to remain at this level until at
least the end of June. Water is being used to maintain base flows in the Pyramid Creek system and Kerang Weir on
behalf of environmental water holders. The release from Torrumbarry Weir averaged around 3,600 ML/day and is
expected to increase to around 4,600 ML/day over the coming week.
The Torrumbarry Weir pool has been lowered to 85.77 m AHD, around 30 cm below the full supply level (FSL). The
pool will continue to be varied between 30 cm below FSL and FSL over the coming months as part of the weir pool
variability program. Over the coming week the pool level is expected to be around 20 to 30 cm below FSL. Varying
pool levels helps restore a more natural wetting and drying cycle to riverbanks and adjacent wetlands within the
influence of the weir pool. The lowering of the pool will also assist Goulburn-Murray Water with maintenance works
at the weir in mid-June. River users and landholders in the weir pool should remain aware of the changing water
level in case adjustments need to be made to pumps, moorings and recreational activities.
Inflow from the Murrumbidgee River, measured at Balranald averaged 800 ML/day, but is expected to ease over
the coming week. No Murrumbidgee IVT has been ordered for June. The Murrumbidgee IVT balance is currently
around 96.6 GL and closed for trade to the Murray. In the upper Murrumbidgee, Blowering and Burrunjuck storages
levels are at 96% and 82% and have increased their releases to near 8,000 ML/day and 2,600 ML/day respectively.
In the Murrumbidgee, WaterNSW has declared periods for access to supplementary water.
At Euston Weir, the weir pool level is targeting around 20 to 30 cm below the FSL as part of normal weir pool
variability. The downstream release has averaged 6,700 ML/day and is expected to reduce over the coming days to
near 5,400 ML/day.
Pumping into the Hattah lakes system has reduced since last week and will cease in the coming days. Around 30 GL
will have been delivered to fill a number of lakes and provide benefits to the aquatic environment, wetland plants
and animals. This action is being undertaken on behalf of environmental water holders.
At Mildura Weir, essential maintenance works will be undertaken in July. To enable these works the weir will be
lowered and the trestles removed. Lowering will commence on Monday 12 July. The last boat passage through the
Mildura Lock will be 4:30 pm on Tuesday 13 July. The pool will return to FSL by mid-August. More information is
available here. (Please note, these dates and link to the media release have been corrected. Previous weekly
reports included wrong information).

    Subscribe to the River Murray Weekly Report             River Data website                   Water in Storages
River Murray Weekly Report
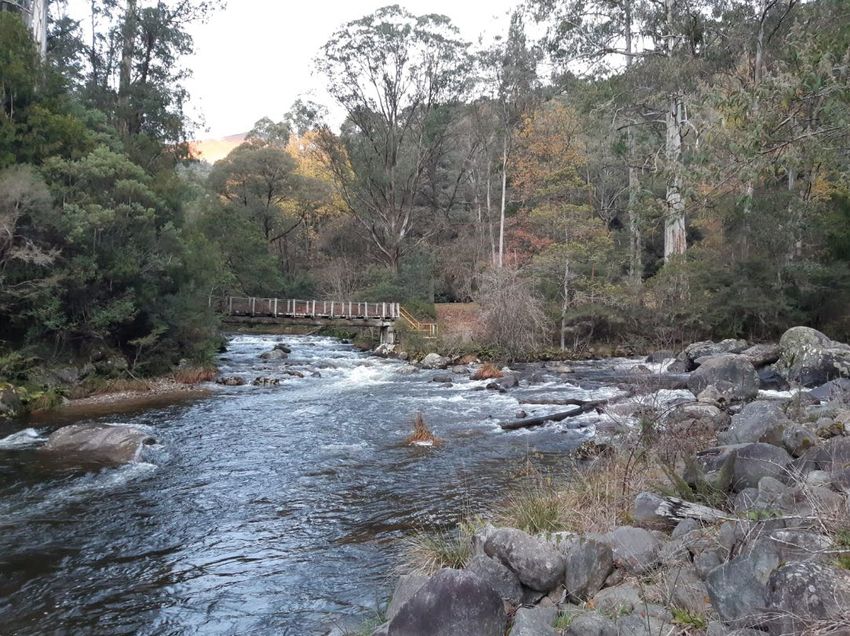
Photo 2 – Boundary Bend on the Murray (Image courtesy A Craig)
At Menindee Lakes, total volume in storage increased by 6 GL to 1084 GL (63% capacity) this week. WaterNSW are
managing the inflows and releases from the storage to ensure Lake Wetherell and Lake Pamamaroo are storing the
maximum volume possible when inflows cease. Lake Pamamroo is limited to a maximum level of 61.28 m AHD, as
this is the top of gate level for Menindee Inlet. Lake Wetherell will be limited to 61.88 m AHD due to the structural
stability of the Pamamaroo Inlet regulator. More information is available from WaterNSW’s WaterInsights.
Inflows to Menindee Lakes have continued to recede over the week with the flow upstream at Wilcannia steadying
out at around 1,600 ML/day. Over the last few weeks water was released from Menindee Lakes to help meet River
Murray system requirements. The additional releases are now completed and releases have dropped back to
500 ML/day. For the remainder of June, environmental water holder’s plan to use their entitlements to maintain
the flow at Weir 32 at around 500 ML/day for the benefit of native fish in the Barka/lower Darling River. A total of
close to 60 GL was released from the Menindee Lakes to support River Murray system requirements. Flow rates
were adjusted to also improve environmental outcomes in the Barka/lower Darling River.
Over the coming months, the MDBA will continue to revise forecasts and operational plans to determine the
volume and timing of water released from Menindee Lakes to support the Murray system. This process will be on-
going and will take account of the operating rules of the Murray-Darling Basin Agreement, the ‘Objectives and
Outcomes for River Operations in the River Murray System’ as well as the more specific opportunities and risks
driven by system conditions, water security, delivery efficiency, and environmental and community considerations.
Further updates will be provided in the Annual Operating Outlook (published by the MDBA at the end of July) and
future weekly reports as updated plans and release decisions are made. More information on the management of
Menindee lakes is also available in a webinar hosted by the MDBA in May 2021.
At Wentworth Weir, the weir pool level continues to be managed around FSL. The downstream flow increased to
around 8,700 ML/day this week but is expected to decrease to near 6,000 ML/day over the coming week as inflows
Subscribe to the River Murray Weekly Report River Data website Water in StoragesRiver Murray Weekly Report
from the Barka/lower Darling recede. Just upstream of Wentworth Weir at Curlwaa, the Abbotsford Bridge will be
closed in mid-July for up to 10 weeks. This is to allow essential maintenance work to upgrade its mechanical lift
span. More information can be found here.
At Lock 9 the weir pool continues to vary around the FSL. The Lock 8 weir pool is currently around 35 cm below FSL.
Lock 7 is targeting around 55 cm above FSL and will continue to vary near this level to facilitate increased flows into
Lindsay River and enable pumping into Lake Wallawalla during June for environmental outcomes.
The storage at Tar-ru/ Lake Victoria increased by 34 GL to 347 GL (51% capacity).
The flow to South Australia is currently targeting 3,000 ML/day. During the first three weeks of June, the flow to
South Australia is being maintained at this rate whilst SA Water undertakes their annual run-of-river salinity
monitoring from Lock 7 to Morgan. Run-of-river surveys measure salinity at each kilometre along the river and the
difference in electric conductivity (EC) on consecutive days is assumed to be due to saline inflow. The data from the
survey is analysed to assess salt loads to the River Murray and identifies locations for notable salt inflow so that
future efforts to manage salinity can be targeted. From around the 18th June flows will begin to increase over the
next week to near 5,000 ML/day.
The Lower Lakes 5-day average water level is 0.66 m AHD. Barrage releases will continue to be made, when
conditions allow, to push fresh water into the Coorong to support a productive environment for fish and birds. For
information on barrage releases and South Australia’s Entitlement flow, see the South Australian Department for
Environment and Water Weekly River Murray Flow Report.
For media inquiries contact the Media Officer on 02 6279 0141
ANDREW REYNOLDS
Executive Director, River Management
Subscribe to the River Murray Weekly Report River Data website Water in StoragesRiver Murray Weekly Report
Water in Storage Week ending Wednesday 16 Jun 2021
Full Full Current Change in Total
Dead Active
MDBA Storages Supply Supply Storage Current Storage Storage for the
Storage Storage
Level Volume Level Week
(m AHD) (GL) (m AHD) (GL) % (GL) (GL) (GL)
Dartmouth Reservoir 486.00 3 856 462.49 2 497 65% 71 2 426 +23
Hume Reservoir 192.00 3 005 182.80 1 480 49% 23 1 457 +68
Lake Victoria 27.00 677 24.02 347 51% 100 247 +34
Menindee Lakes 1 731* 1 084 63% (480 #) 604 +6
Total 9 269 5 408 58% -- 4 734 +131
Total Active MDBA Storage 55% ^
Major State Storages
Burrinjuck Reservoir 1 026 841 82% 3 838 +18
Blowering Reservoir 1 631 1 565 96% 24 1 541 +41
Eildon Reservoir 3 334 1 900 57% 100 1 800 +57
* Menindee surcharge capacity – 2050 GL ** All Data is rounded to nearest GL **
# NSW has sole access to water when the storage falls below 480 GL. MDBA regains access to water when the storage next reaches 640 GL.
^ % of total active MDBA storage
Snowy Mountains Scheme Snowy diversions for week ending 15 Jun 2021
Storage Active Storage (GL) Weekly Change (GL) Diversion (GL) This Week From 1 May 2021
Lake Eucumbene - Total 666 n/a Snowy-Murray +38 146
Snowy-Murray Component 467 n/a Tooma-Tumut +6 25
Target Storage 1 240 Net Diversion 32 121
Murray 1 Release +45 179
Major Diversions from Murray and Lower Darling (GL) *
New South Wales This Week From 1 July 2020 Victoria This Week From 1 July 2020
Murray Irrig. Ltd (Net) -0.1 626 Yarrawonga Main Channel (net) 0 211
Wakool Sys Allowance -0.1 114 Torrumbarry System + Nyah (net) 0 369
Western Murray Irrigation 0.1 27 Sunraysia Pumped Districts 0.2 109
Licensed Pumps 0.7 261 Licensed pumps - GMW (Nyah+u/s) 0.2 43
Lower Darling 0.0 3 Licensed pumps - LMW 0.6 433
TOTAL 0.6 1031 TOTAL 1 1165
* Figures are derived from actual and estimates where data is unavailable. Please note that not all data may have been available at the time of creating
this report. ** All data above is rounded to nearest 100 ML for weekly data and nearest GL for cumulative data
Flow to South Australia (GL) Entitlement this month 90.0 *
* Flow to SA will be greater than normal entitlement for Flow this week 20.9 (3 000 ML/day)
this month due to environmental flows.
Flow so far this month 48.0
Flow last month 126.6
Salinity (EC) (microSiemens/cm at 25o C)
Current Average over the last week Average since 1 August 2020
Swan Hill 80 80 90
Euston - - -
Red Cliffs 100 110 120
Merbein - 120 130
Burtundy (Darling) 360 370 400
Lock 9 230 200 130
Lake Victoria 220 150 120
Berri 170 170 170
Waikerie 260 260 220
Morgan 290 270 220
Mannum 270 270 240
Murray Bridge 310 300 260
Milang (Lake Alex.) 730 730 750
Poltalloch (Lake Alex.) 560 570 980
Meningie (Lake Alb.) 1 530 1 560 1 660
Goolwa Barrages 2 720 3 630 1 590
Subscribe to the River Murray Weekly Report River Data website Water in StoragesRiver Levels and Flows Week ending Wednesday 16 Jun 2021
Minor Flood Average Flow this Average Flow last
Gauge Height Flow Trend
Stage Week Week
local (m
River Murray (m) (m) AHD) (ML/day) (ML/day) (ML/day)
Khancoban - - - 8 610 F 8 070 3 090
Jingellic 4.0 2.61 209.13 12 990 F 10 700 5 340
Tallandoon ( Mitta Mitta River ) 4.2 1.49 218.38 730 F 950 720
Heywoods 5.5 1.46 155.09 600 S 1 090 1 690
Doctors Point 5.5 1.77 150.24 2 720 S 3 080 2 830
Albury 4.3 0.93 148.37 - - - -
Corowa 4.6 0.92 126.94 2 970 F 3 610 2 750
Yarrawonga Weir (d/s) 6.4 0.90 115.94 5 060 S 4 840 3 700
Tocumwal 6.4 1.41 105.25 4 950 R 4 520 3 670
Torrumbarry Weir (d/s) 7.3 1.68 80.23 4 420 R 3 700 3 710
Swan Hill 4.5 0.88 63.80 3 820 R 4 000 4 240
Wakool Junction 8.8 2.36 51.48 5 360 F 5 540 6 060
Euston Weir (d/s) 9.1 1.26 43.10 6 500 F 6 660 7 020
Mildura Weir (d/s) - - 6 130 F 6 130 5 510
Wentworth Weir (d/s) 7.3 2.98 27.74 8 480 F 8 720 6 750
Rufus Junction - 2.73 19.66 2 510 R 2 570 2 610
Blanchetown (Lock 1 d/s) - 0.58 - 2 600 R 2 490 2 450
Tributaries
Kiewa at Bandiana 2.8 1.97 155.20 1 950 F 1 790 930
Ovens at Wangaratta 11.9 8.79 146.47 2 740 R 2 610 880
Goulburn at McCoys Bridge 9.0 1.63 93.05 1 220 R 1 060 1 010
Edward at Stevens Weir (d/s) 5.5 0.97 80.74 680 F 760 900
Edward at Liewah - 1.83 57.21 1 130 R 1 090 1 150
Wakool at Stoney Crossing - 1.32 54.81 280 F 320 400
Murrumbidgee at Balranald 5.0 1.07 57.03 680 F 780 740
Barwon at Mungindi 6.1 3.49 - 830 R 800 1 020
Darling at Bourke 9.0 4.33 - 1 800 F 1 900 2 200
Darling at Burtundy Rocks - 1.65 - 2 280 F 2 730 2 120
Natural Inflow to Hume 9 360 3 570
(i.e. Pre Dartmouth & Snowy Mountains scheme)
Weirs and Locks Pool levels above or below Full Supply Level (FSL)
Murray FSL (m AHD) u/s d/s FSL (m AHD) u/s d/s
Yarrawonga 124.90 -0.05 - No. 7 Rufus River 22.10 +0.59 +0.43
No. 26 Torrumbarry 86.05 -0.22 - No. 6 Murtho 19.25 -0.06 -0.02
No. 15 Euston 47.60 -0.29 - No. 5 Renmark 16.30 +0.03 +0.10
No. 11 Mildura 34.40 +0.06 +0.10 No. 4 Bookpurnong 13.20 +0.05 +0.33
No. 10 Wentworth 30.80 -0.01 +0.34 No. 3 Overland Corner 9.80 +0.06 +0.21
No. 9 Kulnine 27.40 -0.04 -0.35 No. 2 Waikerie 6.10 +0.11 +0.00
No. 8 Wangumma 24.60 -0.34 +0.61 No. 1 Blanchetown 3.20 -0.04 -0.17
Lower Lakes FSL = 0.75 m AHD
Lake Alexandrina average level for the past 5 days (m AHD) 0.66
Barrages Fishways at Barrages
Openings Level (m AHD) No. Open Rock Ramp Vertical Slot 1 Vertical Slot 2 Dual Vertical Slots
Goolwa 128 openings 0.68 1 - Open Open -
Mundoo 26 openings 0.69 All closed - - - Open
Hunters Creek - - - - Open - -
Boundary Creek 6 openings - All closed - Open - -
Ewe Island 111 gates - All closed - - - Open
Tauwitchere 322 gates 0.70 2 Open Open Open -
AHD = Level relative to Australian Height Datum, i.e. height above sea level
Subscribe to the River Murray Weekly Report River Data website Water in StoragesWeek ending Wednesday 16 Jun 2021
State Allocations (as at 16 Jun 2021)
NSW - Murray Valley Victorian - Murray Valley
High security 97% High reliability 100%
General security 50% Low reliability 0%
NSW – Murrumbidgee Valley Victorian - Goulburn Valley
High security 100% High reliability 100%
General security 100% Low reliability 0%
NSW - Lower Darling South Australia – Murray Valley
High security 100% High security 100%
General security 100%
NSW : https://www.industry.nsw.gov.au/water/allocations-availability/allocations/summary
VIC : http://nvrm.net.au/seasonal-determinations/current
SA : https://www.environment.sa.gov.au/topics/river-murray/water-allocations-and-announcements
Subscribe to the River Murray Weekly Report River Data website Water in StoragesYou can also read