Main Street Insights: User Guide - AIB Merchant ...
←
→
Page content transcription
If your browser does not render page correctly, please read the page content below
Main Street Insights: User Guide
At AIB Merchant Services, we understand that the everyday tools and how
you use them are what can set your business apart from others, but we also
get that you only have two pairs of hands, and juggling everything else can
be overwhelming.

With Main Street Insights, everything you need to know about your business
is right at your fingertips, giving you access to data that will not only help you
understand your business better, but can help you grow it too.

This user guide will give you everything you need to familiarise yourself with
Main Street Insights, but if you have any further questions, please reach out
to us at www.aibms.com/mainstreetinsights or call 1850 200 417.
Contents

Logging In ........................................................................................................... 4
Getting Started ................................................................................................... 5
My Dashboard .................................................................................................... 6
       Story Cards .................................................................................................................... 7
       Samples of Story Cards .............................................................................................. 8
       New Customers ........................................................................................................... 8
       Wrap Up for Last Month ............................................................................................ 8
       Top Customer Segments ............................................................................................ 8
       Wrap Up for Last Week .............................................................................................. 8
       Last Week’s Wins .......................................................................................................... 9
       Revenue For a Day....................................................................................................... 9
       Week’s Biggest Average Spend............................................................................... 10
       You vs. Similar Businesses ........................................................................................ 10
       Week’s Biggest Average Spend (Age) .................................................................... 11
       Setting Goals .............................................................................................................. 12

My Store ............................................................................................................ 14
       Myself Last Year.......................................................................................................... 15
       Similar Businesses ...................................................................................................... 16
       Adding a Bookmark .................................................................................................. 18
       Days of the Week Breakdown ................................................................................. 19

My Customers .................................................................................................. 20
       How Far they Travelled this Week ........................................................................... 21
       How Frequently They Visited ................................................................................... 21
       Highest Revenue Day ............................................................................................... 21
       Highest Revenue Hour ............................................................................................. 21
       Most Transactions Day .............................................................................................. 22
       Most Transactions Hour ........................................................................................... 22
       Transaction Metrics ................................................................................................... 22

My Neighbourhood ........................................................................................ 23
       Where Customers Spend ......................................................................................... 23
       Customer’s Spend ..................................................................................................... 24
       Where Customers Live ............................................................................................. 24
       Customer Location .................................................................................................... 25

My Bookmarks .................................................................................................. 26

My Social Media .............................................................................................. 27

Notifications ...................................................................................................... 30

Thank You .......................................................................................................... 31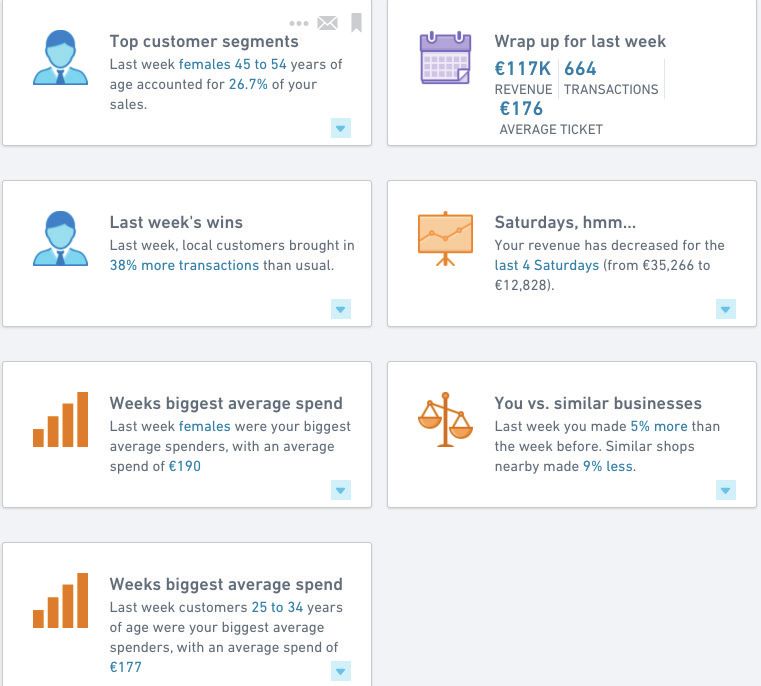
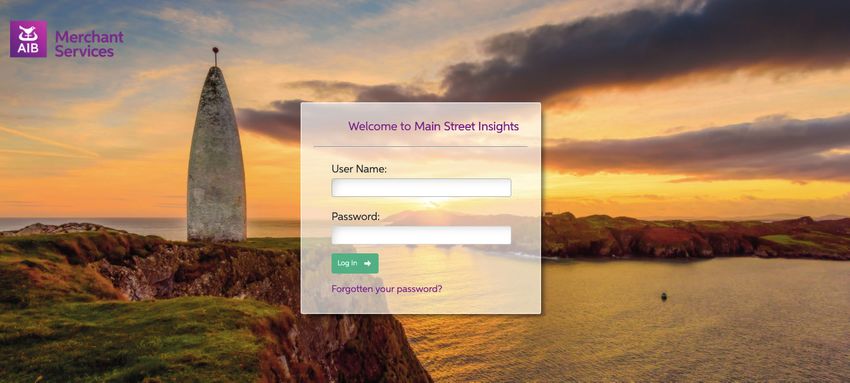
Logging In
To log in, all you need to do is go to aibms.mainstreetinsights.fiservapps.com.

Your username and password will have been sent to you in an email from noreply@aibms.com.

Enter the login details provided and press Log In.

                                                                                  Logging In   4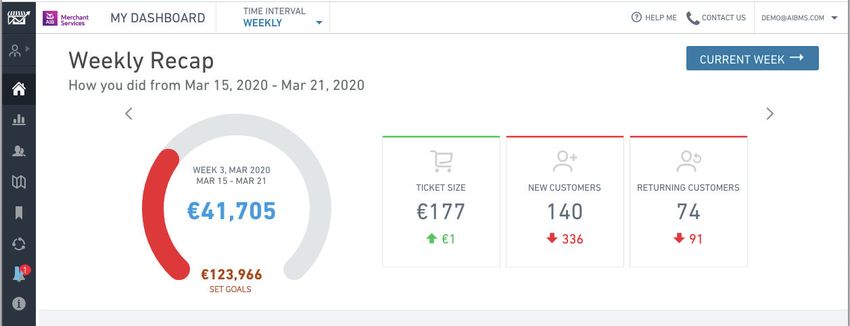
Getting Started
With Main Street Insights, everything you need to know about your business is right at your fingerprints.
We’ve broken them into a number of categories so you can navigate things that little bit easier.

         My Dashboard

 CAFÉ
         My Store

         My Customers

         My Neighbourhood

         My Bookmarks

         My Social Media

         Notifications

                                                                                   Getting Started          5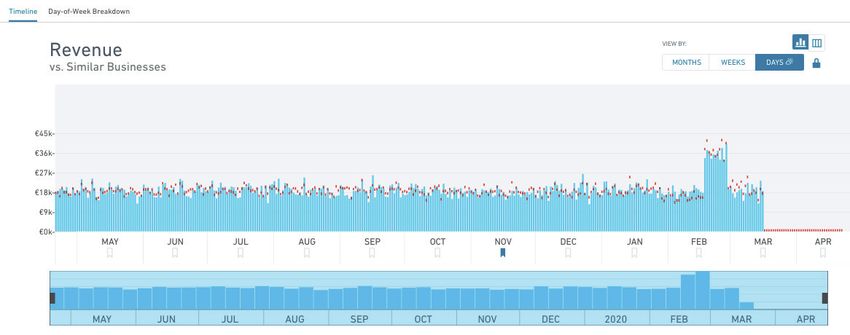
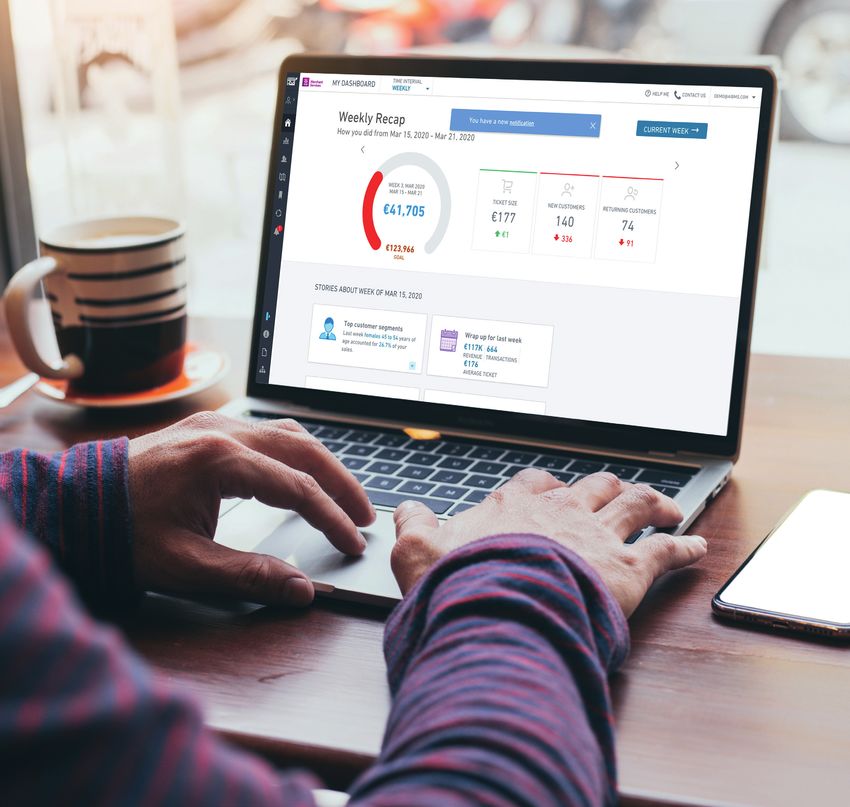
My Dashboard
Access My Dashboard by clicking on the icon on the side navigation.
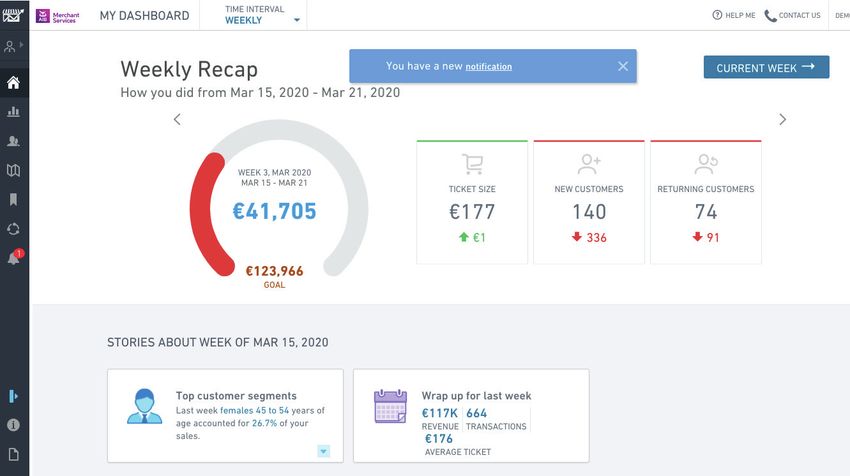
My Dashboard is your landing page when you log in to Main Street Insights. It provides you with a summary
snapshot of how your business is performing at present.
1. Greeting/Welcome message
This greeting sits at the top of the dashboard and changes depending on the time of day.
2. Time Interval
By selecting Weekly, Monthly or Yearly, you can view your transaction and customer information for the
selected time period. Time intervals are something you’ll find throughout Main Street Insights, helping
you get as narrow or wide a view of your business as you need.
3. Help me/Contact Us
The Help Me section provides additional information to help explain the figures on the dashboard,
while Contact Us provides you with the AIBMS contact number for Main Street Insights support.
4. Weather
This feature shows the weather for the day you have logged into your account. The weather is stored
each day, so that in the future when you’re looking back on past business performance, you can see if the
weather had an impact on your sales on a particular day.
5. Goal Progress Indicator
We encourage you to set a weekly, monthly or yearly goal for your business (see section X for information
on how to set a goal). Progress against your goal is displayed here, so you can see how things stack up and
make changes if necessary.
6. Ticket Size/New Customers/Returning Customers
Ticket Size is the average amount a customer spends in your store and is calculated by adding up the value
of all of the card transactions over the period and dividing the total value by the number of transactions
New Customers show the number of customers who have recently used a card to make a first-time
purchase in your store.
Returning Customers are customers who have previously made a card purchase at your store and
have returned.
My Dashboard 6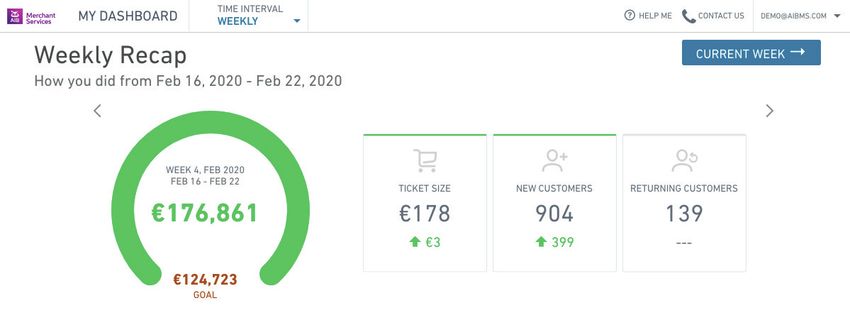
Story Cards
On your dashboard you’ll see various story cards showing you a brief snippet of your revenue and customer
behaviour for that period. These story cards change depending on the weekly, monthy or yearly view
you’ve selected.

1.   Top Customer Segments
     This shows you the top gender and age profile of your customers.

2.   Wrap Up For Last Week
     Here, you’ll see a summary of your revenue, transactions and average ticket for that week.

3.   Last Week’s Wins
     Want to see how this week compares to the last? This indicates if there was an improvement in either your
     customers or revenue versus the previous week.

4. Week’s Average Spend (Gender)
   This shows you the gender that makes up the majority of your customer base and how much one gender
   spent versus the other that given week.

5.   You vs Similar Businesses
     If you’re looking for a comparison between your revenue and the revenue of similar businesses near your
     location, you’ll find everything you need here.

6.   Week’s Average Spend (Age)
     This shares the average age range of your strongest customer segment and how much the average spend
     is of each.

                                                                                     My Dashboard                7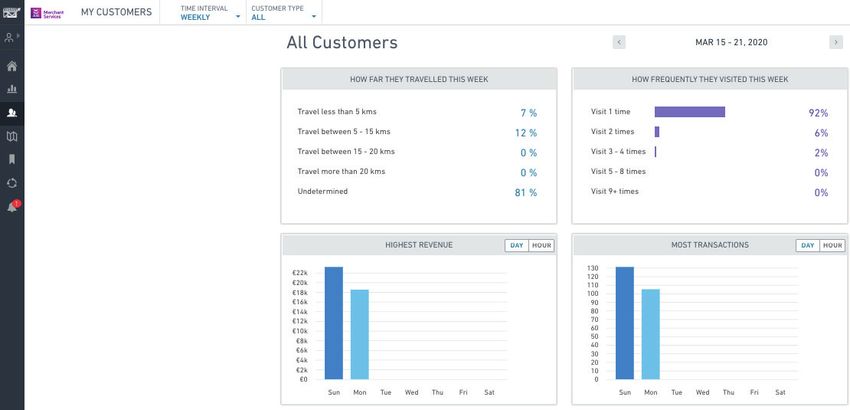
Samples of Story Cards
New Customers
New customer stories shows a breakdown of your
new, returning, local and non-local customers.

Note: The algorithm estimates local customers as those that live
within 10km of your store based on their spending patterns.
Non-local customers are customers living more than 10km
from your store.

Wrap Up for Last Month
This story card provides a summary of your
Revenue, Transactions and Average Ticket Value
for the past month.

Top Customer Segments
Want to get a better sense of who’s visiting your
store? This story card breaks down your revenue by
customer’s gender and age profile.

Wrap Up for Last Week
Here, you’ll find a summary of your Revenue,
Transactions and Average Ticket
Value for the past week.

                                                                   My Dashboard   8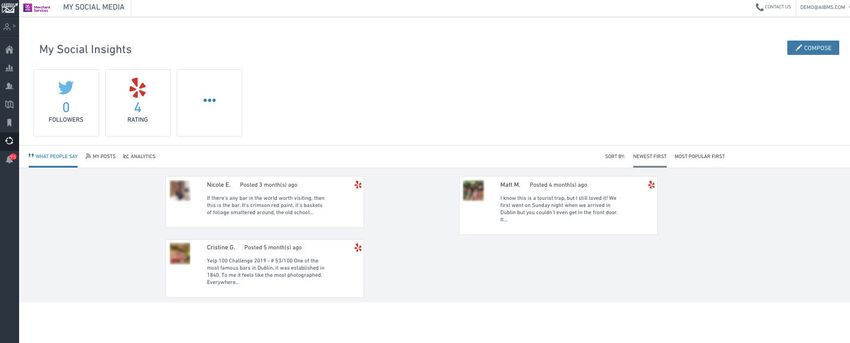
Last Week’s Wins
This will highlight an improvement in your customer
data from the previous week. It could be around an
increase in Revenue, Transactions or Ticket Size for a
type of customer.

Click on SEE MORE
to be brought to the My Customers tab, where you’ll
find a more comprehensive breakdown if needed.

Revenue for a Day
This story card identifies a particular day that may be
increasing or decreasing from the previous week’s.

Clicking on SEE MORE
will bring you to the My Store page, where you’ll
find a more detailed breakdown on your revenue-
by-day data.

                                                          My Dashboard   9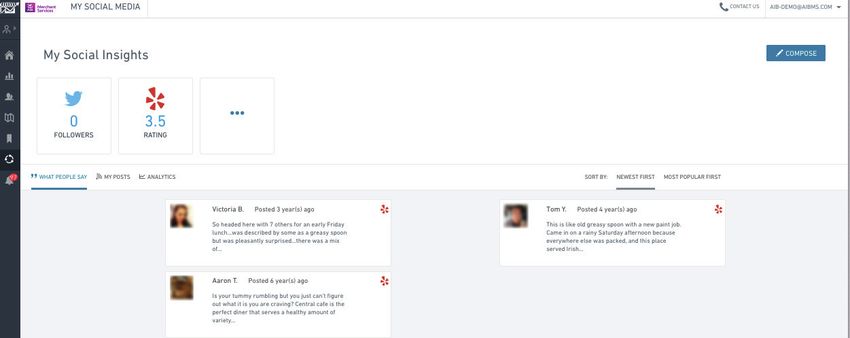
Week’s Biggest Average Spend
Here, you’ll find a simple breakdown on which
gender has spent the most that week.

You vs. Similar Businesses
If you want to see how your business is doing
compared to the competition, this card compares
how much revenue similar nearby businesses have
earned that week.

Click on SEE MORE
to be brought to the My Store page, where you’ll
find more detail on how your revenue compares for
a given period.

Note: The comparison to ‘similar businesses’ is aggregated, utilising the ‘10:20’ ruling, ensuring that no competitor’s sales figures or
      revenue can be identified through the platform. The 10:20 rule states that there must be a minimum of 10 other businesses in the
      comparative cohort, and no one of them can represent more than 20% of the overall cohort.

                                                                                                          My Dashboard                     10
Week’s Biggest Average Spend (Age)
On this card, you’ll see a comparitive breakdown
showing your customer’s average spend based on
their age range.
My Dashboard 11Setting Goals
We all need targets to aim for, whether that’s making up for a recent deficit or simply getting more new
customers in the door.
By clicking on Set Goal,
you’ll be able to set a goal for your weekly, monthly
or yearly revenue target. You can enter your goal
below and monitor your progress against your
current revenue.
My Dashboard 12The blue colour on your dashboard measures your current progress towards your goal.
Once you’ve achieved your goal, the progress bar will turn green.
My Dashboard 13CAFÉ
My Store
CAFÉ
You can access My Store by clicking on this icon on the side bar.
Here, you can easily access historical data in a bar chart timeline or table format related to your Revenue,
Transactions and Ticket Size, which can also be broken down by months, weeks and days.
You can do the same for Transactions and Ticket Size
by selecting them from the TYPE
drop down menu at the top of the page.
If you want to view this information in a table format,
simply can click on the table button
in the right hand corner.
My Store 14Myself Last Year
The TYPE and COMPARE
dropdown menus allow you to view how your
Revenue, Transactions or Ticket Size compares
with how your business (as well as businesses
similar to yours) performed on the corresponding
day 12 months ago.
The red lines represent the amount of revenue your
business has earned in each respective month last year.
This data can also be broken down even further by
selecting the WEEKS and DAYS tabs.
If you prefer to view this in a table format, click the
table icon in the top right hand corner.
My Store 15Similar Businesses
By selecting Similar Businesses
from the drop down, you can view how your
Revenue, Transactions or Ticket Size compares
with similar businesses to yours.
The red lines represent the amount of revenue that similar businesses have generated within the same time
period as yours.
Note: The comparison to ‘similar businesses’ is aggregated, utilising the ‘10:20’ ruling, ensuring that no competitor’s sales figures or
revenue can be identified through the platform. The 10:20 rule states that there must be a minimum of 10 other businesses
in the comparative cohort, and no one of them can represent more than 20% of the overall cohort.
My Store 16This data can also be broken down into more granular
detail by selecting the WEEKS and DAYS tabs.
If you prefer to view this in a table format, click the
table icon in the top right hand corner.
My Store 17Adding a Bookmark
Adding a bookmark allows you to take a snapshot
of a particular Day/Week/Month and store it in
your My Bookmarks tab. This is hugely beneficial if
you’ve done something different in that particular
period, such as had a promotion or spent money on
a marketing campaign, as it allows you to track the
impact of this event into the future.
To add a bookmark, click on the bookmark icon
at the bottom of the bar chart in the My Store tab.
My Store 18Days of the Week Breakdown
Days of the week breakdown allows you to group your Revenue, Transactions and Ticket Size into days, giving
you oversight of what days you complete the most transactions, earn the highest revenue and what your
average transaction value is.
It also displays a message summarising which day
you brought in the most revenue, took in the most
transactions and had the highest average ticket size.
Revenue is displayed by default. To view your
Transactions and Ticket Size breakown,
click on the TYPE drop down tab.
My Store 19My Customers
To access My Customers, click on this icon in the side navigation.
My Customers provides insights on your customers in the following ways:
• How far they have travelled to get to your store.
• How frequently they visit your store.
• What day of the week you have your highest revenue.
• What hour of the day you have your highest revenue.
• What day of the week you take the most transactions.
• What hour of the day you take the most transaction.
This data can also be broken up further
by splitting your customers into type.
There are 4 customer display types:
• Local Customers
• Non-Local Customers
• New Customers
• Returning Customers
Note: The algorithm estimates local customers as those that live within 10km of your store based on their spending patterns.
Non-local customers are those living more than 10km from your store.
You can view this customer data in a
weekly, monthly or yearly format.
My Customers 20How Far They Travelled This Week
If you want to see how far your customers are
travelling from their local area to your store, you’ll find
that data broken down into variable distances here.
How Frequently They Visited
This gives you a percentage breakdown on how
many times customers have visited your store and
is measured by how many times their card is taken
in your store in that time period.
Highest Revenue Day
This shows your highest revenue day
based on a particular week, month
or year, helping you get a quick
overview of what days are standing
out as top performers.
Highest Revenue Hour
Here, you’ll find your average revenue
for each hour of the day, allowing you
to see which times of the day you take
in the most revenue.
My Customers 21Most Transactions Day
This displays how many transactions you take
in for each day of any given week, month or
year, highlighting the one with the highest
number of transactions.
Most Transactions Hour
The above data can be broken down into
hourly charts, highlighting which hours are
the busiest on a specific day.
Transaction Metrics
This shows the Revenue, Transactions and average Ticket Size for the selected customers for that week,
month or year.
This can also be viewed in table format by swtiching table views in the top right hand corner.
My Customers 22My Neighbourhood
Clicking on this icon in the side navigation will take you to the
My Neighbourhood section.
Here, you can view the general areas your customers are travelling
from, as well as other areas they’re spending their money in.
These areas are marked on a map in different coloured hexagons
that represent both how much customers are spending in a given
area, as well as the population of the area they live – from high to low.
Note: Main Street Insights estimates where customers live based on their spending patterns and displays these as hexagons on a map.
Each hexagon is approximately 1km2 in size. In order for the hexagon to be shown, there must be at least 10 customers estimated
to live within the area represented by the hexagon.
Where Customers Spend
Using the coloured hexagons, this page shows you the areas where your customers are also spending
their money.
NOTE: This is based on your entire customer base and their spending patterns and does not provide any information that could be
used to identify individual customers for data privacy reasons.
This can be displayed as weekly,
monthly or yearly data.
My Neighbourhood 23Customer’s Spend
You can also break down your customer’s spending data based on the distance
they live from your store. This is displayed in percetages based on different
distance metrics.
Where Customers Live
If you want to get a better idea of where your customers live, Main Street Insights can make a general estimation
of your customer’s residential area based on things like, where they purchased petrol on weekdays, for example.
Locations are presented in the form of hexagons, with the colour reflecting the population in that area.
This can be displayed as weekly, monthly or yearly data.
My Neighbourhood 24Customer Location
You can also calculate what percentage of your customer base live the
closest or the furthest from your store, helping you to identify areas of
opportunity for your business growth. For example marketing campaigns.
My Neighbourhood 25My Bookmarks
You can access My Bookmarks by clicking on this icon in the side navigation.
As described in the My Dashboard and My Store sections, Main Street Insights gives you the ability to add
bookmarks for specific time periods or events in your business. The bookmarks section stores each one of these
in chronological order so that you can look back on them when checking in on how your business is performing.
If you want to raise a new bookmark while in the My Bookmark
section, you can do this by clicking on the Add Bookmark button
at the top of the page.
You then have the the option to select the date you want to highlight
and add a note detailing your reason for creating your bookmark.
My Bookmarks 26My Social Media
When you access social media for the first time, you will be prompted to click on the ‘Get Started’ button to add
your social media profiles to your account.
Click on the Twitter and Yelp logos to add your profiles.
Yelp
After clicking the add button, this box
will appear for you to enter your
business name and location.
Sample Business A
Click on search.
This screen will appear for you to
click on your business address.
Sample Business A
Dublin
Sample Business B, Sample Street, Dublin, Ireland
Sample Business C, Sample Street, Dublin, Ireland
Sample Business D, Sample Street, Dublin, Ireland
Sample Business E, Sample Street, Dublin, Ireland
Sample Business F, Sample Street, Dublin, Ireland
My Social Media 27After you click connect, your social media page will now look like the below displaying your YELP rating in the
top corner and allowing you to see your customer reviews.
You can click into each of your customer reviews to read more and be redirected to your YELP page.
Twitter
As you did to add Yelp, click on the icon with the three dots to add your twitter account.
The below screen will appear after you have clicked the logo.
Please sign into your twitter account as instructed.
Click authorise
to add your twitter account to Main
Street insight. This integrates your
business twitter account and allows
you to post from Main Street insights,
as well as view your tweets and tweets
from customers that mention you.
My Social Media 28When you have successfully added your Twitter account, your page should look like the below showing your
tweets and your followers.
You can compose a tweet directly from Main Street Insights by clicking on the compose button and typing and
submitting your tweet. This is also available on Facebook. This message will go out to your connected social
media channels.
My Social Media 29Notifications
Access Notifications by clicking on this icon on the side navigation.
Our notification feature shows you any important announcements from AIBMS that may be relevant to your
business, such as service distruptions or feature updates.
Notifications 30Now that you’re more up to speed with how Main Street Insights works, you’ll be able to see the potential it has to help you grow your business. We like to think of it as a business partner – one that’s there to help you get more out of all the hard work you’ve already put in. And, just like running a business, the more you put into Main Street Insights, the more you’ll get out. If you have any questions or need more information, don’t hesitate to contact our helpdesk on 1850 200 417, or visit our FAQ at www.aibms.com/mainstreetinsights We hope Main Street Insights will help your business grow and we are exicited to be a part of your success story. Thank you.
© 2020 First Merchant Processing (Ireland) DAC trading as AIB Merchant Services. All Rights Reserved. All trademarks, service marks, and trade
names referenced in this material are the property of their respective owners. First Merchant Processing (Ireland) DAC is a joint venture between
Allied Irish Banks, p.l.c. and Fiserv. The joint venture is a separate legal entity from Allied Irish Banks, p.l.c. and its subsidiary companies. “AIB” and
the AIB logo are the registered trademarks of Allied Irish Banks, p.l.c. and are used under licence by First Merchant Processing (Ireland) DAC.
First Merchant Processing (Ireland) DAC, trading as AIB Merchant Services, is regulated by the Central Bank of Ireland.
You can also read