Global Student Flows Kadi Taylor Ethan Fogarty - Trade & Investment Queensland

 
CONTINUE READING
Global Student Flows Kadi Taylor Ethan Fogarty - Trade & Investment Queensland
Global Student Flows
        Kadi Taylor            Ethan Fogarty
Head - Strategic Engagement   Senior Consultant
 and Government Relations       Nous Group
           Navitas
Global Student Flows Kadi Taylor Ethan Fogarty - Trade & Investment Queensland
Global Student Flows
EGI Grant Project | 26 June 2019
Global Student Flows Kadi Taylor Ethan Fogarty - Trade & Investment Queensland
We would like to thank our funders and data collaborators for supporting the
project to date

                                               The following global agencies have provided us
                                               support to date:
                                               • Department of Education, Australia
This project has been facilitated by the       • Statistics Canada
Australian Government through the              • Higher Education Authority, Ireland
Department of Education and Training.
                                               • Higher Education Statistics Agency, UK
The Enabling Growth and Innovation grant       • German Centre for Higher Education
supports the National Strategy for               Research and Science Studies
International Education 2025, through $3       • Council on Higher Education, South Africa
million year to deliver big picture projects
                                               • Campus France
that develop Australia’s role as a global
leader in education, training and research.
Global Student Flows Kadi Taylor Ethan Fogarty - Trade & Investment Queensland
The project is being delivered through a collaboration between Navitas, Nous
Group and Austrade

   Navitas is a world leader in     Nous Group is an award-       Austrade is the Australian
   developing and providing           winning management             Government’s trade,
    educational services and        consulting firm with over     investment and education
     learning solutions with         350 people across eight         promotion agency. It
      locations throughout         locations in Australia and         supports Australian
    Australia, North America,     the UK. Nous is an expert in   education providers market
    Europe, Africa and Asia.          higher education and          intelligence, in-market
                                     international education.      support and thought and
                                                                       policy leadership.
Global Student Flows Kadi Taylor Ethan Fogarty - Trade & Investment Queensland
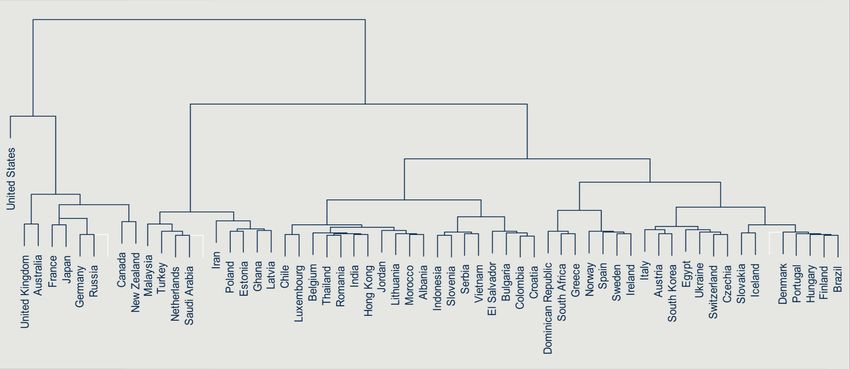
The project builds on existing work and research in this area

Key existing resources that we have built upon include:

                                 UNESCO                         PROJECT ATLAS

                                 Which collects and             A global research
                                 reports global flows of        initiative that collects
                                 international students         and disseminates
                                 between countries              comparable student
                                                                mobility data for
                                                                participating countries
Global Student Flows Kadi Taylor Ethan Fogarty - Trade & Investment Queensland
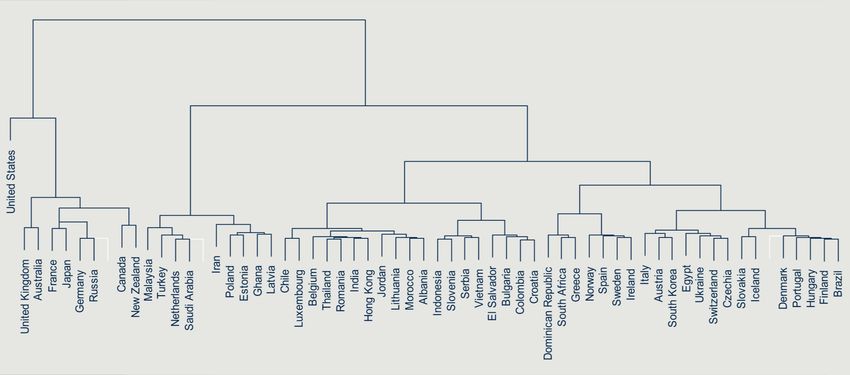
What were the objectives for this project?

Our Australian Government EGI grant project has three objectives:

        To develop a tool to        To understand macro              To identify drivers of
        integrate significant        trends in the global            trends in key source
     international education      higher education market,           country/destination
        data to understand        painting a clear picture of       country relationships.
      country specific trends         student mobility in
       and reconcile/seek to           higher education
    explain any discrepancies
           across sources

               1                              2                               3
Global Student Flows Kadi Taylor Ethan Fogarty - Trade & Investment Queensland
Data availability and consistency has been a barrier for the project

The initial focus of the project was on engagement with global data agencies to access data, which provided
a number of responses

         THE DATA IS           THE DATA IS AVAILABLE           THE DATA IS                THE DATA IS NOT
     AVAILABLE AND CAN            AND CAN WE CAN             AVAILABLE, BUT              AVAILABLE OR NOT
       BE PURCHASED            SUPPORT YOU WITH A          CANNOT BE SHARED              COLLECTED IN THAT
         BY ANYONE              TAILORED REQUESTED        FOR PRIVACY REASONS                 FORMAT

This has made bottom up matching as was initially planned by the project not possible.
Global Student Flows Kadi Taylor Ethan Fogarty - Trade & Investment Queensland
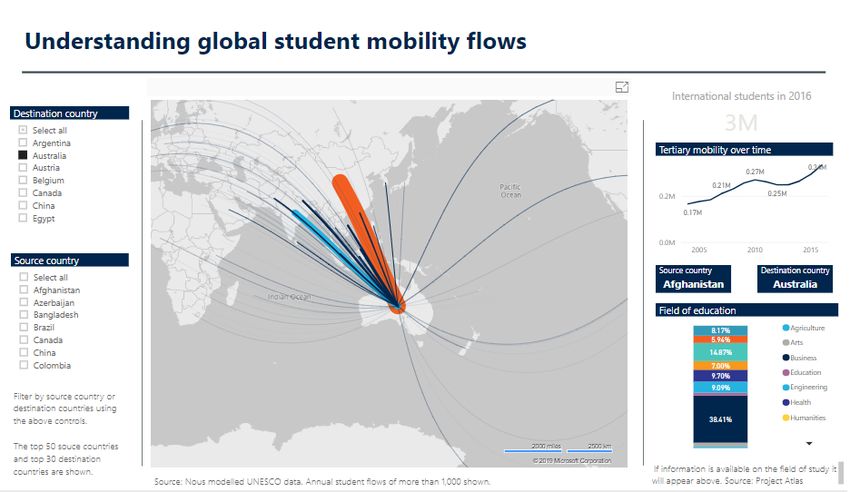
Consistency of student or enrolment data also varied significantly across key
destination countries

               GRANULARITY                CURRENCY                  RESOLUTION
What we
                   More detailed         Providing more             Clarification of
were trying
                  information on      recent data reducing           discrepancies
to improve…
              students than current         the lag in              across key data
                 to country flows.       understanding                    sets.
                                             trends.

               Information on the     Up to date data is not       Inconsistencies and
What we        variables listed are    possible. Not all key    discrepancies across data
were able        not consistency      destination countries    sets occur due to different
to do…           available for all     have internal access       definitions. These are
               (major) destination    to information within        being identified and
                    countries.              12 months.            recorded through the
                                                                  course of the project.

                                                                                             8
Global Student Flows Kadi Taylor Ethan Fogarty - Trade & Investment Queensland
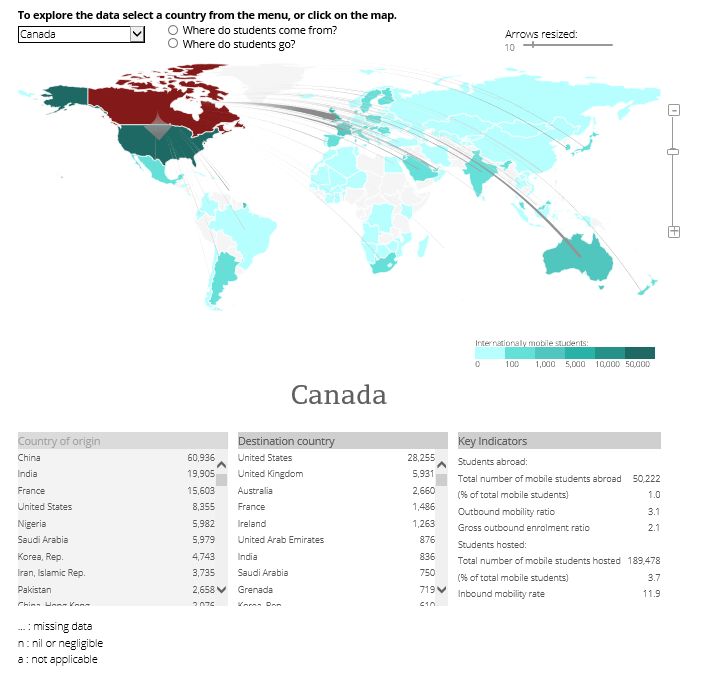
Inconsistent data means that we had to take a different approach to integration

        LAYER 1                                 LAYER 2                                               LAYER 3
                                  Publically available student numbers                    Country specific data sources
   Macro student mobility
 flows in tertiary education           By field                 By level                High level                   Detailed level

 What is available?              What is available?                               What is available?
 Information on source country   Includes further information by level of study   Macro student mobility flows in tertiary education
 and destination country over    (PG or UG) OR field of study                     Data source
 time (2004 to 2016)                                                              Country specific reported data sources, including:
                                 Data source
 Data source                                                                      UK (HESA); Australia (MIP/HEIMS); US (Open
                                 Project Atlas country reported data
 UNESCO Global Student                                                            Doors, publicly available); Ireland (HEA provided
 Mobility data                   Data type                                        data); Germany (DAAD provided data); South
                                 Higher Ed student numbers                        Africa (HEIMS provided data)
 Data type
                                 Various integrated sources                       Data Type
 Tertiary Ed student numbers
 Various integrated sources                                                       Visa reported data
                                  64,000 of these are             52% are         (some enrolment reported data has been used if required)
     There were 112,300           studying Business             studying at         These students are highly concentrated at
  Chinese students studying          (minor reported
                                                                 UG level           Go8 universities in Melbourne & Sydney.
    in Australian in 2016          difference – 114,000)

                                                                                                                                             9
Global Student Flows Kadi Taylor Ethan Fogarty - Trade & Investment Queensland
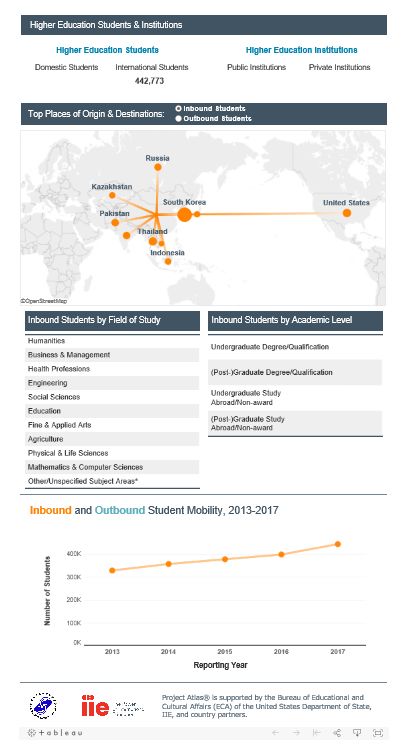
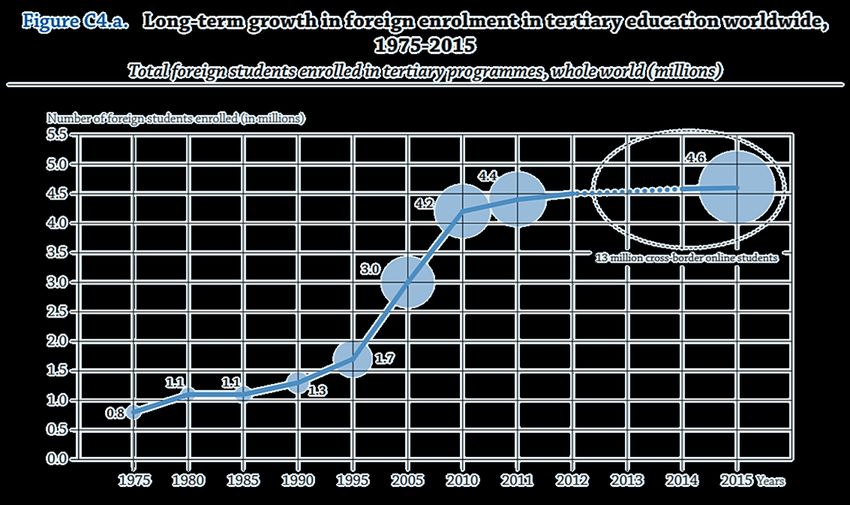
Initial integration has addressed gaps that exist in UNESCOs reported global flows

                        Total number of students studying overseas, 2003 to 2016

5,500,000
                                                                                          Nous modelled data
5,000,000                                                                                 UNESCO total reported

4,500,000                                                                                                           This represented
                                                                                          UNESCO country-to-
                                                                                          Country reported data     a gap of around
4,000,000
                                                                                                                     12% based on
3,500,000                                                                                                          non-reported data
3,000,000

2,500,000

2,000,000

1,500,000
            2004 to 2010                           2011 to 2013         2013 to 2016                              Source: UNESCO Tertiary student
1,000,000   Long term growth                       Short term modest    Strong recovery                           mobility. Note: China (as a
            +6.7% CAGR                             +0.1% CAGR           +10.0% CAGR                               destination country) reported
 500,000    +5.7% CAGR                             +3.4% CAGR           +7.8% CAGR                                figures were included in the
                                                                                                                  UNESCO reported data, but
                                                                                                                  information was not presented on
       0
                                                                                                                  the relevant source countries.
        2004 2005 2006 2007 2008 2009 2010 2011 2012 2013 2014 2015 2016

                                                                                                                                                     10
Differences also exist across the OECD and UNESCO data based on definitional
  differences

                                                                   • Foreign students: do not have
                                                                     citizenship of the country in
                                                                     which they studied (e.g.
                                                                     studying on working visa)

                                                                   • International students:
                                                                     moved to another country for
                                                                     the purpose of study. (i.e.
                                                                     student visa)

                                                                   For example UNESCO reports a
                                                                   total of 2.8 million international
                                                                   students in 2005, while OECD
                                                                   reports 3.0 million students in
                                                                   2005.

Space between
   two dots                                                       Source: 1 OECD charts a slowing of
  represent                                                       international mobility growth, ICEF Monitor
    5 years                                                       (2017) http://monitor.icef.com/2017/09/oecd-
                                                                  charts-slowing-international-mobility-growth/
(Nous addition)
Following initial analysis principles were used to inform selection of three ‘deep
dive’ case studies

Four principles were utilised…         …to determine three case study topics.

   RELEVANCE                                 Understanding the maturity of destination
                                             countries and the drivers for emerging
                                             destinations

   NOVEL
                                             Understanding global product preferences for
                                             key source countries and the impact on global
                                             mobility
   TIMELY

                                             Understanding the impact of country-specific
   ANALYTICAL FOCUS                          policy responses on student mobility

                                                                                             12
Understanding the maturity of destination
countries and the drivers for emerging
destinations
The first case study focuses on emerging destination countries in the international
education system

  What we already know                           What is the focus of the research
  There are a number of emerging                 Identifying which destination countries are
  destinations in the global international       emerging
  education system.
                                                 Understanding the drivers behind recent
  Some of these emerging destinations (such      growth trends in key emerging countries
  as China, Malaysia, Russia and Canada) are
                                                 Determining the implications for Australia
  growing at a faster rate than most
  established destinations (US, UK and
  Australia).

                                                                                               14
While the sector typically considers major destination countries based on size, we
adopted a novel three-dimension maturity assessment to classify countries

We ran a cluster analysis on three factors related   …to provide a more holistic view of different
to destination countries…                            ‘clusters’ of destination countries globally.
                                                                                 High

    Volume – how many students studied
    there in 2016

                                                                        Growth
    Growth – increase in student numbers
    from 2011 to 2016                                                            Low
                                                                                   Low

    ‘Pulling Power’ which accounts for the
    nature of where students come from                                                      High

                                                                                          'Pulling Power'
'Pulling Power' provides an assessment of the destination country based on their
student profile

The international students that USA attracts …           … are more diverse than the international students
                                                         Russia attracts.

        310K (32%)

                         136K (14%)
                                           60K (6%)                   77K (29%)
                                                                                         22K (9%)        20K (8%)

           China               India      South Korea                Kazakhstan          Ukraine        Uzbekistan
 out of a total of 971K students.                           out of a total of 244K students.

 Case study | China to USA                                  Case study | Ukraine to Russia
 ‘Pulling Power’ – 92 (High)                                'Pulling Power' – 22 (Low)

 1. Geographic distance – 11,647 km                         1. Geographic distance – 4,666 km

 2. Cultural distance – (39%* across six dimensions)        2. Cultural distance – (9% across six dimensions)

    This makes USA an ‘high Pulling Power’ destination         This makes Russia a ‘low Pulling Power’ destination
                         country                                                      country

                                                                                                                     16
The clusters analysis groups together the countries that are ‘most similar’

Destination country cluster analysis* based on volume, growth (3 year CAGR) and ‘pulling power’
     40 40
 Height (indicates how different or distinct two clusters are)

     30 30

     20 20

     10 10

        0   0

                                                                                              Singapore

                                                                                                          Singapore
                                                                                                          Singapore
    China

                                 China
                                         China
                         UAE

                                                      UAE
                                                            UAE

            Major destination countries          Promising               Other destinations

                                                                                                                      17
Six clusters of destination countries are identified, three of which we have
classified as emerging

                  A. Major destination countries                       B. Fast growing destination countries

                                       United States                                                Malaysia
1. Established destination
                                       United Kingdom   5. ‘Promising’ emerging                     Netherlands
countries
                                       Australia        destination countries                       Turkey
                                                                                                    Saudi Arabia
                                                                                                    UAE
2. Mature destination countries        France
                                       Japan

                                                                          C. Junior destination countries

3. ‘Next wave’ emerging                Canada
destination countries                  New Zealand      6. All other destination countries – which attract less
                                                        students, have lower ‘pulling power’ and/or are
                                                        experiencing lower growth.
                                       Germany
4. ‘Latent’ emerging destination
                                       Russia
countries
                                       China

                                                                                                                   18
Emerging destination countries are driven by different categories of source
countries

                                                                                                                        The influx students are
 Global top ten source countries                                                                                        driven by ‘close’ source
 ‘Close’ source countries                                                                                               countries Kazakhstan
                                                                                 Growth is driven by                    (+21K), Ukraine (+10K)
 Other
                                                                                 students from China                    and Uzbekistan (+9K).
                                                                                 (+11K) and India (+4K).
                               Major source countries                                                                                     244k
                               include Bangladesh (34K)                                                                   226k             21k
                               and Nigeria (15K) in 2016.                                                  213k
                                                                                                                           20k
                                                                                                            16k
                                                                                            189k
                                                              164k           172k

                                                                                            105k           153k           175k            193k
                                   124k                        88k            93k
                  111k
  100k
                                   39k
  29k              35k                                                                       12k
                                                               12k            12k
  32k              38k             42k
                                                               64k            67k            72k
  38k              39k             42k                                                                      45k            32k             29k
  2014            2015             2016                       2014           2015           2016           2014           2015            2016

              Malaysia                                                     Canada                                        Russia
‘Promising’ emerging destination country                    ‘Next Wave’ emerging destination country       ‘Latent’ emerging destination country

                                                                                                                                                   19
Australia will increasingly be competing with both established and select emerging
destination countries for share of students studying overseas

 In the global market, emerging destination countries                               Focusing on Australia’s top three source countries (China,
 within the top ten have increased its share of all                                 India and Malaysia), emerging and established destination
 international students                                                             countries have increased similarly

Global top ten destination countries’ share of international students (2011–2016)   China, India and Malaysia’s top ten destination countries’ share of international
                                                                                    students (2011–2016)
                60.8%                     60.6%                                                        87.0%                      87.4%

       USA
                                                                                               US

                                                         Established
                                                         (35% to 34%)
        UK                                                                                                                                        Established
     France                                                                                             13.5%                                     (58% to 61%)
                             Australia                                                                              Australia
      Japan      6.6%                      6.6%                                                UK                                 14.1%
   Germany                                               Mature                             Japan
     Russia                                              (11% to 8%)                        France
                                                                                                                                                  Mature
    Canada                                                                                 Canada                                                 (14% to 9%)
      China                                              Emerging                     New Zealand                                                 Emerging
       Italy                                             (15% to 18%)                     Germany                                                 (10% to 12%)
                                                                                                                                                  Other
   Malaysia                                                                                 Russia                                                (5% to 6%)
                 2011                      2016                                                         2011                       2016

                                                                                                                                                                        20
But, largely the big declines that Australia has experienced in recent years has
   been due to established rather than new emerging competitors

   Net change in share of students from other destination country, Australia and other destination country groups, 2011 to 2016

                                                     ‘Next Wave’                                     ‘Promising’              Established
                          Australia                                         ‘Latent’ emerging                                                Mature
                                                     emerging                                        emerging                 (US and UK)

6 Indonesia                          -3.2%                  +0.8%                  -0.2%                     -0.7%                   +5.4%        +0.8%

8 Hong Kong                          -10.1%                 +0.6%                   0.0%                    +0.2%                    +7.9%        +0.0%

9 Singapore                          -10.9%                 +0.6%                   0.0%                    +0.1%                    +7.3%            -0.1%

14 Bangladesh                        -6.0%                  -2.6%                  -0.5%                    +50.6%                  -15.1%            -5.9%

15 Saudi Arabia                      -6.9%                  -0.6%                   0.0%                     -1.1%                   +0.7%        +0.1%

              Negative    Positive
Legend (1):   relative    relative            Legend (2): Negative                    Positive         Legend (3): Negative / Positive                        21
              growth      growth
Understanding global product preferences
for key source countries and the impact on
global mobility
The second case study focuses on global product preferences of key source
countries

  What we already know                            What is the focus of the research
  Product is a key driver in the decision         Identifying key global students segments
  making of students on where and what to         and classifying based on key drivers of
  study.                                          choice.
  There is a relatively strong understanding of   Understanding product preferences for key
  trends in product preferences in the            source countries
  Australian context, but there is not a strong
  understanding of how these trends align
  with broader global product preferences

                                                                                              23
Initial analysis identified key global student segments and how
it has changed over time
                                                                                                     Countries in Asia
                                                                                                     serve as a source
                          2014                                               2017
                                                                                                       of outbound
China studying Business                            China studying Business
                                                                                                         students
China studying Engineering                         China studying Engineering
China studying ‘other’                             India studying Engineering                        China and India
India studying Engineering                         India studying Mathematics and Computer science    are dominant
China studying Mathematics and Computer science    China studying Mathematics and Computer science   markets across all
China studying Social Sciences                     China studying Sciences                            fields of study
India studying Mathematics and computer sciences   China studying Social Sciences
China studying Sciences                            China studying ‘other’
                                                                                                       Top key global
China studying Humanities                          India studying Business
                                                                                                     student segments
China studying Arts                                China studying Arts
                                                                                                         are largely
India studying Business                            China studying Humanities
                                                                                                        Business or
South Korea studying Business                      Vietnam studying Business
                                                                                                        Engineering
Vietnam studying Business                          Kazakhstan studying Engineering
South Korea studying ‘other’                       Kazakhstan studying Business
India studying Sciences                            India studying Health professions
Product preferences differ across the top five global source countries

                        CHINA                            INDIA                  SOUTH KOREA                       GERMANY                     NIGERIA
                      Total: 834,122                Total: 288,634                 Total: 99,800                   Total: 95,200             Total: 93,431

    Remaining
fields of study                                           6%
                                                               5%
         Health                                     1%
                                 2%
         Sciences     9%                                                                                               4%                         13%
      Humanities           7%                            30%                            4%                                                         6%
                                                                                                                                                             1%
      Math and             10%                                                                                        26%
                                                                                        15%                                                       12%
   comp. science
     Engineering           17%                                                          9%
                                                                                                                      10%
                                                         31%                            7%                                                        26%
                                                                                                                       4%
                                                                                        13%                            7%
         Business          32%
                                                         18%                            16%                           21%                         20%

                Business is the dominant                                                                    Sciences and Business are    Nigeria has a relatively
                                            Indian outbound students        The South Korean market
                     preference for                                                                          popular preferences for       high proportion of
                                              are distributed evenly       is fairly evenly distributed –
              international students from                                                                      German outbound          Engineering and Business
                                            across three fields of study    but Business is the largest.
                         China,                                                                                     students.             and Health students.

                                                                                                                                                                    25
The preference of Chinese students studying in Australia does not reflect global
     trends for Chinese students studying overseas

    Over a half of Chinese students in Australia study
    Business, whereas this is balanced for other destinations                                Business is the dominant preference for international
                                                                                Global          students from China (32%), but other fields are
     Chinese students by field of study, China global estimate and             product         significant – Engineering (17%) and Maths and
     Australian inbound students, 2017                                       preferences                   Computer Science (10%).

          Arts
                          6%                               5%
Social sciences                                            6%
                          8%
      Health              2%                          4%
                                                                 3%                          Business is declining as a share of the global total
      Sciences
                          9%                               7%                Global trends Chinese students (37% to 32% from 2014 to 2017), with
   Humanities             7%
                                                           12%
                                                                                                          increases in other fields.
   Math and               10%

comp. science
  Engineering             17%

                                                           53%                                In contrast – over 50% of Chinese student study in
                                                                             Alignment to      Australia (2017). This may represent strength of
      Business            32%                                                 Australia’s       Australian Business program or comparative
                                                                                 trends       weakness in other fields (particularly in STEM).
                  All Chinese outbound       Chinese students in Australia
                   students (estimate)

                                                                                                                                                     26
Indian product preference for study in Australia, differ from Indian preferences
   elsewhere

  IT product preferences in Australia reflect global student
  preferences, but Business concentration is distinct for Australia                                    Indian outbound students are distributed
                                                                                       Global       evenly across a wide number of fields of study
                                                                                      product            – with around 30% in Engineering and
  Indian students by field of study, India global estimate and Australian inbound   preferences
  students, 2017                                                                                    Maths/Computer Science and 18% in Business.

      Health                                                    6%
                          6%
  professions                                                                                        Two largest fields have grown as a share –
                                                               26%                  Global trends    Engineering and Maths/IT – while Business
   Math and
                         30%                                                                                 flattened (18.5% to 17.5%).
comp. science
                                                               12%

 Engineering             31%                                                                          Indian students in Australia study in a more
                                                               45%                  Alignment to     concentrated set of fields – 45% in Business.
                                                                                     Australia’s     While Computer Science is in line with global
     Business            18%                                                            trends         splits, Engineering is comparably under
                                                                                                          enrolled – only 12% of all students.
               All Indian outbound              Indian students in Australia
               students (estimate)

                                                                                                                                                     27
There are differences in the quality or reputation of the higher education
institutions students from these countries study at

A larger proportion of outbound students from mature source countries attend higher quality institutions compared to
outbound students from newly developed source countries

Proportion of students in the UK and Australia studying at a Top 500 Institution, 2017

                                                  Business                                     Engineering

                                         China                   69%                           China                     91%

      Mature source
       countries                  South Korea                    66%                     South Korea                     92%

                                          India                    73%                          India              68%

                                 Saudi Arabia                53%                         Saudi Arabia          65%
    Newly developed
    source countries
                                      Vietnam                52%                             Nigeria         50%

                                                                                                                               28
Ten key groups emerge through the clustering based on where the segment cohort
have similar characteristics

                          Three key decision dimension:
                              A. STUDY LEVEL              B. INSTITUTION           C. DESTINATION
                           Orientation to PG-level   Strong emphasis on high   Attracted to major country        Selection of student
Cluster group                   further study           quality institutions       or city destinations          segments

1. Pursuers                                                                                                 China – Business, India – most fields

2. Academics                                                                                                China – Education

3. Learners                                                                                                 China – most other fields

4. High-performers                                                                                          South Korea – Sciences and Social Sciences

5. Researchers                                                                                              South Korea – Business

6. Global-adventurers                                                                                       Vietnam – Business

7. City-explorers                                                                                           South Korea - Arts

8. Neighbours                                                                                               Nigeria – Engineering, Kazakhstan

9. Reputation-seekers                                                                                       China – Humanities

10.Destination-seekers                                                                                      Turkmenistan/Belarus – Business

Key       Very           Somewhat       Not
                                                                                                                                                         29
          important      important      important
Demonstration of global student flow tool

                                            30
You can also read