COVID Model Projections - BC COVID-19 Modelling Group April 14, 2021
←
→
Page content transcription
If your browser does not render page correctly, please read the page content below

COVID Model Projections
             April 14, 2021

   BC COVID-19 Modelling Group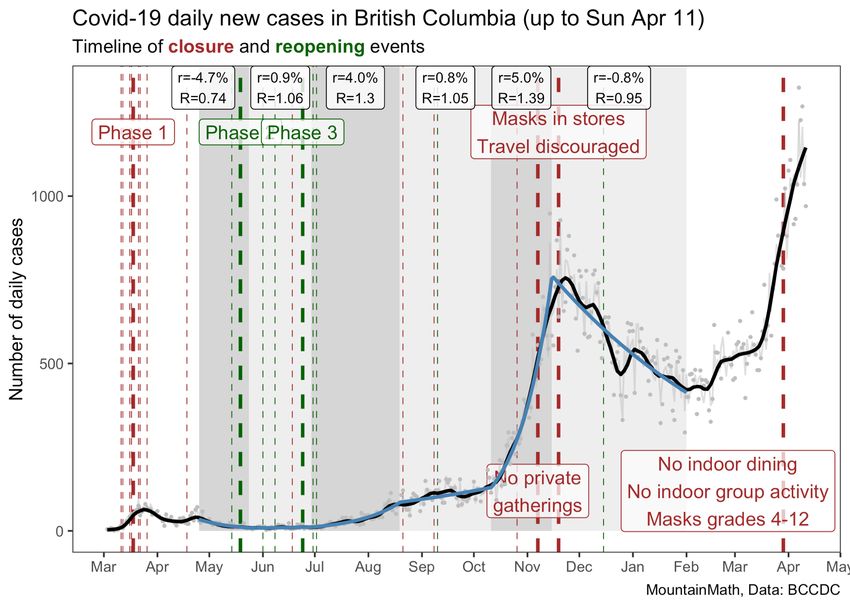
About BC COVID-19 Modelling Group

                                                                 Contributors to report
                                                                 Sarah Otto (UBC, editor)
                                                                 Dean Karlen (UVic and TRIUMF)
                                                                 Caroline Colijn (SFU)
                                                                 Jens von Bergmann (MountainMath)
                                                                 Rob James (evidently.ca)
                                                                 James Colliander (UBC and PIMS)
                                                                 Eric Cytrynbaum (UBC)
                                                                 Daniel McDonald (UBC)
                                                                 Paul Tupper (SFU)
                                                                 Daniel Coombs (UBC)
                                                                 Elisha Are (SFU)
                                    https://bccovid-19group.ca

               Independent and freely offered advice,
              using a diversity of modelling approaches.                                       2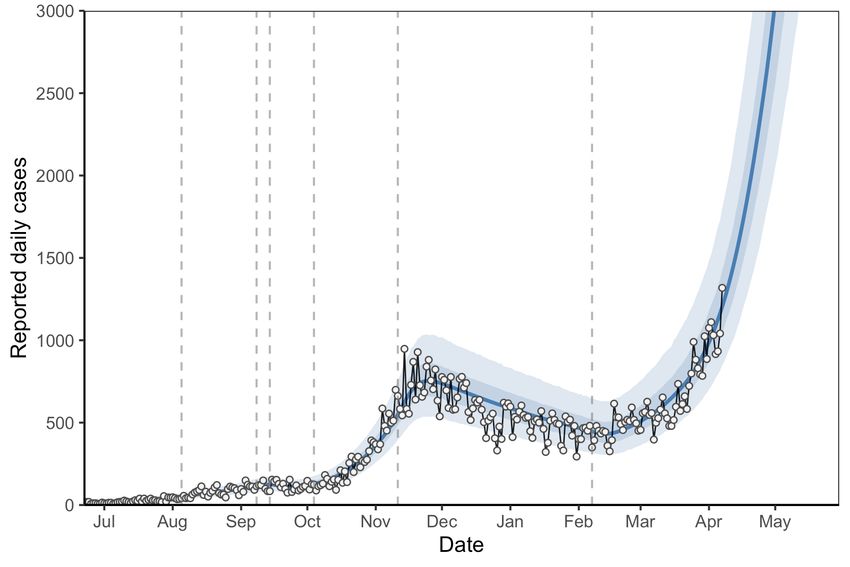
Key messages
● Growth of variants of concern (B.1.1.7 and P.1) has driven recent rise in cases
● Transmission must be reduced by ~40% to control case growth (relative to
  March 2021 levels)
● Hospitalization numbers are projected to rise above capacity in May, unless
  virus transmission is brought under control
● Vaccination program needs to swiftly target those with the most contacts so that
  infection and hospitalization rates can be reduced over the next 2-3 months

                                                                                     3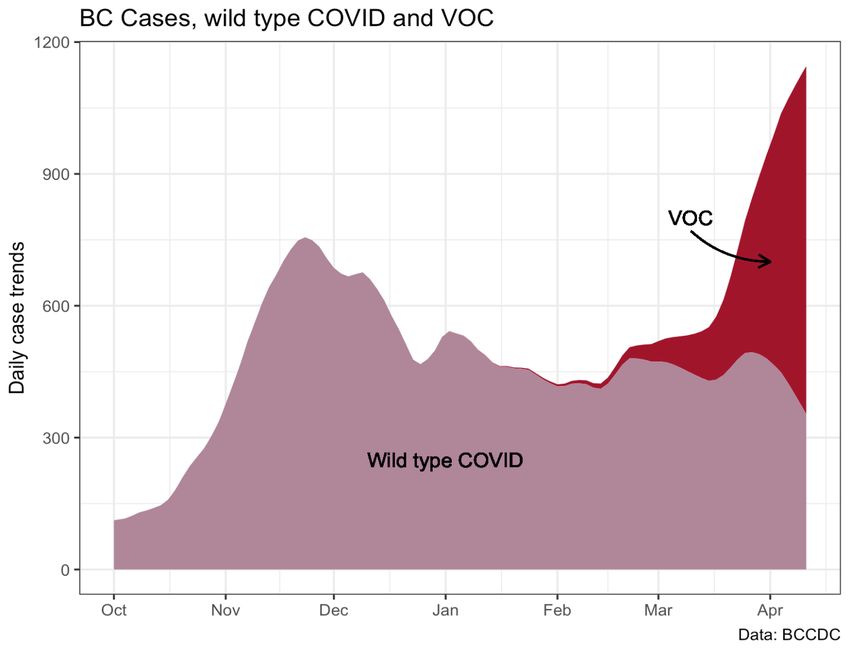
State of the COVID-19 Pandemic in BC

      Most of the pandemic in BC is
      well-described by long periods
      of constant growth or decline
      (blue curves) delineated by
      changes in public health
      measures.

      Public health measures work.

Source (J. von Bergmann) Case data from BC COVID-19 Database (http://www.bccdc.ca/health-info/diseases-conditions/covid-19/data). Vertical lines give dates of public
                                                                                                                                                                              4
health measures (major as thick lines, minor as thin lines). Grey dots are raw case counts, grey lines is cases abused for weekly pattern, black STL trend line and blue fitted
periods of constant exponential growth.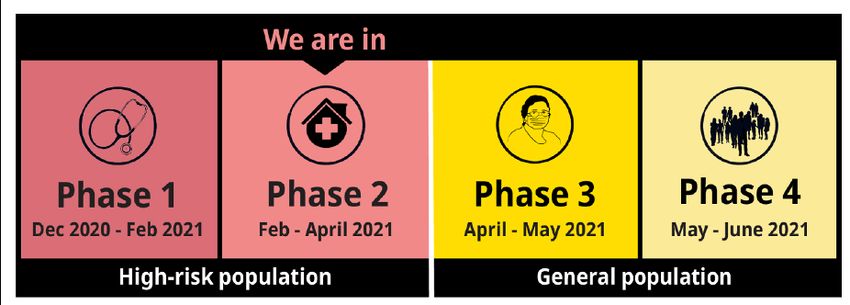
Recent trend in case numbers

     Recent surge in case numbers is
     due to rise in B.1.1.7 and P.1
     variants of concern (VOC).

     VOC grew exponentially in February
     and March, doubling every 8.6 days
     (95%CI: 7.9-9.3 days).

     VOC transmission must be reduced
     by an additional ~40% from March
     levels to halt growth (thinner red
     curves are illustrations only).

Source (S. Otto). Case data from Joint Statements (https://archive.news.gov.bc.ca; April 9, 2021). VOC data from BCCDC (April 7, 2021). VOC are typed by
PCR assays for S:N501Y (“presumptive VOC”). Starting with the point prevalence assay (epiweek 5), average daily case count in each epiweek is multiplied by
the proportion of VOC observed that week (black dots). Exponential growth rate (thick red curve, r = 0.081) was estimated by a linear fit to log(data). Growth
rate (r = 0.081) was used to calculate the reproductive number Rt = exp(6.5 r) = 1.69 assuming a 6.5 day generation (Volz et al. 2021). Rt was then used to      5
determine impact of reducing transmission (thin red curves).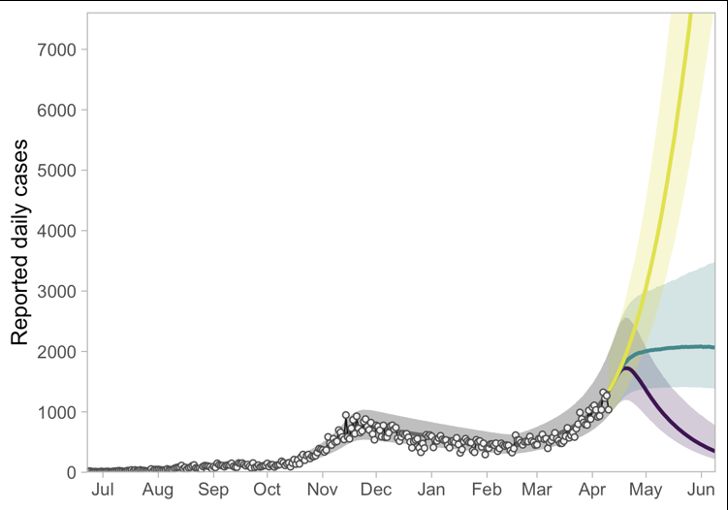
Recent trend in active case numbers

                                                                                                             Number of active VOC cases
                                                                                                             (red region) inferred from the
                                                                                                             percent VOC

                                                                                                             BC’s Joint Statements report number
                                                                                                             of active VOC cases that remain
                                                                                                             active after confirmation by whole
                                                                                                             genome sequencing (red dots).

Source (S. Otto). Active case numbers from Joint Statements through April 9, 2021 (https://archive.news.gov.bc.ca). VOC data from BCCDC (April 7, 2021) provide
% of cases that were VOC by week (see slide 5). These data were fit by a logistic function to estimate percent VOC by day (see Appendix), which was then          6
multiplied by the number of active cases to estimate the active number of VOC cases (red shaded region).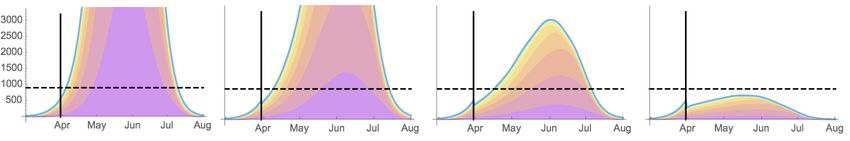
Recent trend in case numbers (smoothed fit)

                                                                                                     Rise in VOC was predicted and
                                                                                                     aligns well with what has been
                                                                                                     seen in other jurisdictions.

Source (J. Bergmann). Case data from BC COVID-19 Database (http://www.bccdc.ca/health-info/diseases-conditions/covid-19/data) and smoothed using STL trend
                                                                                                                                                             7
line that removes day-of-the-week effects. VOC data from BCCDC (April 7, 2021).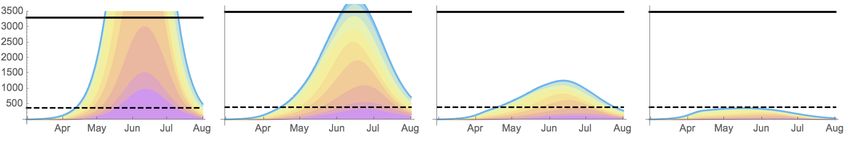
Also finds long periods with
  Model fit to case data (up to April 11)                                                                                  constant transmission rates
                                                                                                                             (between vertical lines)

                                                               Fits case data                                                  Shows best fit of model to
                                                                    (only)                                                     case data, assuming a
                                                             small dots: daily cases
                                                             large dots: weekly avg                                            change to transmission
                                                                                                                               rates occurred on March 30.
                                                                                                                                • Many possible trajectories are
                                                                                                                               consistent with data - two (upper
                                                                                                                               and lower) are shown to indicate
                                                                                                                               current uncertainty.

                                                                                                                               Includes vaccination,
                                                                       Estimates
                                                                        hospital                                               removing vaccinated
                                                                   & ICU occupancy                                             individuals from
                                                                                                                               susceptible class following
                                                                                                                               a delay (median 16 days).

Source (D. Karlen). See www.pypm.ca. Assumes homogeneous mixing (no age structure). Assumes vaccination rate of 1st doses increases from                       8
17,000/day (current rate) to 30,000/day (starting on April 13). Vaccination model benchmarked with data from Israel: see this link.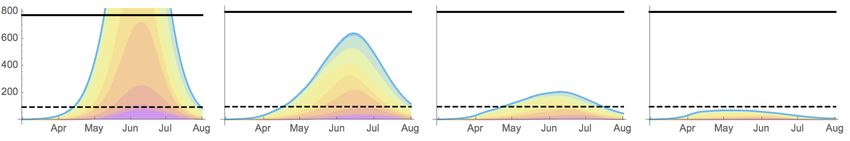
Near-term incidence projection

                                                        Total Daily Cases

Source (E. Are, C. Colijn). Active case numbers projected forward, accounting for VOC data from BCCDC (April 7, 2021). These data provide % of cases that were
VOC by week (see slide 5). These data were fit by a logistic function to estimate percent VOC by day (see Appendix). Assuming a 40% increase in transmissibility
(consistent with the estimated selection s in the Appendix), the percent VOC is used to create an overall reproduction number R for the virus population. R changes   9
in time as the VOC rises in frequency. The social distancing parameter (among others) is estimated to fit the data using the ‘covidseir’ R package (S. Anderson)
Bending down the VOC curve
Although too early for a robust
statistical measure without more
data, estimated VOC case
numbers may now be rising more
slowly than the exponential
growth seen in Feb/March (thick
curve).
Thin curves illustrate what we
might see if there had been a
change in transmission in mid to
late March.
Source (S. Otto). Active case numbers from Joint Statements through April 9, 2021 (https://archive.news.gov.bc.ca). VOC data from BCCDC (April 7, 2021) provide
% of cases that were VOC by week (see slide 5). These data were fit by a logistic function to estimate percent VOC by day (see Appendix), which was then
multiplied by the number of daily cases to estimate the daily number of new VOC cases (red shaded region). Thin red lines are for illustrative purposes only, 10
suggesting what would occur if transmission were reduced by 20-40%, affecting growth in new cases as early as on March 30.Bending down the VOC curve
How much more do we have to bend
down the curve?
These projections show that where
we are now is not enough to prevent
VOC growth (yellow).
A further reduction in contacts of 20%
(blue) to 40% (purple) is needed.
Vaccinating high-contact individuals
sooner would help reduce
transmission even more (not shown).
Source (E. Are, C. Colijn). Active case numbers projected forward, accounting for VOC data from BCCDC (April 7, 2021). These data provide % of cases that were VOC by week (see slide
5). These data were fit by a logistic function to estimate percent VOC by day (see Appendix). Assuming a 40% increase in transmissibility (consistent with the estimated selection s in the
Appendix), the percent VOC is used to create an overall reproduction number R for the virus population. R changes in time as the VOC rises in frequency. The social distancing parameter
11
(among others) is estimated to fit the data using the ‘covidseir’ R package (version “stan-2.26”; S. Anderson)Longer-term predictions for VOC depend on vaccination plan
Epidemic model of SARS-CoV-2 using BC data on
hospitalization, ICU, and death rates by age and BC’s
vaccination plan. SEAPIR Model
S: susceptible
E: exposed
A: asymptomatic (less infectious)
P: pre-symptomatic (infectious)
I: symptomatic (infectious)
R: recovered
10 age classes
{0-9,10-19,...80-89,90+}
2 distancing classes
● Non-distancing (essential workers)
● Distancing 12
Source: S. Otto. Based on model in Day et al. (2020)Longer-term predictions for VOC depend on vaccination plan
Vaccinations BC population Assuming BC’s age-based roll-out plan
size
(in millions) ● 85% vaccine uptake rate
● Adds youth vaccination in June
Projected
vaccinations
Vaccinations
completed
(black)
Source (S. Otto). Vaccinations completed from https://health-infobase.canada.ca/covid-19/vaccine-administration/ (87564 subtracted based on second doses before those
were paused). 85% uptake rate from PHAC Modelling Group Report (2021-04-08), as found in older age groups (65+) and assuming younger individuals will be encouraged13
to accept vaccinations more than currently estimated (72% for under age 45).Longer-term predictions for VOC
March transmission levels Reduced by 20% Reduced by 30% Reduced by 40%
● Projections also depend strongly
on what we collectively do to slow
transmission.
● The following slides show a range
of transmission levels, reflecting
activity and risk levels relative to
February/March.
14VOC Cases/day Assumes reduced transmission
rates effective March 30 (when
indoor dining closed)
March transmission levels Reduced by 20% Reduced by 30% Reduced by 40%
Previous non-
VOC maximum
➔ Public health measures and reductions in transmission Projections for VOC only:
are needed, alongside the vaccination campaign ● Assumes 90% vaccine
➔ A decline in VOC transmission of 20% relative to efficacy and 85% uptake
February/March will slow but not stop rise in cases. ● 64% higher severity of VOC
Source: S. Otto. Based on model in Day et al. (2020) with age-based vaccination campaign, age-based contact matrix (Mulberry et al. 2020), and two 15
distancing classes as in Anderson et al. (2020). Adjusts transmission to match growth of VOC in March, with total number of active VOC cases as on March 31,# in Hospital (VOC only) Available hospital beds
(unoccupied on April 14, base
and surge)
March transmission levels Reduced by 20% Reduced by 30% Reduced by 40%
Previous
maximum
➔ Public health measures and reductions in transmission Projections for VOC only:
are needed, alongside the vaccination campaign ● Assumes 90% vaccine
➔ A decline in VOC transmission of 20% relative to efficacy and 85% uptake
February/March will slow but not stop rise in hospital ● 64% higher severity of VOC
demand.
Source: S. Otto. Based on model in Day et al. (2020) with age-based vaccination campaign, age-based contact matrix (Mulberry et al. 2021), and two
distancing classes as in Anderson et al. (2020). Adjusts transmission to match growth of VOC in March, with total number of active VOC cases as on March
31, 2021. Hospital capacity is available (unoccupied) base and surge beds (Joint Statement, https://news.gov.bc.ca, April 12, 2021); length of stay from CIHI16
(https://www.cihi.ca/en/covid-19-hospitalization-and-emergency-department-statistics on 10 April, 2021).Total ICU bed
# in ICU (VOC only) capacity
(for all critical care
needs)
March transmission levels Reduced by 20% Reduced by 30% Reduced by 40%
Previous
maximum
➔ Public health measures and reductions in transmission Projections for VOC only:
are needed, alongside the vaccination campaign ● Assumes 90% vaccine
➔ A decline in VOC transmission of 20% relative to efficacy and 85% uptake
February/March will slow but not stop rise in ICU demand ● 64% higher severity of VOC
Source: S. Otto. Based on model in Day et al. (2020) with age-based vaccination campaign, age-based contact matrix (Mulberry et al. 2021), and two
distancing classes as in Anderson et al. (2020). Adjusts transmission to match growth of VOC in March, with total number of active VOC cases as on
March 31, 2021. ICU capacity (all beds: base and surge, occupied or unoccupied) from Joint Statement (https://news.gov.bc.ca; April 12, 2021); length of 17
stay from CIHI (https://www.cihi.ca/en/covid-19-hospitalization-and-emergency-department-statistics on 10 April, 2021).Daily death rates (VOC only)
March transmission levels Reduced by 20% Reduced by 30% Reduced by 40%
Previous
maximum
➔ Public health measures and reductions in transmission Projections for VOC only:
are needed, alongside the vaccination campaign ● Assumes 90% vaccine
➔ A decline in VOC transmission of 20% relative to efficacy and 85% uptake
February/March will slow but not stop rise in deaths ● 64% higher severity of VOC
Source: S. Otto. Based on model in Day et al. (2020) with age-based vaccination campaign, age-based contact matrix (Mulberry et al. 2021), and two 18
distancing classes as in Anderson et al. (2020). Adjusts transmission to match growth of VOC in March, with total number of active VOC cases as on March 31,Bending down the VOC curve
Key messages
● Having reduced transmission of VOCs by 20% relative to February/March bends
down the VOC curve but does not avoid overwhelming hospital capacity.
● Reducing transmission by 40% relative to February/March is needed to avoid further
increases in hospitalization, ICU, and death rates.
● Delays in our collective action allow VOC to rise to higher levels and have more
cumulative impact (here assumed effective action taken on March 30).
Caveats
● P.1 and B.1.1.7 assumed to be similar, in the absence of data.
● Projections may worsen if vaccine uptake is less than 85% or effectiveness less than 90%
● Projections may improve by targeting vaccines at transmission hotspots and at essential workers.
19Bending down the VOC curve
Potential mechanisms to reduce VOC transmission:
➔ Rapid testing to detect and isolate individuals without symptoms (asymptomatic and
presymptomatic cases)
➔ Targeting vaccinations to locations and sectors of the population most at risk (reducing
transmission)
➔ Reduce indoor exposure and increase ventilation (lowering aerosol-based transmission)
➔ Identify secondary contacts by rapid testing of primary contacts (before symptoms) and support
individuals in their ability to self-isolate
20Better data, better inference
➔ Expand use of PCR assays to type VOC
◆ to distinguish variants quickly
➔ Report:
◆ VOC typing results daily
◆ WGS results weekly
◆ Essential data for reporting
◆ Relevant sample sizes (denominators), sample weeks and VOC strain
◆ Nature of sampling design for WGS by week, any large-scale sampling biases
(e.g., by region or VOC type), and timelines for WGS.
◆ Rationale by which samples were selected for WGS
➔ For Vaccinations:
◆ Data broken down by age and location, nature of vaccination: age-based v. essential
worker v. hotspot
21Further messages
● Our models give good projections for the short term
● Preventing overflows in hospitals and ICUs calls for reducing transmission by
~40%, using a combination of efforts (increased mitigation measures,
targeted vaccinations, rapid testing, etc.)
● Predictions are limited by data gaps; more accurate models are possible with
greater and more timely access to data
● Data access is also important to assess social inequalities in disease
incidence and vaccine coverage
● Longer-term projections come with high uncertainty, particularly about our
changes in behaviour and any restrictions, but are useful in highlighting what
we need to do, in combination with the vaccine roll-out, to curb VOC growth.
22Appendix: Further details Variants of Concern are now Growth of Variants of Concern dominating the BC epidemic. Plot shows ratio of VOC relative to non-VOC (black points), the line of best fit (allowing for false VOC identification, red curve) and 95% central intervals (red vertical bars). Selection coefficient favouring VOC: s = 0.078 ± 0.002 per day (68% CL) Source (D. Karlen). VoC data from BCCDC (April 7, 2021). VoC are typed by PCR assays for S:N501Y. Selection coefficient estimated with maximum likelihood (next slide). Estimated date of 75% April 14, 2021 and 95% May 8, 2021. For comparison, Ontario reached 75% on March 31 ( 23 https://jamanetwork.com/journals/jama/fullarticle/2778599).
Growth of Variants of Concern

                                Estimates (68% CL):
                                s = 0.078 ± 0.002
                                w = 0.002 ± 0.002     24
You can also read