River Murray Weekly Report
←
→
Page content transcription
If your browser does not render page correctly, please read the page content below
River Murray Weekly Report
For the week ending Wednesday, 27 January 2021
Trim Ref: D21/2130
Rainfall and inflows
Climatic conditions varied over the southern Murray-Darling Basin this week. The week began with heatwave
conditions across much of the southern Basin before lower temperatures and widespread moderate rainfall totals
were recorded. In the Victorian Alps, Falls Creek recorded 64 mm, while in the NSW Snowy Mountains region
Cabramurra recorded 38 mm. Over the irrigation districts, Deniliquin in New South Wales recorded 21 mm, and
Rutherglen in Victoria recorded 17 mm. In the Murrumbidgee catchment Gundagai recorded 35 mm, and in the
Darling catchment Karpa Kora Station, Pooncarie, recorded 50 mm. In South Australia, Peake in the Upper South-
East recorded 16 mm while Yunta in the North East recorded 30 mm.
Further widespread rainfall and mild conditions are forecast across the southern Basin in the coming days. The
Bureau of Meteorology has issued an initial flood watch for the North Central catchments from the Avoca River to
the Broken River.

Map 1: Murray-Darling Basin rainfall for the week ending 27 January 2021. Source: Bureau of Meteorology.

     Subscribe to the River Murray Weekly Report                    River Data website                     Water in Storages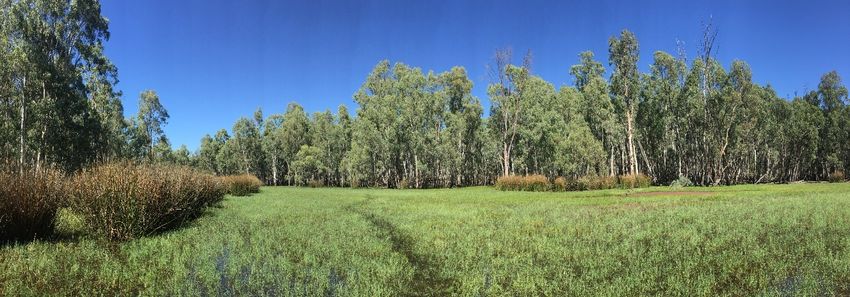
River Murray Weekly Report
Modest stream flow responses were observed in the upper Murray tributaries following the widespread rainfall at
the end of the week. On the Ovens River, Rocky Point increased from 300 ML/day to around 750 ML/day, and the
Kiewa River at Bandiana peaked at near 600 ML/day. Further specific information about flows at key locations can
be found at the MDBA’s River Murray data webpage. Up-to-date river data for sites in the upper Murray can also be
found on BoM’s website and in the Murray River Basin Daily River Report at the WaterNSW website.

River operations
   • Hume dam releases reduced in response to widespread rainfall
   • Lake Victoria continues to be drawn down to support system demands
   • Red alert level for blue-green algae for parts of Sunraysia

Water demand
The MDBA is actively monitoring shortfall risks. A shortfall occurs when water cannot be delivered to users when
and where it is needed. A delivery shortfall occurs when actual water use is higher than it was forecast to be when
river water was released from storages, weeks earlier, to meet the forecast needs for irrigation and environmental
water. A system shortfall occurs when the combined capacity of the system is unable to supply all downstream
requirements over the full season. More information about shortfalls can be found at Water demand (shortfalls) |
Murray-Darling Basin Authority (mdba.gov.au).
The risk of a delivery shortfall in the River Murray between Wakool Junction and the SA border over the coming
week is currently trending towards negligible. Increased (but still low) risk is to be expected, at times, across
summer in response to periods of hot weather. The MDBA is continuing to monitor weather conditions and forecast
demands and will continue to actively manage the risk of delivery shortfall across the high demand summer-autumn
period as conditions evolve.
The risk of a system shortfall is being closely monitored in consultation with states. The system is finely balanced
and the potential for a system shortfall in late summer and early autumn has been identified within river operations
planning scenarios. The MDBA and states will continue to monitor this risk closely over the coming weeks and will
take steps to minimise the risk of a shortfall as necessary. If the forecast rainfall eventuates it is expected to assist in
reducing the risk of any potential system shortfall.
For more information, please see the MDBA’s October update to the 2020-21 River Murray System Annual
Operating Outlook. This update refines the scenarios from the July publication using data to the end of October. The
Operating Outlook may be updated again later this water year if observed conditions deviate significantly from the
scenarios assessed in the report.
The MDBA, Basin state governments and their agencies have different roles and responsibilities in managing
delivery shortfalls. Read more information on delivery shortfall risks for Victorian water licence holders.
Water quality impacts
WaterNSW have recently declared a number of red and amber alerts for blue-green algae in the River Murray
System. Currently, a red alert is declared for the lower River Murray from Mt Dispersion to Lock 9. Amber alerts are
in place at Hume Dam and Yarrawonga Weir. On the River Murray all stations between Picnic Point and Euston Weir
are on amber alert. There is also an amber alert at Lock 8. Along the Edward-Wakool River system amber alerts
remain current for Gulpa Creek, Mathoura, Old Morago, at Moulamein on the Edward River and at the Wakool-
Barham Road station on the Wakool River. It is important that water users regularly keep up to date with algal
alerts, notices and health warnings. This information is available through Goulburn-Murray Water and WaterNSW.
Monthly snapshot of water in the system
River Murray communities can now access a monthly point-in-time snapshot that shows what proportion of water
in the river has been provided for the environment compared with water for towns, industries and irrigators. Find
out more on Flows in the River Murray system.

     Subscribe to the River Murray Weekly Report                 River Data website                     Water in Storages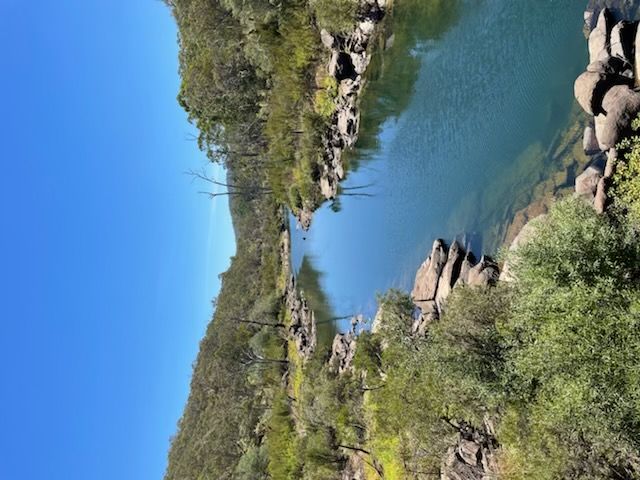
River Murray Weekly Report
River operations
Total active storage reduced over the last week by 106 GL to 4,177 GL (51% capacity).
At Dartmouth Reservoir, the storage decreased slightly by 2 GL to 2,395 GL (62% capacity). The release, measured
at Colemans, continued to target 350 ML/day and is expected to remain around this rate in the coming weeks.
Over the past week the Hume Reservoir storage decreased by 71 GL to 1,642 GL (55% capacity). The Hume release
targeted 16,300 ML/day as the week commenced before gradually decreasing to the current rate of around
11,000 ML/day. The release is expected to continue to decrease in the coming days with further forecast rainfall.
The release continues to supply consumptive demands and system conveyance, and to slow the rate of decline of
Lake Victoria’s storage volume — a typical operational requirement across summer.
                                                                    At Lake Mulwala, the pool level averaged around
                                                                    124.8 m AHD over the Australia Day period in
                                                                    anticipation of high irrigation demands and very
                                                                    hot weather. In response to widespread rainfall
                                                                    following the public holiday, the pool has since
                                                                    risen marginally and is forecast to reach, and
                                                                    possibly exceed, full supply level (FSL) in the
                                                                    coming days. The exact weir pool level reached will
                                                                    depend on a variety of factors including the
                                                                    location and intensity of rainfall, irrigation demand
                                                                    and losses along the River. Targeting levels above
                                                                    FSL is undertaken when necessary to help manage
                                                                    a “rain rejection” of irrigation orders and assist in
                                                                    reducing or preventing unseasonal flooding of the
                                                                    downstream Barmah-Millewa forest.

                                                                    In response to recent and forecast rainfall,
                                                                    diversion to Yarrawonga Main Channel reduced
                                                                    from near 1,000 ML/day to the current rate of
                                                                    around 300 ML/day this week. Similarly, diversion
                                                                    to Mulwala Canal reduced from 5,000 ML/day at
                                                                    the start of the week to the current rate near
                                                                    3,700 ML/day. Of this diversion, just over half is
                                                                    returning to the river system to meet demands
                                                                    downstream of the Barmah Choke.

                                                                    The release from Yarrawonga Weir is currently
                                                                    targeting 9,500 ML/day but may vary over the
                                                                    coming week in response to the level in Lake
Photo 1. Mitta Mitta river from the Horsefall Road Bridge near
                                                                    Mulwala and downstream demands.
Dartmouth town. Source: Digby Jacobs, MDBA.
Flow through the Edward River Offtake has averaged near 1,600 ML/day, while flow through the Gulpa Creek
Offtake has remained near 350 ML/day to help fill wetlands adjacent to the creek.
Downstream, flow through the Wakool River, Yallakool Creek and Colligen Creek offtakes has reduced as the pulse
of water for the environment targeting silver perch recedes. Flow is currently around 85, 300 and 230 ML/day,
respectively. Flows are expected to vary over the coming week depending on rainfall and irrigation demand. All
actions associated with water for the environment are tracked and water usage debited from environmental water
holder (EWH) accounts.

     Subscribe to the River Murray Weekly Report                 River Data website                   Water in Storages
River Murray Weekly Report
Diversion to Wakool Main Canal averaged around 1,100 ML/day until mid-week when it began reducing to the
current rate of 700 ML/day. The flow downstream of Stevens Weir peaked at around 2,630 ML/day near the end of
the week before reducing slightly to the current rate of 2,530 ML/day. It is expected the flow will remain around
this rate over the coming week.
On the Goulburn River, the flow measured at McCoys Bridge has remained relatively steady since the start of
December as Goulburn Inter Valley Trade (IVT) is delivered to the Murray. This week the flow varied around
1,100 ML/day. An initial Flood Watch for North Central catchments from the Avoca River to the Broken River has
been issued and provides more information on possible flows in the Goulburn system over the coming week.
In addition to the Goulburn River, the delivery of water from the Goulburn IVT account to the Murray is continuing
via the Campaspe River and Broken Creek. Combined, IVT deliveries are expected to total 40 GL in each of January
and February. For more information see the Goulburn-Murray Water website. Information regarding opportunities
for allocation trade between the Goulburn and Murray Valleys is available at the Victorian water register website.
Diversions to National Channel have averaged around 1,350 ML/day this week. The release from Torrumbarry Weir
is currently near 6,600 ML/day and is expected to gradually rise again in the coming week.
Inflow from the Murrumbidgee River, measured at Balranald, averaged around 1,000 ML/day and is forecast to
increase over the coming week. The Murrumbidgee IVT balance is open for trade from the Murray to the
Murrumbidgee (85.7 GL) but remains closed for trade from the Murrumbidgee to the Murray. Around 40 GL of
Murrumbidgee IVT was delivered in December and MDBA has called a further 45 GL for January which will be
extended into February.

Photo 2. Pollack Swamp in the Koondrook-Perricoota Forest. Source: Jean Dind, Forestry Corporation of NSW.

At Euston Weir, the weir pool level remains near FSL. The downstream release is currently 7,800 ML/day and
forecast to increase over the coming week.
Menindee Lakes storage decreased by 5 GL to 326 GL (19% capacity) over the last week. At Weir 32, the release
reached around 420 ML/day following widespread rainfall in the area. The flow is expected to slowly reduce over
the coming week. Upstream the flow at Bourke is near 1,000 ML/day thanks to earlier summer rain events further
up the Darling catchment. This flow is expected to gradually reduce over the coming week as the peak of the event
has passed. Some water restrictions remain current in NSW. Links to drought services and assistance can be
accessed via the MDBA drought webpage.
At Wentworth Weir, the weir pool level continues to be managed around FSL. The downstream flow decreased
from around 6,700 ML/day at the start of the week to the current rate near 5,400 ML/day.
Downstream at Lock 9 the weir pool continues to vary near FSL. The Lock 8 and Lock 7 weir pools are 50 cm below
FSL as part of the weir pool variability program and are planned to remain at these levels over the coming months.

     Subscribe to the River Murray Weekly Report                   River Data website                        Water in Storages
River Murray Weekly Report
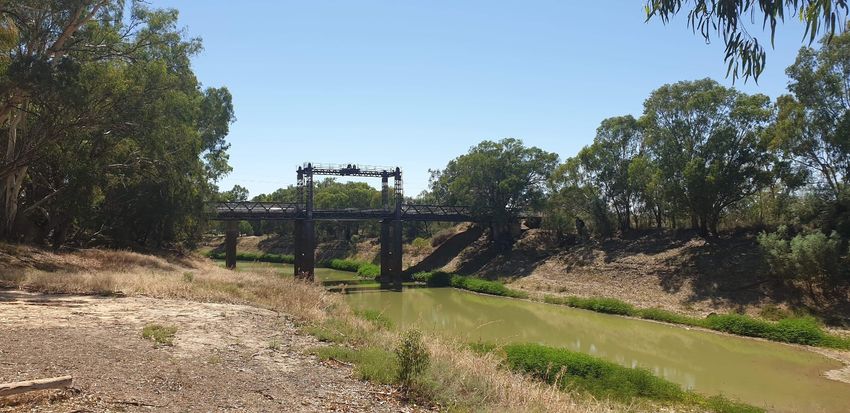
Photos 3: Wilcannia Bridge, Darling River. Source: Donovan McComb-Gray.
This week the storage level at Lake Victoria reduced by 29 GL to 334 GL (49% capacity) as releases continue to
supplement Murray flows to meet system demands. The forecast rainfall over the coming 8 days, downstream of
the choke, may suppress irrigation demands and slow the rate of storage decline over the coming week.
The flow to South Australia averaged near 9,200 ML/day this week and will remain near this rate until the end of
January at which point the flow is expected to decrease to around 8,350 ML/day for February. The flow includes
South Australia’s normal monthly Entitlement flow, small volumes of consumptive trade and water for the
environment. In January, environmental water holders are delivering an additional 40 GL of water for the
environment to South Australia, delivered at an additional rate of around 1,300 ML/day.
The Lower Lakes 5-day average water level is 0.75 m AHD. Barrage releases will continue to be made, when
conditions allow, to push fresh water into the Coorong and to support Black Bream spawning over the coming
months. For information on barrage releases and South Australia’s Entitlement flow, see the South Australian
Department for Environment and Water Weekly River Murray Flow Report.
For media inquiries contact the Media Officer on 02 6279 0141
ANDREW REYNOLDS
Executive Director, River Management
Subscribe to the River Murray Weekly Report River Data website Water in StoragesRiver Murray Weekly Report
Water in Storage Week ending Wednesday 27 Jan 2021
Full Full Current Change in Total
Dead Active
MDBA Storages Supply Supply Storage Current Storage Storage for the
Storage Storage
Level Volume Level Week
(m AHD) (GL) (m AHD) (GL) % (GL) (GL) (GL)
Dartmouth Reservoir 486.00 3 856 460.45 2 395 62% 71 2 324 -2
Hume Reservoir 192.00 3 005 183.99 1 642 55% 23 1 619 -71
Lake Victoria 27.00 677 23.90 334 49% 100 234 -29
Menindee Lakes 1 731* 326 19% (- -) # 0 -5
Total 9 269 4 697 51% -- 4 177 -106
Total Active MDBA Storage 50% ^
Major State Storages
Burrinjuck Reservoir 1 026 727 71% 3 724 -39
Blowering Reservoir 1 631 1 206 74% 24 1 182 -45
Eildon Reservoir 3 334 2 149 64% 100 2 049 -22
* Menindee surcharge capacity – 2050 GL ** All Data is rounded to nearest GL **
# NSW has sole access to water when the storage falls below 480 GL. MDBA regains access to water when the storage next reaches 640 GL.
^ % of total active MDBA storage
Snowy Mountains Scheme Snowy diversions for week ending 26 Jan 2021
Storage Active Storage (GL) Weekly Change (GL) Diversion (GL) This Week From 1 May 2020
Lake Eucumbene - Total 1 226 -53 Snowy-Murray +34 590
Snowy-Murray Component 594 -30 Tooma-Tumut +2 211
Target Storage 1 520 Net Diversion 32 379
Murray 1 Release +39 853
Major Diversions from Murray and Lower Darling (GL) *
New South Wales This Week From 1 July 2020 Victoria This Week From 1 July 2020
Murray Irrig. Ltd (Net) 18.1 392 Yarrawonga Main Channel (net) 5.8 115
Wakool Sys Allowance 3.1 65 Torrumbarry System + Nyah (net) 8.8 172
Western Murray Irrigation 1.3 15 Sunraysia Pumped Districts 5.4 72
Licensed Pumps 7.1 157 Licensed pumps - GMW (Nyah+u/s) 0.7 16
Lower Darling 0.1 1 Licensed pumps - LMW 18.4 272
TOTAL 29.7 630 TOTAL 39.1 647
* Figures are derived from actual and estimates where data is unavailable. Please note that not all data may have been available at the time of creating
this report. ** All data above is rounded to nearest 100 ML for weekly data and nearest GL for cumulative data
Flow to South Australia (GL) Entitlement this month 217.0 *
* Flow to SA will be greater than normal entitlement for Flow this week 64.1 (9 200 ML/day)
this month due to environmental flows.
Flow so far this month 238.2
Flow last month 388.9
Salinity (EC) (microSiemens/cm at 25o C)
Current Average over the last week Average since 1 August 2020
Swan Hill 120 110 100
Euston - - -
Red Cliffs 110 110 130
Merbein - 110 140
Burtundy (Darling) 460 450 370
Lock 9 130 130 130
Lake Victoria 130 130 120
Berri 180 170 160
Waikerie 220 210 210
Morgan 220 220 210
Mannum 240 230 230
Murray Bridge 230 230 240
Milang (Lake Alex.) 710 700 770
Poltalloch (Lake Alex.) 530 580 7 220
Meningie (Lake Alb.) 1 610 1 610 1 630
Goolwa Barrages 970 970 1 240
Subscribe to the River Murray Weekly Report River Data website Water in StoragesRiver Murray Weekly Report
River Levels and Flows Week ending Wednesday 27 Jan 2021
Minor Flood Average Flow Average Flow
Gauge Height Flow Trend
Stage this Week last Week
(m
River Murray (m) local (m) AHD) (ML/day) (ML/day) (ML/day)
Khancoban - - - 1 790 F 4 880 2 540
Jingellic 4.0 1.86 208.38 5 970 F 6 170 3 560
Tallandoon ( Mitta Mitta River ) 4.2 1.59 218.48 980 R 650 630
Heywoods 5.5 3.12 156.75 13 030 F 15 350 15 650
Doctors Point 5.5 2.99 151.46 15 040 F 17 100 17 180
Albury 4.3 2.03 149.47 - - - -
Corowa 4.6 3.09 129.11 15 360 F 16 020 15 770
Yarrawonga Weir (d/s) 6.4 1.56 116.60 9 550 S 9 550 9 360
Tocumwal 6.4 2.15 105.99 9 640 R 9 490 9 230
Torrumbarry Weir (d/s) 7.3 2.29 80.84 6 600 F 6 510 6 290
Swan Hill 4.5 1.30 64.22 6 630 R 6 570 6 610
Wakool Junction 8.8 3.03 52.15 8 250 R 8 120 8 850
Euston Weir (d/s) 9.1 1.41 43.25 7 520 R 7 950 9 420
Mildura Weir (d/s) - - 6 200 F 7 090 7 370
Wentworth Weir (d/s) 7.3 2.80 27.56 5 440 R 5 890 6 050
Rufus Junction - 3.88 20.81 9 130 S 8 820 8 130
Blanchetown (Lock 1 d/s) - 0.89 - 5 430 R 5 400 4 490
Tributaries
Kiewa at Bandiana 2.8 1.08 154.31 580 R 340 350
Ovens at Wangaratta 11.9 7.89 145.57 400 R 330 390
Goulburn at McCoys Bridge 9.0 1.54 92.96 1 070 F 1 140 1 220
Edward at Stevens Weir (d/s) 5.5 2.39 82.16 2 620 F 2 420 1 970
Edward at Liewah - 2.57 57.95 1 950 R 1 900 2 180
Wakool at Stoney Crossing - 1.49 54.98 640 R 570 530
Murrumbidgee at Balranald 5.0 1.47 57.43 1 050 R 1 010 2 130
Barwon at Mungindi 6.1 3.27 - 200 F 380 340
Darling at Bourke 9.0 4.25 - 1 140 F 1 470 1 040
Darling at Burtundy Rocks - 0.75 - 210 F 210 240
Natural Inflow to Hume 1 450 1 840
(i.e. Pre Dartmouth & Snowy Mountains scheme)
Weirs and Locks Pool levels above or below Full Supply Level (FSL)
Murray FSL (m AHD) u/s d/s FSL (m AHD) u/s d/s
Yarrawonga 124.90 -0.04 - No. 7 Rufus River 22.10 -0.52 -28.25
No. 26 Torrumbarry 86.05 -0.00 - No. 6 Murtho 19.25 +0.03 +0.28
No. 15 Euston 47.60 +0.04 - No. 5 Renmark 16.30 +0.05 +0.28
No. 11 Mildura 34.40 +0.04 +0.12 No. 4 Bookpurnong 13.20 +0.03 +0.88
No. 10 Wentworth 30.80 +0.02 +0.16 No. 3 Overland Corner 9.80 +0.06 +0.29
No. 9 Kulnine 27.40 -0.06 -0.52 No. 2 Waikerie 6.10 +0.04 +0.25
No. 8 Wangumma 24.60 -0.50 -0.49 No. 1 Blanchetown 3.20 +0.04 +0.14
Lower Lakes FSL = 0.75 m AHD
Lake Alexandrina average level for the past 5 days (m AHD) 0.75
Barrages Fishways at Barrages
Openings Level (m AHD) No. Open Rock Ramp Vertical Slot 1 Vertical Slot 2 Dual Vertical Slots
Goolwa 128 openings 0.86 All closed - Open Open -
Mundoo 26 openings 0.78 All closed - - - Open
Hunters Creek - - - - Open - -
Boundary Creek 6 openings - All closed - Open - -
Ewe Island 111 gates - All closed - - - Open
Tauwitchere 322 gates 0.79 All closed Open Open Open -
AHD = Level relative to Australian Height Datum, i.e. height above sea level
Subscribe to the River Murray Weekly Report River Data website Water in StoragesWeek ending Wednesday 27 Jan 2021
State Allocations (as at 27 Jan 2021)
NSW - Murray Valley Victorian - Murray Valley
High security 97% High reliability 96%
General security 46% Low reliability 0%
NSW – Murrumbidgee Valley Victorian - Goulburn Valley
High security 100% High reliability 100%
General security 100% Low reliability 0%
NSW - Lower Darling South Australia – Murray Valley
High security 100% High security 100%
General security 30%
NSW : https://www.industry.nsw.gov.au/water/allocations-availability/allocations/summary
VIC : http://nvrm.net.au/seasonal-determinations/current
SA : https://www.environment.sa.gov.au/topics/river-murray/water-allocations-and-announcements
Subscribe to the River Murray Weekly Report River Data website Water in StoragesYou can also read