River Murray Weekly Report - Murray-Darling Basin Authority
←
→
Page content transcription
If your browser does not render page correctly, please read the page content below
River Murray Weekly Report
For the week ending Wednesday, 3rd July 2019
Trim Ref: D19/31913
Rainfall and inflows
Rainfall was widespread across the southern Murray-Darling Basin this week (Figure 1). A cold front and cloud band
tracked eastwards mid-week, bringing rain and thunderstorms over much of Victoria and southern inland New
South Wales. Rainfall totals were greatest in the upper Murray, Ovens and Goulburn catchments. In Victoria, 54 mm
fell at Mitta Mitta, 50 mm fell at Lake Buffalo, both in the north-east and 32 mm fell at Lake Eppalock, in the
Campaspe Valley. In NSW, highest rainfall totals included 27 mm at Cabramurra AWS in the south western slopes
and 22 mm at Coleambally in the Riverina. Very little rain fell in the northern Basin this week.

Figure 1 Murray-Darling Basin rainfall totals for week ending 3rd July 2019 (Source: Bureau of Meteorology)

Rainfall is forecast for the upper Murray catchment over the coming weekend with totals of between 10 and 25 mm
expected.
Flow in the upper Murray tributaries rose following the mid-week rainfall before receding. The current flow at key
locations in the upper Murray catchment including Hinnomunjie Bridge on the upper Mitta Mitta River, Biggara on
the upper Murray, Bandiana the Kiewa River and Peechelba on Ovens River can be found at the MDBA’s River
Murray data webpage. Up-to-date river data for sites in the upper Murray can also be found at Bureau of
Meteorology’s (BoM) website and in the Murray River Basin daily river report at the WaterNSW website.

     Subscribe to the River Murray Weekly Report                     River Data website                       Water in Storages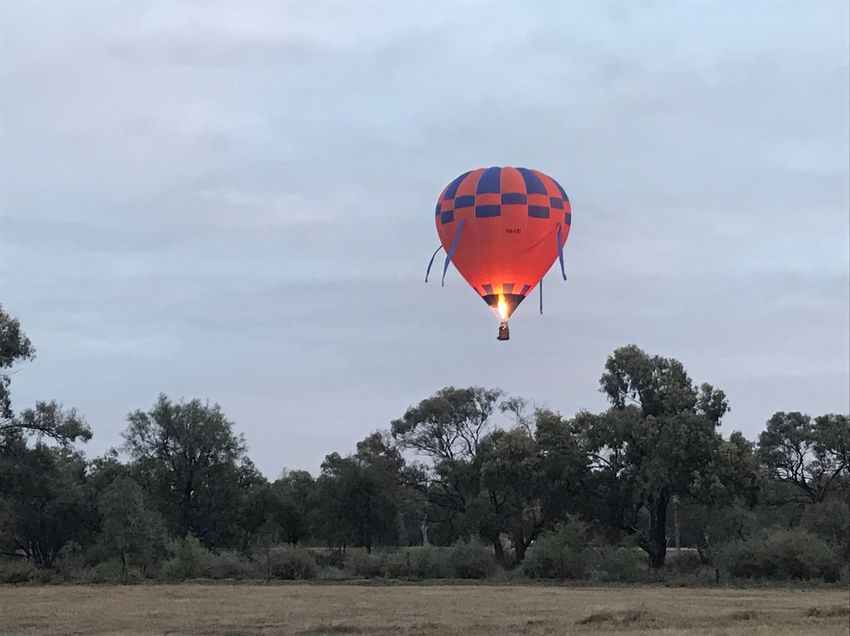
River Murray Weekly Report

June 2019 summary
The BoM reports June 2019 was both warmer than average and drier than average across Australia and the Murray-
Darling Basin.
The Basin’s area-average rainfall was 18.2 mm in June 2019. BoM reported this is 46% below the long-term average
and the 10th lowest on record for June. The dry conditions dominated the northern Basin however, in Victoria and
South Australia, rainfall was mostly near average with patches of above average rainfall through central and
western Victoria along the Basin’s southern fringe (Map 2).
River Murray system inflows for June 2019 remained below average at just over 300 GL. This compares with the
long-term median inflow for June of 442 GL. However, inflows were considerably higher than recent months,
reflecting the relative improvement in catchment soil moisture and flows due to recent rain across the southern
Basin.

Map 2 – Murray-Darling Basin rainfall deciles for June 2019 (Source: Bureau of Meteorology)

The BoM reports that the mean temperature in June 2019 for Australia as a whole was 0.23 °C above average.
Across the Murray-Darling Basin, maximum temperatures were mostly above average and minimum temperatures
were around average, with patches of below average temperatures in the southern Basin (Map 3 & 4).

     Subscribe to the River Murray Weekly Report                     River Data website          Water in Storages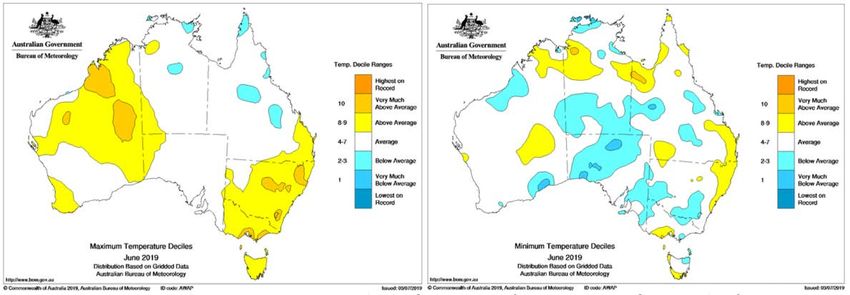
River Murray Weekly Report
Map 3 & 4 – Maximum and minimum temperature deciles for June 2019 (Source: Bureau of Meteorology)
River operations
• Transfers from Dartmouth to Hume Reservoir continue during July at increased rates
• Barmah-Millewa forest regulators opened for winter in-channel environmental watering action
• Winter fresh in the lower Goulburn River is expected to reach the Murray in early July
River operations
The MDBA active storage volume increased by 39 GL this week to 3,287 GL (39% capacity).
At Dartmouth Reservoir, the storage volume decreased by 15 GL to 2,455 GL (64% capacity) as bulk water transfers
from Dartmouth to Hume Reservoir continued. Transfers are being made in preparation for meeting future system
demands downstream of Hume. Based on current conditions and forecasts, the MDBA aims to transfer around
180 GL in July. Whilst adjustments to the monthly transfer volume may occur, overall transfers are expected to
continue through winter and spring if below average inflows continue. Further information can be found on the
MDBA website.
The release from Dartmouth, measured at Colemans, is currently near 3,500 ML/day and is expected to rise in the
coming week towards 5,500 ML/day. Further increases in the flow rate are anticipated in July. Releases will
continue to be varied in a manner that will transfer the target volume to Hume, whilst seeking to minimise erosion
along the Mitta Mitta River.
At Hume Reservoir, the storage volume increased by 41 GL to 741 GL (25% capacity). The Hume release will
increase to approximately 6,000 ML/day over the next week as transfers to Lake Victoria increase. MDBA system
planning suggests that bulk water transfers from Hume Reservoir to Lake Victoria are required to improve the
volume stored in Lake Victoria in readiness for higher system demands later in the season. These transfers have
been commenced relatively early in the season as the risk of water spilling from Lake Victoria is low due to the
relatively low water level in Lake Victoria and BoM’s outlook for drier conditions over winter and early spring.
Transfers to Lake Victoria during July are expected to remain within channel capacity through the Barmah-Millewa
Choke. The volume of bulk water transfers will be regularly re-assessed over the coming months in light of BoM’s
rainfall outlooks, Lake Victoria water levels and updated system planning.
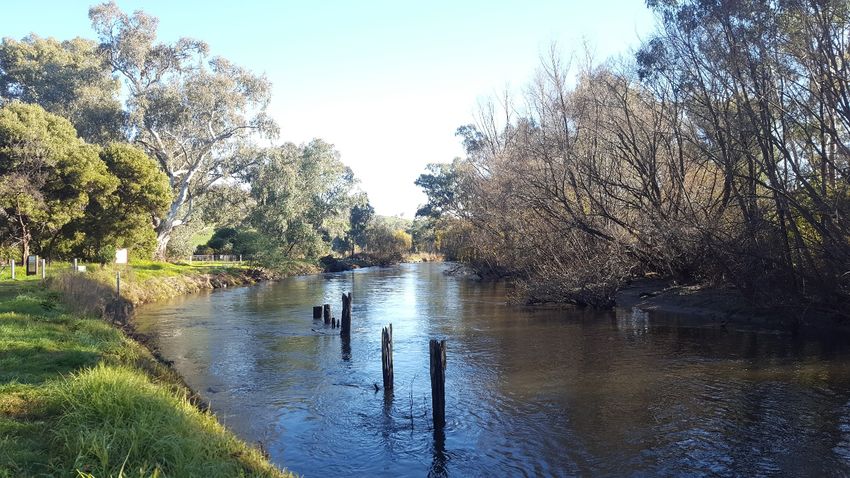
Downstream of Hume Dam, combined inflows from the Kiewa River averaged around 1,500 ML/day (Photo 1) and in
the Ovens River flow increased to 3,300 ML/day. Rainfall forecast for the coming week is likely to result in a further
boost to inflows from the Kiewa and Ovens Rivers.
Subscribe to the River Murray Weekly Report River Data website Water in StoragesRiver Murray Weekly Report
Photo 1: Kiewa River at Killara Wodonga (Photo courtesy of Alisha Caldwell, MDBA)
Downstream at Lake Mulwala the level is currently 124.67 m AHD. The water level is expected to vary over the
coming weeks within the normal operating range of 124.6 and 124.9 m AHD. The release from Yarrawonga Weir is
9,000 ML/day and is expected to increase to around 9,500 ML/day in the coming week. Flows are expected to
remain within channel capacity.
Forest managers have co-ordinated the opening of the regulators in the Barmah-Millewa forest, on behalf of
environmental water holders, to provide connectivity between the river and the floodplain in winter and into spring
while river flows are within channel capacity. This action will increase habitat for native fish and improve the
transfer of valuable nutrients from the floodplain to the river. These nutrients are the base of a food web that
supports the entire river ecosystem including algae, aquatic plants, macroinvertebrates, turtles, fish, platypus and
birds. The water used in the forest will be debited from environmental water accounts. More information about this
environmental watering action can be found in the Goulburn-Broken CMA media release.
The Edward and Gulpa offtakes are currently passing near 1,550 and 220 ML/day respectively. Due to increased
flows in the River Murray at Picnic Point, WaterNSW has reinstated the gates at Gulpa Creek Offtake regulator and
Edward River Offtake regulator to manage the flow below the normal maximum regulated rates. On the Edward
River, at Stevens Weir, flows averaged 1,200 ML/day over the past week. For both the Yallakool and Colligen Creeks,
170 ML/day continues to be delivered on behalf of environmental water holders to provide winter base flows for
the benefit of native fish.
Inflow to the Murray from the Goulburn River, measured downstream at McCoys Bridge averaged 960 ML/day for
the week. Flows are expected to increase over the coming week as an environmental flow pulse from the Goulburn
River reaches the Murray. The environmental pulse is expected to reach approximately 7,800 ML/day at McCoys
Bridge in mid-July and then gradually recede through the remainder of the month. River users in the Echuca district
and downstream should be aware that water levels will rise and then fall noticeably as this pulse from the Goulburn
River travels downstream.
The winter fresh being delivered in the Goulburn River this month aims to improve the health of the lower Goulburn
River and the River Murray. It has been planned by the Goulburn Broken Catchment Management Authority (CMA)
in consultation with the Commonwealth Environmental Water Office and the Victorian Environmental Water
Holder. For more information visit the Goulburn Broken CMA website.
Subscribe to the River Murray Weekly Report River Data website Water in StoragesRiver Murray Weekly Report
The current Goulburn IVT balance is around 160 GL. More information regarding current opportunities for allocation
trade between the Goulburn and Murray valleys is available at the Victorian water register website.
The diversion at National Channel remained steady near 480 ML/day utilising Victorian held environmental
entitlements to maintain flow in Gunbower Creek for the benefit of native fish.
The Torrumbarry Weir pool remains at the current level of 30 cm below Full Supply Level (FSL). Further lowering of
the weir pool by up to 20 cm may be undertaken subject to the ability to maintain suitable river levels at Echuca.
The weir pool will be returned to around FSL by early August in time for the commencement of the irrigation
season. This action is part of the weir pool variability program and aims to help improve the stability of the river
banks and other environmental outcomes within the influence of the weir pool. River users and landholders in the
weir pool should remain aware of the changing water level in case adjustments need to be made to pumps,
moorings and recreational activities. Further information is available in the Torrumbarry Media Release.
The release downstream of Torrumbarry Weir is currently 5,500 ML/day and expected to increase over the coming
week as the Goulburn River pulse arrives in the Murray.
Inflows from the Murrumbidgee River, measured at Balranald, averaged around 1,350 ML/day. This flow is higher
than the normal July end of system target due to the temporary drawdown of a number of weir pools upstream on
the Murrumbidgee River, to facilitate essential maintenance works by WaterNSW over winter. The additional inflow
will be accounted as NSW resource and re-regulated in Lake Victoria. The current Murrumbidgee IVT balance is 18.7
GL. More information regarding current opportunities for allocation trade between the Murrumbidgee and Murray
valleys is available at the WaterNSW website.
At Euston, the weir pool level is currently targeting between 20 cm and 30 cm below FSL. The downstream release
steadily increased this week to around 8,200 ML/day.
In the northern Basin, flows resulting from rainfall in autumn have continued to move steadily downstream. The
flow at Wilcannia peaked at 440 ML/day on 17 June and has now receded to 100 ML/day. Upstream flows have
almost ceased. If any volume reaches the Menindee Lakes it is likely to be small and while positive, will have little
impact on the conditions of the lakes and the lower Darling.
Upstream on the Border Rivers and Gwydir River, releases on behalf of environmental water holders are continuing
to move downstream and along the Barwon River. These flows continue to provide environmental benefit,
recharging parched waterholes, wetlands and landscapes. Flow on the Barwon River reached Boorooma (just
upstream of the junction with the Macquarie River) on Wednesday 26 June with a peak of around 390 ML/day on
30 June. More information on the fish flow event in the Border River and Gwydir River can be found on the MDBA
website and Commonwealth Environmental Water Holders website.
A red level warning (high alert) for blue-green algae remains at Pooncarie on the lower Darling. At Wilcannia on the
Darling River, flow and cooler temperatures over recent weeks has helped reduce the alert level from red to amber.
A summary of alert levels in New South Wales is available on the WaterNSW website. More information regarding
the water quality conditions of the lakes and the lower Darling is available at the WaterNSW website.
The Menindee Lakes storage volume is 15.5 GL (less than 1% capacity). WaterNSW continues to manage the
Menindee Lakes in accordance with the Lower Darling Annual Operations Plan. WaterNSW has advised that releases
at Weir 32 are only planned to recommence when significant inflows are received into the Menindee Lakes. Inflows
are currently zero and no significant inflows are expected in the near future. Water restrictions remain in place
across much of New South Wales as a result of the widespread drought conditions.
On the Murray at Wentworth Weir, the pool level is currently targeting 10 cm above FSL to assist pumpers in the
upper reaches of the Darling River arm of the weir pool whilst there is no inflow from the Darling River. The
downstream release increased slightly to near 6,800 ML/day this week and is expected to continue to gradually rise
in the coming weeks.
Subscribe to the River Murray Weekly Report River Data website Water in StoragesRiver Murray Weekly Report
Photo 2: Hot air balloon flying over black box floodplain near Mildura (photo courtesy of Richard Mintern, CEWO)
The Lock 9 pool level is currently varying between FSL and 10 cm below FSL. At Lock 8, the pool level is targeting
40 cm below FSL. The Lock 7 pool level continues to target around 10 cm below FSL.
At Lake Victoria the water storage level increased by 13 GL to around 285 GL (42% capacity). The level is expected
to continue to gradually increase over coming weeks. The water level is low for this time of year with around 80 GL
less in storage than for the same time last year. Operating the lake in this way was deliberate, aimed at reducing
evaporative loss from the lake through late autumn and winter. This drought management action was approved by
Ministerial Council in late 2018. Bulk transfers from Hume Reservoir are currently underway to boost the volume
stored in Lake Victoria, noting that should dry conditions persist, operations may target a level below full supply
during 2019.
The flow to South Australia is targeting around 4,300 ML/day. This flow is being boosted by small volumes of
environmental water, originally released from Broken Creek and the Goulburn and Campaspe Rivers.
The Lower Lakes 5-day average water level decreased slightly to 0.65 m AHD this week. Around 18.5 GL was
released through the barrages to help improve salinity in the northern Coorong. All fish ways remain open. For
more information see the South Australian Department for Environment and Water’s latest River Murray flow
report
For media inquiries contact the Media Officer on 02 6279 0141
ANDREW REYNOLDS
Executive Director, River Management
Subscribe to the River Murray Weekly Report River Data website Water in StoragesRiver Murray Weekly Report
Water in Storage Week ending Wednesday 03 Jul 2019
Full Full Current Change in Total
Dead Active
MDBA Storages Supply Supply Storage Current Storage Storage for the
Storage Storage
Level Volume Level Week
(m AHD) (GL) (m AHD) (GL) % (GL) (GL) (GL)
Dartmouth Reservoir 486.00 3 856 461.65 2 455 64% 71 2 384 -15
Hume Reservoir 192.00 3 005 176.26 741 25% 23 718 +41
Lake Victoria 27.00 677 23.40 285 42% 100 185 +13
Menindee Lakes 1 731* 15 1% (- -) # 0 -0
Total 9 269 3 496 38% -- 3 287 +39
Total Active MDBA Storage 39% ^
Major State Storages
Burrinjuck Reservoir 1 026 315 31% 3 312 +1
Blowering Reservoir 1 631 725 44% 24 701 +0
Eildon Reservoir 3 334 1 264 38% 100 1 164 +16
* Menindee surcharge capacity – 2050 GL ** All Data is rounded to nearest GL **
# NSW has sole access to water when the storage falls below 480 GL. MDBA regains access to water when the storage next reaches 640 GL.
^ % of total active MDBA storage
Snowy Mountains Scheme Snowy diversions for week ending 02 Jul 2019
Storage Active Storage (GL) Weekly Change (GL) Diversion (GL) This Week From 1 May 2019
Lake Eucumbene - Total 695 +3 Snowy-Murray +14 155
Snowy-Murray Component 325 -12 Tooma-Tumut +5 50
Target Storage 1 170 Net Diversion 9 105
Murray 1 Release +11 197
Major Diversions from Murray and Lower Darling (GL) *
New South Wales This Week From 1 July 2019 Victoria This Week From 1 July 2019
Murray Irrig. Ltd (Net) 0.0 0 Yarrawonga Main Channel (net) 0 0
Wakool Sys Allowance 1.0 0 Torrumbarry System + Nyah (net) 0 0
Western Murray Irrigation 0.1 0 Sunraysia Pumped Districts 0.3 0
Licensed Pumps 0.5 0 Licensed pumps - GMW (Nyah+u/s) 1 0
Lower Darling 0.0 0 Licensed pumps - LMW 4.6 0
TOTAL 1.6 0 TOTAL 5.9 0
* Figures are derived from actual and estimates where data is unavailable. Please note that not all data may have been available at the time of creating
this report. ** All data above is rounded to nearest 100 ML for weekly data and nearest GL for cumulative data
Flow to South Australia (GL) Entitlement this month 108.5 *
* Flow to SA will be greater than normal entitlement for Flow this week 28.4 (4 100 ML/day)
this month due to environmental flows.
Flow so far this month 13.1
Flow last month 118.0
Salinity (EC) (microSiemens/cm at 25o C)
Current Average over the last week Average since 1 August 2018
Swan Hill 90 80 90
Euston - - -
Red Cliffs 100 110 110
Merbein 110 110 100
Burtundy (Darling) - - 900
Lock 9 110 110 110
Lake Victoria 150 140 160
Berri 210 220 190
Waikerie 320 330 240
Morgan 340 330 260
Mannum 280 280 290
Murray Bridge 280 280 320
Milang (Lake Alex.) 1 000 990 940
Poltalloch (Lake Alex.) 580 600 740
Meningie (Lake Alb.) 1 710 1 720 1 650
Goolwa Barrages 5 040 4 190 3 760
Subscribe to the River Murray Weekly Report River Data website Water in StoragesRiver Levels and Flows Week ending Wednesday 03 Jul 2019
Minor Flood Average Flow this Average Flow last
Gauge Height Flow Trend
Stage Week Week
local (m
River Murray (m) (m) AHD) (ML/day) (ML/day) (ML/day)
Khancoban - - - 530 F 2 370 7 180
Jingellic 4.0 1.60 208.12 3 730 F 4 770 8 420
Tallandoon ( Mitta Mitta River ) 4.2 2.43 219.32 4 020 F 4 610 4 300
Heywoods 5.5 2.10 155.73 3 980 F 4 940 2 620
Doctors Point 5.5 2.17 150.64 5 880 R 6 590 4 810
Albury 4.3 1.21 148.65 - - - -
Corowa 4.6 1.65 127.67 6 140 F 5 990 3 990
Yarrawonga Weir (d/s) 6.4 1.53 116.57 9 000 R 7 880 6 740
Tocumwal 6.4 1.99 105.83 8 270 R 7 130 6 370
Torrumbarry Weir (d/s) 7.3 1.97 80.51 5 430 R 5 450 4 910
Swan Hill 4.5 1.18 64.10 5 810 R 5 590 4 590
Wakool Junction 8.8 - - 7 020 R 6 650 5 550
Euston Weir (d/s) 9.1 1.50 43.34 8 160 R 7 660 6 660
Mildura Weir (d/s) - - 7 230 F 6 970 5 890
Wentworth Weir (d/s) 7.3 2.84 27.60 6 760 S 6 300 5 090
Rufus Junction - 2.97 19.90 3 760 F 3 460 3 660
Blanchetown (Lock 1 d/s) - 0.64 - 3 600 F 3 670 4 020
Tributaries
Kiewa at Bandiana 2.8 1.88 155.11 1 790 R 1 500 2 100
Ovens at Wangaratta 11.9 9.04 146.72 3 320 S 2 150 1 990
Goulburn at McCoys Bridge 9.0 1.50 92.92 1 010 S 960 990
Edward at Stevens Weir (d/s) 5.5 1.34 81.12 1 090 F 1 230 1 080
Edward at Liewah - 1.76 57.14 1 070 R 910 750
Wakool at Stoney Crossing - 1.37 54.86 380 F 390 400
Murrumbidgee at Balranald 5.0 1.77 57.73 1 350 R 1 260 1 190
Barwon at Mungindi 6.1 3.07 - 0 F 0 10
Darling at Bourke 9.0 3.15 - 0 F 0 0
Darling at Burtundy Rocks - 0.50 - 0 F 0 0
Natural Inflow to Hume 6 380 4 670
(i.e. Pre Dartmouth & Snowy Mountains scheme)
Weirs and Locks Pool levels above or below Full Supply Level (FSL)
Murray FSL (m AHD) u/s d/s FSL (m AHD) u/s d/s
Yarrawonga 124.90 -0.23 - No. 7 Rufus River 22.10 -0.07 +0.65
No. 26 Torrumbarry 86.05 -0.30 - No. 6 Murtho 19.25 -0.00 +0.01
No. 15 Euston 47.60 -0.24 - No. 5 Renmark 16.30 +0.02 +0.10
No. 11 Mildura 34.40 +0.00 +0.21 No. 4 Bookpurnong 13.20 +0.03 +0.44
No. 10 Wentworth 30.80 +0.08 +0.20 No. 3 Overland Corner 9.80 +0.06 +0.16
No. 9 Kulnine 27.40 -0.10 -0.38 No. 2 Waikerie 6.10 +0.03 +0.11
No. 8 Wangumma 24.60 -0.39 -0.02 No. 1 Blanchetown 3.20 +0.02 -0.11
Lower Lakes FSL = 0.75 m AHD
Lake Alexandrina average level for the past 5 days (m AHD) 0.65
Barrages Fishways at Barrages
Openings Level (m AHD) No. Open Rock RampVertical Slot 1 Vertical Slot 2 Dual Vertical Slots
Goolwa 128 openings 0.69 1 - Open Open -
Mundoo 26 openings 0.66 All closed - - - Open
Hunters Creek - - - - Open - -
Boundary Creek 6 openings - 1 - Open - -
Ewe Island 111 gates - All closed - - - Open
Tauwitchere 322 gates 0.67 2 Open Open Open -
AHD = Level relative to Australian Height Datum, i.e. height above sea level
Subscribe to the River Murray Weekly Report River Data website Water in StoragesWeek ending Wednesday 03 Jul 2019
State Allocations (as at 03 Jul 2019)
NSW - Murray Valley Victorian - Murray Valley
High security 97% High reliability 2%
General security 0% Low reliability 0%
NSW – Murrumbidgee Valley Victorian - Goulburn Valley
High security 95% High reliability 2%
General security 0% Low reliability 0%
NSW - Lower Darling South Australia – Murray Valley
High security 30% High security 31%
General security 0%
NSW : https://www.industry.nsw.gov.au/water/allocations-availability/allocations/summary
VIC : http://nvrm.net.au/seasonal-determinations/current
SA : http://www.environment.sa.gov.au/managing-natural-resources/river-murray
Subscribe to the River Murray Weekly Report River Data website Water in StoragesYou can also read