2019-2020 Lake Monitoring Report - Charlotte-Mecklenburg Storm Water Services Water Quality Program SWIM Phase 1 Part 2-CO
←
→
Page content transcription
If your browser does not render page correctly, please read the page content below

2019-2020 Lake Monitoring Report
  Charlotte-Mecklenburg Storm Water Services
             Water Quality Program
             SWIM Phase 1 Part 2-CO

             Prepared by: Dave Ferguson

             Final Report for FY2019-2020

                          1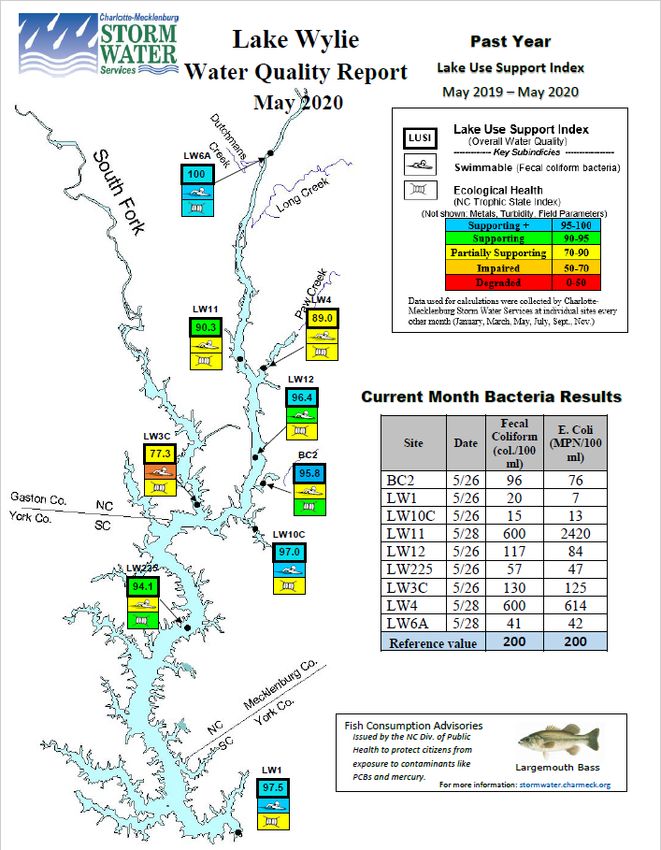
PURPOSE AND BACKGROUND

The Water Quality Program (WQP) of Charlotte-Mecklenburg Storm Water Services (CMSWS)
has an ongoing program to monitor the water quality in the three Catawba River Lakes bordering
the county: Lake Norman, Mountain Island Lake and Lake Wylie. Samples are also routinely
collected at the two water bodies in the northern end of Mecklenburg County separated from
Lake Norman proper by interstate I-77: Lake Cornelius and Lake Davidson. Data collected from
all lake sites are used to screen for environmental problems using CMSWS Action and Watch
levels for various pollutants and to rate the overall water quality at sampling locations in the
lakes using a water quality index. Additional objectives are to describe seasonal trends and
address spatial variability in the data. This report presents the lake monitoring data for the
sampling period of July 2019 through May 2020.
ACTIVITIES AND METHODS
Routine lake sampling was conducted every other month beginning in July (July, September,
November, January, and May). Lake sampling did not occur in March 2020 due to the
coronavirus pandemic temporarily interrupting CMSWS monitoring operations. Five
locations were sampled in Lake Norman, one location each on Lake Cornelius and Lake
Davidson, ten locations in Mountain Island Lake, and eleven sampling locations in Lake Wylie
(Appendices A, B, and C.) These routine locations were also sampled in August 2019 and June
2020 for fecal coliform and E. coli bacteria. Additional monitoring sites (referred to as summer
bacteria sites) were sampled for fecal coliform and E. coli bacteria during the summer months
(May through September) for all lakes. All sampling efforts were conducted in accordance with
approved SOPs.
During all routine lake runs, field measurements were collected using a calibrated YSI EXO 2
multiprobe at a depth of 0.2 meters at each site. Field measurements included: temperature,
dissolved oxygen, pH, conductivity, and turbidity. Water transparency was measured in the field
utilizing a visual Secchi disk with depth reported in meters.
Water samples were collected using a Labline composite sampler to a depth of twice the Secchi
depth and were placed on ice and transported to the Charlotte Water Laboratory where they were
analyzed by standard methods. Water chemistry samples collected at all regular monitoring sites
were analyzed for the following parameters: nutrients (total phosphorus, TKN, NH3, and NO2-
NO3), chlorophyll a, turbidity, fecal coliform bacteria, and E. coli bacteria.
Metals samples were collected at all routine sites during the January and July sampling runs.
Lake bottom samples were collected during the July sampling run and were analyzed for metals.
At monitoring site AL1 located in upper Lake Wylie at Allen Steam Station ash basin discharge ,
metals were sampled during every routine lake run including June and August fecal runs.
Twelve metals parameters were analyzed: mineral metals (copper, iron, manganese, and zinc)
and toxic metals (arsenic, barium, cadmium, chromium, lead, nickel, mercury and selenium).
CMSWS staff also conducted monthly grab sampling from three sampling sites on Lake Norman
(LN-UP, MA1, and MA2) and four sampling sites on Mountain Island Lake (MI9, MI3D, RB1,

                                                2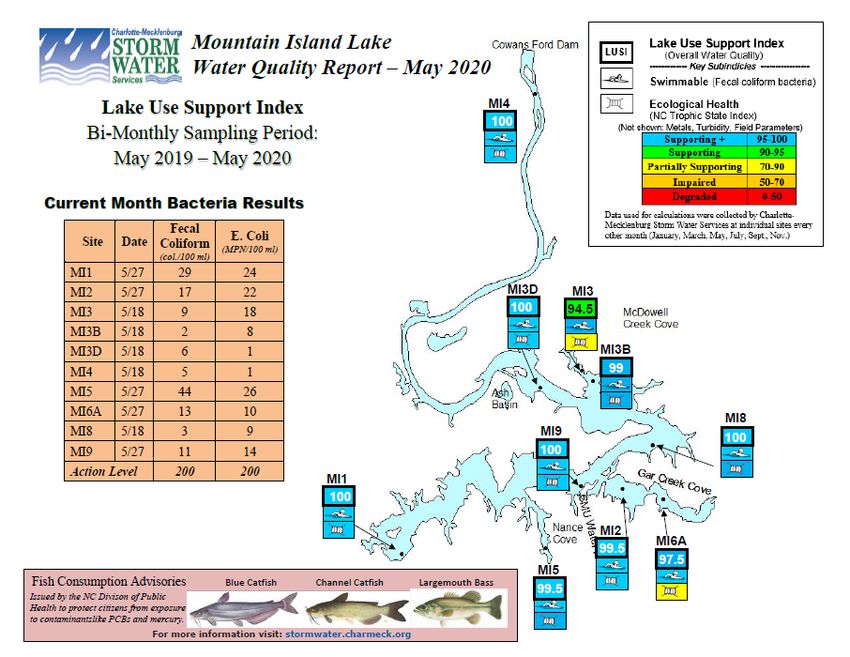
and RB-UP). These sites are located near Marshall and Riverbend Steam Stations, and this
monitoring effort was conducted in a partnership with Charlotte Water. “Coal ash” sites were
sampled for the following parameters: metals, mercury, sulfate, bromide, and total dissolved
solids. Coal ash sampling results were reported quarterly and annually to Charlotte Water, or
with more frequency when high alert sample results were received.
All lab data were extracted from Charlotte Water Laboratory Services LABWORKS database
and reviewed by the designated Environmental Analyst for QA/QC purposes before being
entered in the Water Quality Data Repository. The North Carolina Trophic State Index (NCTSI)
which includes total phosphorus, Secchi depth, and organic nitrogen was calculated by using a
formula developed as part of North Carolina’s original Clean Lakes Classification Survey
(NCDEM 1982). The NCTSI score for each lake was calculated by averaging the scores from all
sites for each lake during the growing season (May through September).
The Lake Use Support Index (LUSI) was calculated for all regular sampling sites using EXCEL.
Maps were generated using WORD, published to the CMSWS website and presented to their
respective lake marine commissions. Since May is the last routine sampling event of the fiscal
year and includes the data for the entire fiscal year starting in July, May LUSI maps are
presented in this report.
RESULTS AND DISCUSSION
North Carolina Trophic State Index
The North Carolina Trophic State Index (NCTSI) is calculated by using chemical and physical
parameters to determine the productivity of a lake. The NCTSI formula for this calculation is
shown below in Table 1.
Table 1. NCTSI Formula

                         North Carolina Trophic State Index (NCTSI) Formula

     NCTSI =    TONScore         +      TPScore         +        SDScore      +     CHLScore

                              TON -    Total Organic Nitrogen (mg/l)
                               TP -    Total Phosphorus (mg/l)
                               SD -    Secchi Depth (inches)
                              CHL -    Chlorophyll a (ug/l)

The North Carolina Trophic State Index (NCTSI) was calculated for each lake by averaging all
sites during the growing season (May through September) and comparing this with the results
from past years to assess the degree of eutrophication for each reservoir. Eutrophication is the
process of increased nutrient input and concentration in a body of water, either due to natural

                                                  3
causes or human influences. (New Hampshire Department of Environmental Services, 2010).
Each lake is given a designation based on their NCTSI score of one of the following possible
descriptors: oligotrophic, mesotrophic, eutrophic, or hypereutrophic. The classification index
scale is shown below in Table 2.
                                           Table 2. NCTSI Index Scale

                                               NCTSI Index Scale

                                         Score             Trophic State
                                         < -2.0            Oligotrophic
                                       -2.0 - 0.0          Mesotrophic
                                        0.0 - 5.0            Eutrophic
                                          >5.0            Hypereutrophic

The amount of rainfall that occurs during an assessment period can affect the chemical and
physical parameters used in the NCTSI calculations. Table 3 shows the total rainfall amounts for
each lake during the summer assessment period for 2017 - 2019. To note, the 2019 rainfall
amounts were much lower than the rainfall amounts recorded during 2017 and 2018. Even with
the reduction in rainfall amounts, lake classifications remained the same from 2018 to 2019 with
very little change in average lake-wide NCTSI scores for summer monitoring events (Table 4). .
        Table 3. Rainfall amounts by lake during summer months 2017 vs 2019 (CMSWS FINS network rain gauges)

                           May 2017 – Sept 2017           May 2018 – Sept 2018           May 2019 – Sept 2019
        Lake
                               total rainfall                 total rainfall                 total rainfall
       Norman                    23.76 in                       22.63 in                        14.3 in
   Mountain Island               25.15 in                       19.68 in                        15.4 in
        Wylie                    22.89 in                       22.32 in                       17.59 in
 Davidson / Cornelius              23 in                         22.4 in                        13.7 in

                                                         4
Table 4. Mean summer NCTSI values by lake from 2016 - 2019
2016 2017 2018 2019
Lake NCTSI Trophic
NCTSI Trophic NCTSI Trophic NCTSI Trophic
Score Classification
Score Classification Score Classification Score Classification
Norman -3.9404 Oligotrophic -4.2792 Oligotrophic -3.96238 Oligotrophic -3.9767 Oligotrophic
Mt. Island -2.5586 Oligotrophic -2.977 Oligotrophic -2.40889 Oligotrophic -3.281 Oligotrophic
Wylie -1.0988 Mesotrophic -1.357 Mesotrophic -0.53158 Mesotrophic -1.8716 Mesotrophic
Cornelius -0.5477 Mesotrophic -1.1112 Mesotrophic -1.1263 Mesotrophic -1.7687 Mesotrophic
Davidson -1.8944 Mesotrophic -2.7777 Oligotrophic -2.6772 Oligotrophic -3.7553 Oligotrophic
Lake Use Support Index (LUSI)
Background and Overview
Charlotte-Mecklenburg Storm Water Services (CMSWS) uses an index to rate lake water quality
called LUSI or the Lake Use Support Index. Developed in 2009 by the Water Quality Program,
LUSI is based on whether the water quality in the monitored lake is meeting North Carolina
water quality standards and is set on a 100 point scale. If these standards are met, surface water
quality is supportive of its designated use, hence the name Lake Use Support Index. LUSI is
based on five categories of parameters called sub-indices that County staff has determined to be
most important for assessing the quality and usability of Mecklenburg County’s lakes.
The five (5) sub-indices for LUSI are:
• Human Health - fecal coliform bacteria
• Sediment – turbidity
• Field Data - temperature, dissolved oxygen and pH
• Eutrophication - North Carolina Trophic State Index
• Metals - 12 mineral and toxic metals
5Table 5 LUSI Rating Scale
LUSI
Rating
Score
> 95 Supporting +
90 - 95 Supporting
70 – 90 Partially Supporting
50 – 70 Impaired
< 50 Degraded
Calculation of LUSI Scores
LUSI scores are based on data collected from six sampling events during the prior 12 months
(every other month starting in July) except for metals which are only sampled twice a year. If
the water quality standard is met for a subindex, then that sampling event is assigned the
maximum score of 16.67 (100 ÷ 6 = 16.67). All LUSI subindex scores are calculated by totaling
the scores from the six sampling events and applying the rating scale described in the table
above. If the water quality standard is met for all six sampling events the maximum LUSI
subindex score of 100 is achieved. Where appropriate, several subindicies, including fecal
coliform bacteria, also have intermediate scores corresponding to Watch levels. The
Eutrophication (algal growth) subindex is based on the North Carolina Trophic State Index
(NCTSI). The NCTSI measures the productivity of the lake using nutrients (total organic
nitrogen and total phosphorus), chlorophyll a and water transparency (Secchi depth) to rate lakes
as oligotrophic, mesotrophic or eutrophic ranging from very low to very high nutrient content,
respectively. For each sampling period, the NCTSI rating is assigned a score from 16.67 for
oligotrophic to 0 for hypereutrophic. For all subindicies, if the standard or intermediate scores
are not met, a score of 0 is assigned. The five subindex scores are weighted equally and
combined to arrive at the overall LUSI score.
Data Reporting
Lake specific LUSI maps are created for routine lake monitoring sites after each routine
sampling month. On the maps, each sampling site contains a color-coded box. The LUSI score is
presented at the top of the color-coded box. The fecal coliform subindex indicates if the
sampling site is “Swimmable” and is illustrated in the middle of the color-coded box with a
swimming figure. The “ecological health” of a site uses the NCTSI score and is represented by
an algae figure in the bottom of the color-coded box.
6Historical Values
Lakewide averages of LUSI scores for the past 11 years show differences between the major
lakes (Figure 1). The monthly average for Lake Norman sites rates the highest with scores near
100 followed by the monthly average for Mountain Island Lake and Lake Wylie. Lake Wylie is
the most susceptible reservoir to sediment pollution due to inputs from multiple major tributaries,
a shallow main channel, and an overall riverine shape. The figure below depicts all LUSI scores
by month historically from July 2009 through May 2020 for Lake Norman, Mountain Island
Lake, and Lake Wylie.
7Figure 1 Historical LUSI scores - July 2009 -- May 2020
Lake Use Support Index (LUSI)
July 2009 - May 2020
102
100
98
96
94
LUSI Scores
92
Supporting (Good/Excellent)
90
88 Partially Supporting (Fair)
86
84
82
80
JULY
MAR
JULY
MAR
JULY
MAR
JULY
MAR
JULY
MAR
JULY
MAR
NOV
JULY
MAR
NOV
JULY
MAR
NOV
JULY
MAR
NOV
JULY
MAR
NOV
JULY
MAR
NOV
NOV
NOV
NOV
NOV
NOV
2009 2010 2011 2012 2013 2014 2015 2016 2017 2018 2019 2020
Norman Mtn Island Wylie
*No routine lake monitoring efforts were conducted in March 2020 due to the coronavirus temporarily interrupting CMSWS operations
8LUSI Maps
The following section presents Lake Use Support Index (LUSI) results from May 2020. Since
LUSI is scored using an annual trailing average, the May maps should represent the six sampling
results from the fiscal year 2019-2020, however March 2020 was omitted due to the coronavirus
pandemic temporarily interrupting monitoring efforts; therefore, only five sampling events were
evaluated instead (July 2019, September 2019, November 2019, January 2020, and May 2020.)
Lake specific fish consumption advisories are shown on each map.
9Figure 2: Lake Norman (with Lake Cornelius and Lake Davidson)
LUSI scores and fecal coliform levels for July 2019-May of 2020 at all Lower Lake Norman monitoring sites as well as Lake Cornelius and Lake
Davidson were in the Supporting+ range. NC Trophic State Index scores from 2019-2020 for Lower Lake Norman and Lake Davidson sites were all
Supporting+, while Lake Cornelius rated as Supporting for the year.
10Figure 3: Mountain Island Lake
LUSI scores for all sites on Mountain Island Lake except for MI3 were in the Supporting+ range. Site MI3 recorded a LUSI score of Supporting. For
NC Trophic State Index, sites MI3 and MI6A scored Partially Supporting. These results display common themes in Mountain Island Lake showing
that most sediment and nutrient issues are due to the McDowell Creek and/or Gar Creek watersheds.
11Figure 4: Lake Wylie
LUSI scores for Lake Wylie sites varied in comparison from sampling years 2018-2019 to 2019-2020. Sites LW11,
LW12, LW4, LW225, and LW3C declined in LUSI scores, while sites BC2, LW1, and LW10C improved. Site LW6A
remained at a LUSI score of 100 for yet another monitoring year. The decline in LUSI scores for these sites is attributed
to increases in rainfall in the Dutchman’s and South Fork Catawba River watersheds for the sampling period when
compared to the previous year’s sampling period.
12Table 6 – Exceedances of Selected NC Water Quality Standards and CMSWS Action Levels – 2019 - 2020
CMSWS ACTION LEVELS
pH Total Fecal col.
Chl a Temp. D.O. < 200
>40 Turbid. >32 5.0 or NC Stand. Exceed . >0.04 >0.65 col/100
Lake Norman ug/l >25 ntu Deg. C ppm >9.0 Exceed. ppm ppm ml
LN1 Near Cowan's Ford Dam 0 0 1 0 0 1 0 0 0 0
LN2 Ramsey Creek Arm 0 0 2 0 0 2 0 0 0 0
LN4 Main Channel 0 0 0 0 0 0 0 0 0 0
LN5 CMU Water Intake 0 0 2 0 0 2 0 0 0 0
LN9 Davidson Creek/Reeds Creek 0 0 0 0 0 0 0 0 0 0
Lake Cornelius and Davidson
LC2 Center of Lake Cornelius 0 0 0 0 0 0 0 0 0 0
LD5 Off Lakeview St. 0 0 0 0 0 0 0 0 0 0
Mountain Island Lake
MI1 Near Dam 0 0 0 0 0 0 0 0 0 0
MI2 Gar Creek Cove 0 0 0 0 0 0 0 0 0 0
MI3 McDowell Creek Cove 1 0 0 0 0 0 0 0 0 0
MI3B McDowell Creek Cove 0 0 0 0 0 0 0 0 0 0
MI3D Uplake of McDowell Creek 0 0 0 0 0 0 0 0 0 0
MI4 Headwaters, Hwy 73 0 0 0 0 0 0 0 0 0 0
MI5 Shuffletown Boat Landing 0 0 0 0 0 0 0 0 0 1
MI6A Upper Gar Creek Cove 0 0 0 0 0 0 0 0 0 0
MI8 Downlake McDowell Creek 0 0 0 0 0 0 0 0 0 0
MI9 Charlotte Water Intake 0 0 0 0 0 0 0 0 0 0
Lake Wylie
LW1 Near Dam 0 0 0 0 0 0 0 0 0 0
LW10C Wither's Cove 0 0 0 0 0 0 0 0 0 0
LW11 Uplake Paw Creek Cove 0 1 0 0 0 1 0 1 0 1
LW12 Uplake Browns Cove 0 0 0 0 0 0 0 0 0 0
LW225 Buster Boyd Bridge 0 0 0 0 0 0 0 0 0 1
LW3C South Fork Catawba 0 2 1 0 0 3 1 2 1 3
LW4 Paw Creek Cove 0 0 0 0 0 0 0 1 0 1
LW6A Headwaters above Hwy 27 0 0 0 0 0 0 0 0 0 0
BC2 Brown's Cove, middle 0 0 0 0 0 0 0 0 0 1
Total Lake Norman 0 0 5 0 0 5 0 0 0 0
Total Lake Cornelius and 0
Davidson 0 0 0 0 0 0 0 0 0
Total Mountain Island Lake 1 0 0 0 0 0 0 0 0 1
1
Total Lake Wylie 0 3 1 0 0 4 4 1 7
Total # of Exceedances 1 3 6 0 0 9 1 4 1 8
13No exceedances of the state standard for pH or dissolved oxygen were observed during the 2019
– 2020 sampling period at any of the routine lake monitoring sites.
There was only one (1) occurrence for the sampling period of an exceedance of chlorophyll A
concentration (40 ug/l) at site MI3, McDowell Creek Cove. The exceedance occurred on July
29, 2019. This is not uncommon considering the amount of rainfall in the area at that time as
well as elevated water temperatures combined with a very shallow, very nutrient-rich body of
water such as McDowell Creek cove. No actions were taken as a result of this exceedance.
There were three (3) occurrences for the sampling period of an exceedance of turbidity (25 ntu).
Two of these occurrences were at site LW3C in the South Fork Catawba River, which is not
uncommon. The South Fork is, by far, the most turbid area of Lake Wylie that CMSWS
routinely monitors , and during any rainfall event, it is often extremely turbid. The third
occurrence was at LW11, a main-channel monitoring site just upstream of the confluence of Paw
Creek and the Catawba River channel. Each of these occurrences were due to rainfall in the area
in the immediate days before monitoring occurred. No actions were taken due to these
exceedances.
There were four (4) occurrences where total phosphorus levels were higher than the state
standard at the time of sampling, all on Lake Wylie. Two (2) occurred at site LW3C, one (1) at
site LW11, and one (1) at site LW4. These occurrences were also caused by rain events near
time of sampling, causing heavier turbidity in the water column, and such, higher nutrient
content in the sampled area as well. No actions were taken due to these exceedances.
There was only one (1) exceedance of metals during the sampling period. At site LW3C, the
iron analytical result returned a value of 1700 ug/l. This observation, as previously discussed in
this report, was caused by the amount of sediment suspended in the water column from rainfall at
the time of sampling. No actions were taken due to this exceedance.
There was only one (1) exceedance where nitrate/nitrite levels were higher than the state
standard at the time of sampling, site LW3C on Lake Wylie. Again, this observation was
directly caused by the amount of sediment suspended in the water column at time of sampling.
No actions were taken due to this exceedance.
Exceedances of Fecal Coliform Action Levels
Eight (8) occurrences of the CMSWS Action Level for fecal coliform bacteria were observed
during the sampling period: seven (7) from Lake Wylie and one (1) from Mountain Island Lake.
All occurrences were observed after localized heavy rainfall events. The table below depicts
fecal coliform sample results alongside the actual turbidity values for each site when an
exceedance occurred. The link between turbidity and bacteria appears to be directly
proportional, especially in Mountain Island Lake and Lake Wylie, where the observance of
slightly turbid water is much more frequent than Lake Norman, Lake Cornelius, and Lake
Davidson. Also, results indicate that in the warmer months, increased water temperature can
increase the number of bacteria present in cove areas regardless of higher turbidity values.
14Table 7 Fecal coliform exceedances for the sampling period 2019-2020 with lab NTU results
Sampling
Site Lake Fecal Lab
Date Col. NTU
BC2 Wylie 7/24/19 220 6.5
LW3C Wylie 7/24/19 260 5.4
MI5 Mt Island 8/15/19 220 3.75*
LW3C Wylie 9/25/19 440 9.4
LW225 Wylie 1/29/20 210 16
LW3C Wylie 1/29/20 490 36
LW4 Wylie 5/28/20 600 18
LW11 Wylie 5/28/20 600 100
* NTU results taken from YSI Exo Multiparameter sonde, no lab data
Metals Sampling near the Allen Steam Station Discharge
Metals samples were collected at the ash basin discharge of Allen Steam Station on Lake Wylie
during routine and summer fecal sampling runs (Table 4). No exceedances of the state standard
occurred during this assessment period.
Table 8 Allen Steam Station Discharge Sampling – Site Al1 (results in ug/l)
NC
Analyte 7/24/19 8/20/19 9/25/19 11/18/19 1/29/20 5/26/20
Stand.
Arsenic 10SUMMARY AND CONCLUSIONS
1. All five lakes remained in the same NCTSI trophic classification from monitoring year
2018-2019 to 2019-2020. Historically, there has been very little change from year-to-
year in the NCTSI when the majority of monitoring events are conducted more than 48
hours after precipitation (lower turbidity levels). This holds true when comparing 2018-
2019 to 2019-2020 data.
2. During the 2019-2020 sampling effort, the Catawba River chain of lakes did not
experience a major drought in summer or fall, however in mid-February of 2020 and late
May of 2020, major rain events caused Mountain Island Lake’s levels to approach and
exceed their full capacity. Norman and Wylie also rose to high levels but never breached
the “full” capacity level. Figure 5 below graphically displays the lake levels for the
FY19-20 sampling time period.
3. No state standards were exceeded during the 2019-2020 monitoring effort for the Allen
Steam Station coal ash basin discharge site (AL1) on Lake Wylie.
16Figure 5 Duke Lake Levels for Lake Norman, Mountain Island Lake, Lake Wylie FY19-20
Lake Levels
July 2019 - June 2020
102
2/13/2020, 101.7 5/29/2020, 101.2
101
100
99
98
97
96
95
94
7/1/2019 8/1/2019 9/1/2019 10/1/2019 11/1/2019 12/1/2019 1/1/2020 2/1/2020 3/1/2020 4/1/2020 5/1/2020 6/1/2020
Norman Mtn Island Wylie Full Pond
17CHANGES TO SAMPLING LOCATIONS
No site changes occurred to the routine monitoring site regiment during the 2019-2020 sampling
effort.
REFERENCES
New Hampshire Department of Environmental Resources. 2010. Environmental Fact Sheet.
NHDES, Concord, New Hampshire.
NCDEM(North Carolina Divison of Environmental Management). 1982. North Carolina Clean
Lakes Classification Survey 1982. NCDEM Report No. 83-03. North Carolina Division
of Environmental Management. Raleigh, NC.
CMSWS (Charlotte Mecklenburg Storm Water Services). 2015.
Lake Monitoring Data Summary for 2014. CMSWS, Charlotte, NC.
Lake Program Review and LUSI Document. CMSWS, Charlotte, NC.
CMSWS (Charlotte Mecklenburg Storm Water Services). 2016.
Lake Monitoring Data Summary for 2015. CMSWS, Charlotte, NC.
Lake Program Review and LUSI Document. CMSWS, Charlotte, NC.
Dave Ferguson-Senior Environmental Specialist
July 29, 2020
18Appendix A - Lakes Norman / Davidson / Cornelius Monitoring Locations
19Appendix B – Mountain Island Lake Monitoring Locations
20Appendix C - Lake Wylie Monitoring Locations
21You can also read