Quality Checking and Conservation of Lakes in Navi Mumbai Region - sersc
←
→
Page content transcription
If your browser does not render page correctly, please read the page content below
International Journal of Advanced Science and Technology
                                                                           Vol. 29, No. 8s, (2020), pp. 2043-2050

      Quality Checking and Conservation of Lakes in Navi Mumbai Region
               Harshad Thakur, MalharPawar, JagrutVaviya, Harshvardhan Kamble
                                         Pooja Somani
                University of Mumbai , Saraswati College of Engineering Kharghar, Navi
                                       Mumbai – 410210

                                                    Abstract
          Majority of lakes in Navi Mumbai are polluted, says a survey of 35 lakes in the city
          conducted from December 2018 to April 2019. The area which is surveyed freshwater lakes
          from Digha to Belapur, only six lakes were relatively clean while the remaining 29 had water
          unfit for human consumption. The study was conducted to get informative data of Navi
          Mumbai’s lakes for future developmental decisions. In those 35 lakes which were identified
          using Hydrology surveys and field survey, the study found more than 60% of lakes were
          polluted, 13% had a foul odor and only 20% were clean. While water from 36% of lakes was
          being used to wash clothes, vehicles and animals were washed across 19%, and another 19%
          were used for bathing. However, no industrial waste were being released into any lake. All
          lakes are used for idol immersions, dumping of solid waste like food remain, plastic covers
          and nirmalaya [flower waste]. At certain lakes, the water appeared blackish brown with an
          oil film on the surface. Majority of lakes appeared polluted and because of that the water is
          unfit for aquatic life as well as for daily use. Debris and construction material was also found
          dumped at the edges of a few lakes. If properly maintained, these lakes can be helpful for
          many purposes. They can help to regain the beauty of surrounding as well as it can also help
          of ground
          Keywords: Lakes, deposition, Turbidity, Sampling.

              1. INTRODUCTION
          A lake is an area filled with water, located in a basin, surrounded by land, apart from any
          river or other outlet that serves to feed or drain the lake. Lakes are generally larger, deeper
          and wider than ponds. Natural lakes are found in mountain areas, and in natural deep land
          areas. Other lakes (Manmade lakes)are found on the ground where the only source of pure
          water is rain water and no outlet is present. Indian lakes are mainly classified into 4 types 1)
          Temporary lakes: These lakes may exist for temporary basis like for particular season. This
          lakes are mainly formed due to small depressions of undulating ground after a heavy shower.
          In this kind of lakes, Evaporation is greater Precipitation. Example: Small lakes of
          Mumbai.2) Permanent lakes:-In this kind of lakes, Evaporation is less than Precipitation.
          These lakes are deep and carry more water than could not be evaporated easily.
          Example: manmade lakes. 3) Fresh water lakes:-Most of the lakes in the world are fresh-
          water lakes source is by rivers and with out-flowing streams e.g. Great Lakes of North
          America. 4) Saline lake:-Salt lakes can form where there is no natural outlet or where the
          water evaporates rapidly and the drainage surface of the water table has a higher-than-normal
          salt content. Examples of salt lakes include Great Salt Lake.Water reclamation, and for our
          daily life activities
              2. PURPOSE OF STUDY
          In Navi Mumbai there are handful of lakes and majority of lakes are polluted. To know the
          impurities of the lake water and if the aquatic life can survive in it. To find remedial measures
          and convert the site into recreational area. This is our purpose of study.

ISSN: 2005-4238 IJAST                                                                                      2043
Copyright ⓒ 2020 SERSC
International Journal of Advanced Science and Technology
Vol. 29, No. 8s, (2020), pp. 2043-2050
3. METHODOLOGY
Site Selection Points
Distance- Close proximity to the site, enabling a thorough evaluation. Activities conducted
on lake- The lake water which used for multiple purpose can give actual characteristic as
compared to unused lake. Environmental conditions- Conditions like Temperature,
Weather, and Natural calamities can greatly affect the properties of lake water.
Surroundings- The nature and properties on lake water is totally dependent on its
surroundings e.g.: - lake water surrounded by industries has lower ph. value than lake
surrounded by society. Based on the above pointers, 3 lakes where shortlisted for evaluation
Sample collection
Sampling points is selected such that the samples taken should represent the different sources
from which water is obtained.These points should include those that yield samples
representative of the conditions at the most unfavorable sources or places in the supply
system, particularly points of possible contamination such as unprotected sources, reservoirs,
low or high pressure zones, ends of the system, etc.Sampling points should be uniformly
distributed throughout the lakes system, taking water distribution into account; the number of
sampling points should be proportional to the number of water availability.The points chosen
should generally yield samples that are representative of the system as a whole and of its
main components.Sampling points should be located in such a way that water can be sampled
from reservoirs, etc.In systems with more than one water source, the locations of the
sampling points should take account of the number of inhabitants served by each
source.There should be at least one sampling point directly after the clean-water outlet from
each treatment plant.
Test Conducted on lake water
Temperature: It is one of the most important parameter in testing of lakes water,
Temperature of water can change due to many reasons like climate change, pollution etc.
Rise in temperature results in increase in bacterial count. Ideal temperature of lake water
ranges from 7C0-27C0
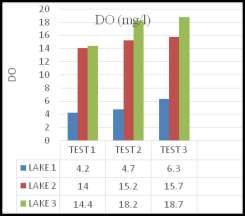
TDS: Total dissolve solids is used to calculate amount of dissolved combined content of
all inorganic and organic substances present in water. Its ideal range500 mg/l.TSS: Total
suspended solidsare the dry-weight of suspended particles that are not dissolved, in a sample
of water that can be trapped by a filter paper. Its minimum value shoes the better quality of
water.
DO: Dissolve oxygen is the amount of Oxygen present inside the water, DO is the most
important aspect for survival of aquatic life. It should be greater than Greater than 5mg/l in
lake water.
BOD: Biochemical Oxygen Demand is the amount of Oxygen which is dissolve in the water
and it is needed for aerobic biological organisms to break down organic material present, its
permissible limit is 1-5 ppm
COD: The chemical oxygen demand is and indicative measure of the amount of oxygen that
can be consumed by reactions in a measured solution. Its range is 1-35 mg/l
pH: pH in water is mainly calculated to identify the nature of the water (acidic, alkaline,
neutral). Acidic pH indicates high pollution level and it is unfit for daily use and for aquatic
life. Its range is6.5-8.5
Alkalinity: Alkalinity is determined by titrating the sample with standard solution of strong
mineral acid with bicarbonate and carbonic acid equivalent point. Its range for lake water is
ISSN: 2005-4238 IJAST 2044
Copyright ⓒ 2020 SERSCInternational Journal of Advanced Science and Technology
Vol. 29, No. 8s, (2020), pp. 2043-2050
less than 200 mg/l
Turbidity: It is define as the reason which is responsible for unclear nature of water. It is
mainly cause by unsalable organic and inorganic compound; its range is less than 500 mg/l
Hardness: It is mainly cause by inorganic material present inside the water. It is very
difficult to remove from water;its ideal range is Below 16 mg/L
Nitrates: Higher nitrate content is really harmful for lake water; it results in eutrophication
which reduces dissolve oxygen percentage of water. It is very difficult to remove and depends
on many factors like temperature, source of impurities etc. Its limit for lake water is less than
45 mg/l
Ammonia: Ammonia is a formed by combination of nitrogen and 3 hydrogen molecules and
its chemical formula is NH3. The ammonia is a colourless product with bad smell. The high
pH and the increase in the water results in the ammonia. Its limit is less than 0.5 mg/l
Chlorides: Chlorides are widely distributed as salts of calcium, sodium and potassium in
water and wastewater,high chloride content are sigh of low bacterial life, it is depend on
many factors like temperature, TDS etc. Its permissible limit is 3-5 mg/l
Sulphate: It is mainly introduce in water due to impurities added in lake water, its range is
less than 200 mg/l
Sodium: The sodium ion is ubiquitous in water;its range is less than 20 mg/l
Potassium andPhosphorus: It is also responsible for uncontrollable growth of algae and
eutrophication, it is possible to treat but treatment procedure is very costly, It range is
200mg/l and 1 mg/l
Study area
To check the quality of the projected lakes followings lakes are selected
Jewel of Navi Mumbai: Jewels of Navi Mumbai is the beautiful lake which is situated at
Sector 26, Nerul, Navi Mumbai. This lake is mainly polluted because of residential area,
falling of leaves, industrial wastewater.This lake has an outlet at various places when the
level of the lake rises above its level. This lake is surrounded by jogging track and a beautiful
garden where various cultural events takes.
Belapur Lake: Belapur Lake is located at Belapur, Navi Mumbai. Figure represents the
onsite view of the lake.This lake is surrounded by the residential areas. The outskirt of lake is
constructed with a beautiful walk way and garden provided with a seating arrangement for
the old age citizens. The total area of the Belapur Lake is 8000m2 and the average level of the
water is 2.5m. The main sources of pollution of this lake are washing of clothes, falling of the
leaves, Visarjan of the idol of gods. The water in this lake is stagnant and the major loss is
due to evaporation.
Kukshet Lake:Kukshettalav is situated at Nerul nearby Agri KoliSanskruti Bhavan. This
lake is surrounded by the residential areas.This is another example of artificial lake. This lake
purpose was created by NMMC for activities like ganpativisarjan, public jogging track and
for open gym purpose.The outskirt of lake is constructed with a beautiful walk way and
garden provided with a seating arrangement for the old age citizens. The approx. area of lake
is 4000 sq.m and average level of water is 1.5m. The main sources of pollution of this lake
are washing of clothes, falling of the leaves, Visarjan of the idol of gods, garbage etc. The
water in this lake is stagnant and the major loss is due to evaporation.
ISSN: 2005-4238 IJAST 2045
Copyright ⓒ 2020 SERSCInternational Journal of Advanced Science and Technology
Vol. 29, No. 8s, (2020), pp. 2043-2050
Results & discussion
Sample 1- Jewel of Navi Mumbai (Lake 1)
Sample 2- Kukshet Lake (Lake 2)
Sample 3- Belapur Lake (Lake 3)
40 Temperature(C0) Hardness (mg/l)
35
Temperature
30 350
25 300
HARDNESS
20 250
15 200
10 150
5 100
0 50
TEST 1 TEST 2 TEST 3 0
TEST 1 TEST 2 TEST 3
LAKE 1 32.2 28 25
LAKE 1 328.29 288.06 250.23
LAKE 2 31.1 26.4 25.6
LAKE 2 81.07 82.03 81.76
LAKE 3 32 35.8 25
LAKE 3 84.07 81.26 81.9
Alkalinity (mg/l) Chloride(mg/l)
200 4000
180 3500
160 3000
140
Alkalinity
Chloride
120 2500
100 2000
80 1500
60
40 1000
20 500
0 0
TEST TEST TEST TEST 1 TEST 2 TEST 3
1 2 3
LAKE 1 3412.1 3102.1 2581.2
LAKE 1 156.6 156.6 175.2
LAKE 2 26.8 24.5 24.48
LAKE 2 104.4 104.2 108.29
LAKE 3 22.8 29.02 28.82
LAKE 3 135.72 122.4 123.2
Sulphate (mg/l)
pH
60
10 50
Sulphate
8 40
6
pH
4 30
2 20
0 10
TEST TEST TEST
0
1 2 3 TEST 1 TEST 2 TEST 3
LAKE 1 7.88 7.91 7.81 LAKE 1 12.6 13.2 13.2
LAKE 2 7.5 6.32 7.32 LAKE 2 40.1 35.6 35.1
LAKE 3 7.72 7.26 7.12 LAKE 3 46.1 41.3 50.2
ISSN: 2005-4238 IJAST 2046
Copyright ⓒ 2020 SERSCInternational Journal of Advanced Science and Technology
Vol. 29, No. 8s, (2020), pp. 2043-2050
Potassium (mg/l)
Sodium (mg/l)
70
60
Potassium
50 2000
40 1500
Sodium
30 1000
20
10 500
0 0
TEST TEST TEST TEST TEST TEST
1 2 3 1 2 3
LAKE 1 58.23 60.4 64.23 LAKE 1 1345.3 1352.4 1549.3
LAKE 2 1.6 1.84 1.93 LAKE 2 10.65 10.7 10.8
LAKE 3 1.92 2.05 2.13 LAKE 3 13.45 15.38 17.68
Phosphorus (mg/l)
Ammonia (mg/l)
20
4
Phosphorus
15
Ammonia
3
10
2
5 1
0 0
TEST 1 TEST 2 TEST 3 TEST 1 TEST 2 TEST 3
LAKE 1 11.2 13.9 18.5 LAKE 1 2.4 2.1 3.7
LAKE 2 0.82 0.6 0.93 LAKE 2 0.5 0.5 0.5
LAKE 3 0.2 0.68 0.41 LAKE 3 0.5 0.5 0.5
Nitrate (mg/l)
40
35
30
25
Nitrate
20
15
10
5
0
TEST 1 TEST 2 TEST 3
LAKE 1 29 34 29
LAKE 2 3 3 4
LAKE 3 3 0.5 1
ISSN: 2005-4238 IJAST 2047
Copyright ⓒ 2020 SERSCInternational Journal of Advanced Science and Technology
Vol. 29, No. 8s, (2020), pp. 2043-2050
Tss (mg/l)
600
500
400
TSS
300
200
100
0
TEST 1 TEST 2 TEST 3
LAKE 1 253 451 538
LAKE 2 23 43 42
LAKE 3 108 102.5 140
Turbidity (NTU)
100
80
Turbidity
60
40
20
0
TEST 1 TEST 2 TEST 3
LAKE 1 88.32 85.31 87.52
LAKE 2 58.5 71.9 72.3
LAKE 3 4.36 10.51 11.9
BOD (mg/l)
100
80
60
BOD
40
20
0
TEST 1 TEST 2 TEST 3
LAKE 1 74 71 94
LAKE 2 35 31.2 39.2
LAKE 3 24 28 28.92
ISSN: 2005-4238 IJAST 2048
Copyright ⓒ 2020 SERSCInternational Journal of Advanced Science and Technology
Vol. 29, No. 8s, (2020), pp. 2043-2050
COD(mg/l)
350
300
250
200
COD
150
100
50
0
TEST 1 TEST 2 TEST 3
LAKE 1 194.3 295.39 295.14
LAKE 2 120.44 116.25 140.8
LAKE 3 93.104 88.04 88.32
The above graphs show the representation of the tests that we have conducted. The graph
plotted is in the form of bar chart. Test 1, test 2 and test 3 were conducted on 07/10/2019,
11/12/2019 and 02/01/2020 respectively.
4. CONCLUSION
In Navi Mumbai the environmental pressure of unplanned urbanization and growing
population has taken its toll on lakes. From the studymentioned above, it could be concluded
thatjewel of Navi Mumbai (Lake 1) has high content of TDS, Ammonia, Chlorides, Sulphate
and Sodium which makes the lake water unfit for daily use and survival of aquatic life. To
regain the quality of lake water methods like, cation exchange resin in hydrogen form can be
used to remove chlorine and ammonia from the water. Reverse osmosis or distillation can be
used to remove sulphate and sodium and TDS from the water. In kukshet lake (Lake 2) there
is less impurities as compared to the first lake but still it contains major parameters like
hardness, COD and potassium content which makes the lake water unfit for daily use. The
methods such as reverse osmosis can be used to remove the potassium content in the water.
The third lake i.e. Belapur lake contains least amount of impurities as compared to other two
lakes and it is fit for other use except drinking since it has the sulphate content. The sulphate
can be removed by using reverse osmosis .Proper management for restoration and
conservation these lake carries out by the method such as deepening of shallow areas, regular
water analysis, banning of solid waste disposal and tree plantation in catchment area is
necessary for sustenance of these urban lakes.
REFERENCES
[1] Priti and K.K. Sahu (11-12, January 2018) Physio chemical analysis of lotic and lentic
water ecosystem in Samastipur, Bihar published in international research journal of
environmental sciences volume 7(1).
[2] Sanyogita R Verma, P.R.Chaudhari, R.K. Singh and S.R.Wate. Volume 4, No 3(2011)
Studies on ecology and trophic status of an urban lake at Nagpur city published in
international journal of Chemical, Environmental and Pharmaceutical Research.
[3] Druga Madhab Mahapatra, Supriya Guruprasad, Chanakya H N, Ramchandra T algal
photosynthetic dynamic in urban lakes under stress conditions Publish in Indian institute
of science Bangalore.
[4] Mallika Saraf, Dr. Sindhu J. Nair Volume 2, issue 6, (June 2015) restorstion and
conservation of urban lakes Publish in- international journal of advance engineering and
research Development.
[5] 5)Gangotri Nirbhavane, Kshama Khobragade (2017) Study of water Quality of Sion,
Lake, Mumbai, Maharashtra Publish on: - Scholars Journal of Engineering and
Technology (SJET); 5(8):413-415)
[6] Nirbhay S.Pimple and Pranjali S. Amrujkar (2015),” Physico-chemical analysis of
surface water sample from pashan lake, pune” volume 4, issue7.
ISSN: 2005-4238 IJAST 2049
Copyright ⓒ 2020 SERSCInternational Journal of Advanced Science and Technology
Vol. 29, No. 8s, (2020), pp. 2043-2050
[7] ParulBaranwal, Mansi Tripathi, S.K. Singal,” Water quality analysis of lake”.
[8] Raju D. Jadhav, Harishchandra B. mali,” source of high content of sodium chloride
(NaCl) at Crater Lake Lonar, Maharashtra” volume4 issue 5.
[9] Bhaumik, A., Law, K. A., & Fang, J. (2019). Influence of globalization and its impact on
performance: Research on network ability. International Journal of Control and
Automation, 12(5), 10-18.
[10] Dr. Vyankatesh balajirao yannawar,”cultural eutrophication of lonar lake
Maharashtra”volume3.
[11] IS code 10500-2012 (Indian standard drinking water specification)
ISSN: 2005-4238 IJAST 2050
Copyright ⓒ 2020 SERSCYou can also read