River Murray Weekly Report - Murray-Darling Basin Authority
←
→
Page content transcription
If your browser does not render page correctly, please read the page content below
River Murray Weekly Report
For the week ending Wednesday, 4 August 2021
Trim Ref: D21/31230

July 2021 summary
The Bureau of Meteorology (BoM) reports that the mean temperature in July for the whole of Australia was 1.77 °C
warmer than average. Across the Murray-Darling Basin, maximum and minimum temperatures were average to
above average (Map 1 & 2).

Map 1 & 2 – Maximum and minimum temperature deciles for July 2021 (Source: Bureau of Meteorology)

For the month of July, the Basin experienced average to above average rainfall (Map 3). River Murray System inflows
(excluding environmental, IVT and Snowy scheme contributions) totalled almost 1,571 GL (28% AEP).

Map 3 – Murray-Darling Basin rainfall deciles for July 2021 (Source: Bureau of Meteorology)

     Subscribe to the River Murray Weekly Report                     River Data website             Water in Storages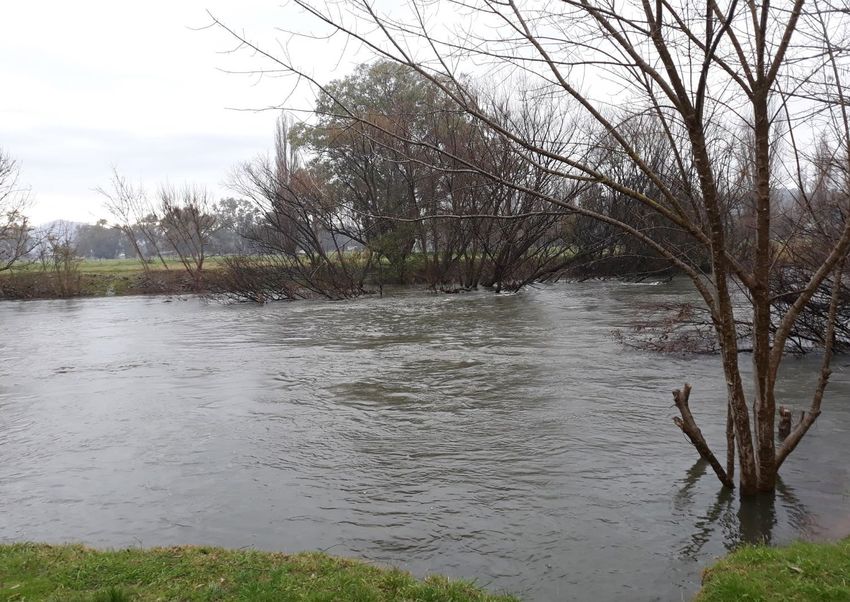
River Murray Weekly Report

Rainfall and inflows
Rainfall occurred across much of the Murray Darling Basin this week with the highest totals recorded across the
upper Murray, Murrumbidgee, Lachlan, Border Rivers and Gwydir catchments (Map 1).
In north east Victoria, 38 mm was recorded at Falls Creek. In the upper Ovens catchment Harrietville recorded 47
mm and Lake Buffalo recorded 29 mm. In New South Wales, the highest totals included 92 mm at Tumut on the
upper Murrumbidgee River and 20 mm at Jingellic upstream of Hume dam.

Map 1 – Murray-Darling Basin rainfall for the week ending 4th August 2021. Source: Bureau of Meteorology.

Specific information about flows at key locations can be found at the MDBA’s River Murray data webpage. Over the
next 8 days, the BoM is forecasting minimal rain over the upper Murray catchments. Please remain aware of
changing river levels and any warnings issued by the BoM.

     Subscribe to the River Murray Weekly Report                    River Data website                      Water in Storages
River Murray Weekly Report

River operations
     •    MDBA continues to monitor Hume dam and any potential requirement for airspace releases
     •    Tributary inflows deliver water to the Barmah-Millewa forest
     •    Elevated inflows to the Murray from the Goulburn and Murrumbidgee Rivers continue

Managing the filling of Hume Dam - maximising water availability and maintaining airspace
to help mitigate any downstream flooding
Rainfall and wet catchments have delivered increased inflows to Hume Dam over recent weeks, increasing the
storage volume to 84% capacity. This combined with Bureau of Meteorology outlook for further rain suggests a high
likelihood of Hume filling and increased risk of flooding downstream of Hume this winter-spring.
Daily, the MDBA is reviewing Bureau of Meteorology forecasts and outlooks, updating forecast inflows and
predicting if and when the dam will fill. When filling of Hume Dam is assured, the MDBA will commence pre-
releases to manage the filling process and to maintain some storage airspace to help mitigate any floods that may
occur in the coming months.
Further details about flood management at Hume Dam are available on the MDBA website.

River Levels
River users can monitor River Murray levels and flow forecasts at key locations on the MDBA’s River Murray data
webpage to assist in planning any river activities. Up-to-date river data for sites can also be found on BoM’s
website, at the WaterNSW real-time data website, Victoria’s DELWP water monitoring website, South Australia’s
WaterConnect website and Queensland’s Water Monitoring Information Portal.
River operations
Total active storage increased by 363 GL over the last week to 6,041 GL (76% capacity).
At Dartmouth Reservoir, the storage increased by 63 GL to 2,724 GL (71% capacity). A minimum release rate of 200
ML/day has been targeted over the last week, measured at Colemans gauge.
Over the past week the Hume Reservoir storage increased by 216 GL to 2,540 GL (85% capacity). The release has
remained at the minimum rate of 600 ML/day. Releases at low levels (well within the river channel) are likely over
this coming week to manage the filling of Hume and to maintain some storage airspace to help mitigate any floods
that might occur in the coming months.
The Lake Mulwala level is currently 124.76 m AHD, within the normal operating range (124.6 to 124.9 m AHD). The
diversion at Mulwala Canal averaged around 1,200 ML/day as Murray Irrigation Limited (MIL) accessed
supplementary licence water to refill their irrigation network. Goulburn-Murray Water (GMW) continued to divert
approximately 50 ML/day at Yarrawonga Main Channel (YMC) while West Corugan has commence diversions and
has taken near 300 ML for the week. This week saw the release downstream of Yarrawonga peak near 30,000
ML/day as tributary inflows passed through the weir. Tributary inflows are forecast to recede over the coming week
as conditions dry.
Whilst the flow on the Murray is unregulated with higher levels downstream of Yarrawonga Weir, forest regulators
are open. This delivers water to the Barmah and Millewa forests and manages the river level below the capacity of
the Barmah Choke.
At the Kolety (pronounced Kol-etch)/Edward River offtake the flow is being managed at around 2,100 ML/day. At
Gulpa Creek offtake the gates are clear of the water and the flow (currently 950 ML/day) is not being regulated.
Further downstream on the Kolety/Edward River the flow at Toonalook (currently 5,700 ML/day) is being boosted
by water returning from the River Murray via the Millewa forest. At Stevens Weir, the pool level has returned to the
normal operating level to provide access to supplementary water in the Wakool Canal and in the Wakool River,
Yallakool Creek and Colligen Creek. Flow downstream of Stevens Weir increased to around 3,800 ML/day whilst the
higher flows from upstream continue through the system.

    Subscribe to the River Murray Weekly Report              River Data website                  Water in Storages
River Murray Weekly Report
On the Goulburn River, the flow measured at McCoys Bridge is currently around 5,500 ML/day as GMW deliver a
winter pulse on behalf of environmental water holders. Recent rainfall in the catchment has also delivered
improved tributary inflows that will extend the duration of the current higher flow into next week. For more
information see the Goulburn-Murray Water website. Information regarding opportunities for allocation trade
between the Goulburn and Murray Valleys is available at the Victorian water register website.
Diversions to National Channel have averaged 400 ML/day. Diversions are being used to maintain base flows in the
Pyramid Creek system and at Kerang Weir on behalf of environmental water holders. The release from Torrumbarry
Weir has increased to 18,000 ML/day and is forecast to recede in the coming week.
The Torrumbarry Weir pool is at 22 cm below the full supply level (FSL) and will continue to be varied between 30
cm below FSL and FSL over the coming week as part of the weir pool variability program. Varying pool levels helps
restore a more natural wetting and drying cycle to riverbanks and adjacent wetlands within the influence of the
weir pool. In the weeks ahead, as the irrigation season re-commences the pool level will return to FSL.
As conditions change with river levels or weir pools, river users and landholders should remain aware of the
changing water level in case adjustments need to be made to pumps, moorings and recreational activities.
In the upper Murrumbidgee, WaterNSW has advised that both Blowering and Burrinjuck Dams are effectively full.
Releases from both storages are being managed in response to higher inflows to maintain airspace for flood
mitigation purposes. More information is available at WaterInsights. WaterNSW has announced access to
supplementary water for the Murrumbidgee River and for the Murray River reaches.
Inflow from the Murrumbidgee River measured at Balranald continued around 6,800 ML/day this week. Over the
coming week, flows are expected to slightly increase. The Murrumbidgee IVT balance is open for trade from the
Murray to the Murrumbidgee but remains closed to trade from the Murrumbidgee to the Murray.
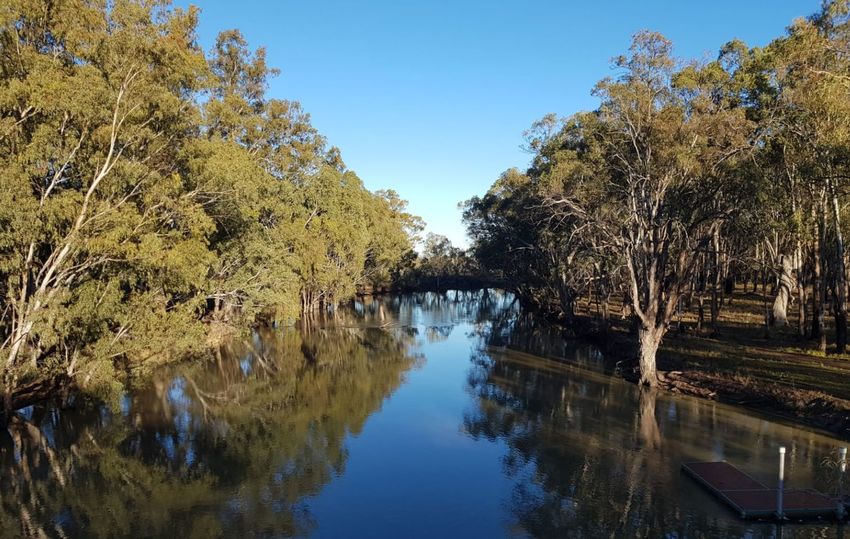
Photo 1 – A swollen river at Tumut (Murrumbidgee catchment). (Source: K Sandles)
Subscribe to the River Murray Weekly Report River Data website Water in StoragesRiver Murray Weekly Report
Photo 2 – Higher flows on Murrumbidgee River at Balranald. (Source: T Zouch)
At Euston Weir, the weir pool level has returned to FSL due to higher flows from upstream. The downstream
release has averaged 19,000 ML/day and is forecast to increase above 25,000 ML/day over the coming week.
At Mildura Weir, the weir pool has returned to FSL. Essential maintenance works will be re-scheduled for
winter 2022 or earlier if high river flows require the weir to be removed. More information is available from the
MDBA website.
At Menindee Lakes, total volume in storage increased this week to 1,187 GL (69% capacity).
Inflows to Menindee Lakes continue to increase with the flow upstream at Wilcannia currently around
10,500 ML/day. Recent rainfall across several NSW tributaries of the Darling River has resulted in additional flow
into the system that will further boost inflows to the Menindee Lakes over the coming weeks.
Environmental water holders are using entitlements to maintain higher releases from Menindee Lakes with a target
flow at Weir 32 of 500 ML/day. This compares with the normal winter minimum release of 200 ML/day. This higher
flow rate is being maintained to benefit native fish in the Barka/lower Darling River during July and into August.
Over the coming months, the MDBA will continue to revise forecasts and operational plans to determine the
volume and timing of water released from Menindee Lakes to support the Murray system. This process will be on-
going and will take account of the operating rules of the Murray-Darling Basin Agreement, the ‘Objectives and
Outcomes for River Operations in the River Murray System’ as well as the more specific opportunities and risks
driven by system conditions, water security, delivery efficiency, and environmental and community considerations.
Further updates will be provided in the Annual Operating Outlook (published by the MDBA in August) and future
weekly reports as updated plans and release decisions are made. More information on the management of
Menindee lakes is also available in a webinar hosted by the MDBA.
At Wentworth Weir, the weir pool level continues to be managed around FSL. The downstream flow increased to
near 20,000 ML/day. Just upstream of Wentworth Weir at Curlwaa, the Abbotsford Bridge was closed in mid-July
for 6 weeks. This is to allow essential maintenance work to replace the existing timber deck of the lift span. More
information can be found here.
Subscribe to the River Murray Weekly Report River Data website Water in StoragesRiver Murray Weekly Report
At Lock 9 the weir pool has been raised to a level around 20 cm above FSL to help maximise diversions into Lake
Victoria as higher flows arrive from upstream. The Lock 8 weir pool is currently near FSL and will be raised to around
80 cm above FSL during August to November to inundate the Mulcra floodplain and other wetlands adjacent to the
weirpool. Lock 7 is targeting around 55 cm above FSL to increase flow into the Lindsay River to facilitate pumping
for water for the environment into Lake Wallawalla.
The storage at Tar-ru/ Lake Victoria increased by 45 GL to 567 GL (84% capacity). Inflows to Tar-ru/Lake Victoria
have reduced to slow the rate of fill of Lake Victoria.
The flow to South Australia is currently around 12,000 ML/day and forecast to increase over the coming week to
around 17,000 ML/day. The required flow to South Australia continues to be exceeded, with unregulated flow
available on the River Murray downstream of Hume Reservoir and on the Edward System. Any extensions to the
announcement of unregulated flow will be subject to on-going rain and elevated inflows. General information on
River Murray unregulated flows can be accessed on the MDBA webpage. Information on access to Murray
supplementary water licences in NSW is available from WaterNSW Water insights.
The Lower Lakes 5-day average water level is 0.8 m AHD. Barrage releases will continue to be made, when
conditions allow, to push fresh water into the Coorong to support a productive environment for fish and birds. For
information on barrage releases and South Australia’s Entitlement flow, see the South Australian Department for
Environment and Water Weekly River Murray Flow Report.
For media inquiries contact the Media Officer on 02 6279 0141
ANDREW REYNOLDS
Executive Director, River Management
Subscribe to the River Murray Weekly Report River Data website Water in StoragesRiver Murray Weekly Report
Water in Storage Week ending Wednesday 04 Aug 2021
Full Full Current Change in Total
Dead Active
MDBA Storages Supply Supply Storage Current Storage Storage for the
Storage Storage
Level Volume Level Week
(m AHD) (GL) (m AHD) (GL) % (GL) (GL) (GL)
Dartmouth Reservoir 486.00 3 856 466.88 2 724 71% 71 2 653 +63
Hume Reservoir 192.00 3 005 189.70 2 563 85% 23 2 540 +216
Lake Victoria 27.00 677 26.08 567 84% 100 467 +45
Menindee Lakes 1 731* 1 187 69% (480 #) 707 +39
Total 9 269 7 041 76% -- 6 367 +363
Total Active MDBA Storage 74% ^
Major State Storages
Burrinjuck Reservoir 1 026 970 95% 3 967 -80
Blowering Reservoir 1 631 1 630 100% 24 1 606 +0
Eildon Reservoir 3 334 2 284 69% 100 2 184 +105
* Menindee surcharge capacity – 2050 GL ** All Data is rounded to nearest GL **
# NSW has sole access to water when the storage falls below 480 GL. MDBA regains access to water when the storage next reaches 640 GL.
^ % of total active MDBA storage
Snowy Mountains Scheme Snowy diversions for week ending 03 Aug 2021
Storage Active Storage (GL) Weekly Change (GL) Diversion (GL) This Week From 1 May 2021
Lake Eucumbene - Total 790 +72 Snowy-Murray +3 328
Snowy-Murray Component 398 +16 Tooma-Tumut +13 83
Target Storage 1 190 Net Diversion -10 245
Murray 1 Release +7 412
Major Diversions from Murray and Lower Darling (GL) *
New South Wales This Week From 1 July 2021 Victoria This Week From 1 July 2021
Murray Irrig. Ltd (Net) 14.9 32 Yarrawonga Main Channel (net) 0.4 2
Wakool Sys Allowance -0.2 1 Torrumbarry System + Nyah (net) 0 0
Western Murray Irrigation 0.0 0 Sunraysia Pumped Districts 0.3 1
Licensed Pumps 2.0 6 Licensed pumps - GMW (Nyah+u/s) 0 0
Lower Darling 0.0 0 Licensed pumps - LMW 0.7 3
TOTAL 16.7 39 TOTAL 1.4 6
* Figures are derived from actual and estimates where data is unavailable. Please note that not all data may have been available at the time of creating
this report. ** All data above is rounded to nearest 100 ML for weekly data and nearest GL for cumulative data
Flow to South Australia (GL) Entitlement this month 124.0 *
* Flow to SA will be greater than normal entitlement for Flow this week 65.7 (9 400 ML/day)
this month due to environmental flows.
Flow so far this month 42.3
Flow last month 182.0
Salinity (EC) (microSiemens/cm at 25o C)
Current Average over the last week Average since 1 August 2021
Swan Hill 100 90 90
Euston - - -
Red Cliffs 100 120 110
Merbein 110 90 70
Burtundy (Darling) 300 300 300
Lock 9 140 130 140
Lake Victoria 140 130 130
Berri 150 170 160
Waikerie 240 260 250
Morgan 280 280 280
Mannum 320 330 340
Murray Bridge 410 340 360
Milang (Lake Alex.) 730 730 730
Poltalloch (Lake Alex.) 550 570 550
Meningie (Lake Alb.) 1 520 1 460 1 450
Goolwa Barrages 3 920 5 010 4 330
Subscribe to the River Murray Weekly Report River Data website Water in StoragesRiver Levels and Flows Week ending Wednesday 04 Aug 2021
Minor Flood Average Flow this Average Flow last
Gauge Height Flow Trend
Stage Week Week
local (m
River Murray (m) (m) AHD) (ML/day) (ML/day) (ML/day)
Khancoban - - - 4 430 R 4 160 4 990
Jingellic 4.0 2.99 209.51 17 010 F 20 140 22 680
Tallandoon ( Mitta Mitta River ) 4.2 2.13 219.02 2 830 S 3 360 3 490
Heywoods 5.5 1.41 155.04 600 S 600 600
Doctors Point 5.5 2.16 150.63 5 120 S 5 690 5 920
Albury 4.3 1.22 148.66 - - - -
Corowa 4.6 1.59 127.61 6 060 F 6 810 6 860
Yarrawonga Weir (d/s) 6.4 3.40 118.44 26 550 F 27 910 24 830
Tocumwal 6.4 4.21 108.05 28 070 R 26 220 22 670
Torrumbarry Weir (d/s) 7.3 4.98 83.53 18 100 F 17 220 13 120
Swan Hill 4.5 2.78 65.70 16 450 R 15 200 9 350
Wakool Junction 8.8 5.07 54.19 18 890 R 17 050 11 440
Euston Weir (d/s) 9.1 3.49 45.33 22 140 R 19 910 16 210
Mildura Weir (d/s) - - 21 260 F 17 900 13 060
Wentworth Weir (d/s) 7.3 3.90 28.66 20 160 R 17 970 14 590
Rufus Junction - 4.27 21.20 11 790 R 8 880 6 200
Blanchetown (Lock 1 d/s) - 0.96 - 8 390 R 6 400 6 290
Tributaries
Kiewa at Bandiana 2.8 2.93 156.16 5 680 R 5 890 6 420
Ovens at Wangaratta 11.9 11.63 149.31 16 000 F 22 860 18 170
Goulburn at McCoys Bridge 9.0 3.78 95.20 5 530 F 7 820 8 580
Edward at Stevens Weir (d/s) 5.5 3.08 82.85 4 040 F 3 290 1 930
Edward at Liewah - 2.81 58.19 2 260 S 2 360 2 540
Wakool at Stoney Crossing - 1.40 54.89 450 R 360 150
Murrumbidgee at Balranald 5.0 5.09 61.05 7 010 S 6 910 6 690
Barwon at Mungindi 6.1 6.42 - 9 330 F 10 160 9 480
Darling at Bourke 9.0 6.36 - 16 100 R 14 570 11 000
Darling at Burtundy Rocks - 0.86 - 450 S 450 460
Natural Inflow to Hume 40 310 41 110
(i.e. Pre Dartmouth & Snowy Mountains scheme)
Weirs and Locks Pool levels above or below Full Supply Level (FSL)
Murray FSL (m AHD) u/s d/s FSL (m AHD) u/s d/s
Yarrawonga 124.90 -0.20 - No. 7 Rufus River 22.10 +0.60 +1.98
No. 26 Torrumbarry 86.05 -0.22 - No. 6 Murtho 19.25 +0.11 +0.50
No. 15 Euston 47.60 -0.04 - No. 5 Renmark 16.30 +0.19 +0.57
No. 11 Mildura 34.40 -0.04 +0.98 No. 4 Bookpurnong 13.20 +0.27 +1.14
No. 10 Wentworth 30.80 -0.02 +1.26 No. 3 Overland Corner 9.80 +0.10 +0.72
No. 9 Kulnine 27.40 +0.17 +0.36 No. 2 Waikerie 6.10 +0.39 +0.38
No. 8 Wangumma 24.60 +0.03 +0.98 No. 1 Blanchetown 3.20 +0.03 +0.21
Lower Lakes FSL = 0.75 m AHD
Lake Alexandrina average level for the past 5 days (m AHD) 0.80
Barrages Fishways at Barrages
Openings Level (m AHD) No. Open Rock Ramp Vertical Slot 1 Vertical Slot 2 Dual Vertical Slots
Goolwa 128 openings 0.04 All closed - Open Open -
Mundoo 26 openings 0.75 All closed - - - Open
Hunters Creek - - - - Open - -
Boundary Creek 6 openings - 1 - Open - -
Ewe Island 111 gates - All closed - - - Open
Tauwitchere 322 gates 0.77 All closed Open Open Open -
AHD = Level relative to Australian Height Datum, i.e. height above sea level
Subscribe to the River Murray Weekly Report River Data website Water in StoragesWeek ending Wednesday 04 Aug 2021
State Allocations (as at 04 Aug 2021)
NSW - Murray Valley Victorian - Murray Valley
High security 97% High reliability 46%
General security 26% Low reliability 0%
NSW – Murrumbidgee Valley Victorian - Goulburn Valley
High security 95% High reliability 59%
General security 50% Low reliability 0%
NSW - Lower Darling South Australia – Murray Valley
High security 100% High security 100%
General security 100%
NSW : https://www.industry.nsw.gov.au/water/allocations-availability/allocations/summary
VIC : http://nvrm.net.au/seasonal-determinations/current
SA : https://www.environment.sa.gov.au/topics/river-murray/water-allocations-and-announcements
Subscribe to the River Murray Weekly Report River Data website Water in StoragesYou can also read