Mangawhai SEA habitat assessment - Date: January 2020 - Northland Regional ...
←
→
Page content transcription
If your browser does not render page correctly, please read the page content below
Mangawhai SEA habitat assessment
Date: January 2020
Authors/Contributors:

Richard Griffiths
Andrew McDonald
Nick Bamford
Melodie Pene
Neels van Tonder
Neihana Umuroa
Stacey Wiseman
Penny Hales
Ricky Eyre

For any information regarding this report please contact:

Richard Griffiths
richardg@nrc.govt.nz

Northland Regional Council
Private Bag 9021
Whangārei Mail Centre
Whangārei 0148

Phone: 09 470 1200
Freephone: 0800 002 004
Fax: 09 470 1202
Email: info@nrc.govt.nz

Mangawhai SEA habitat assessment 1
Contents
Introduction ............................................................................................................................................ 1
Methods .................................................................................................................................................. 1
 Study area ....................................................................................................................................... 1
 Sampling sites ................................................................................................................................. 2
 Sampling methods - substrate ........................................................................................................ 4
 Sampling methods - epifauna ......................................................................................................... 4
 Sampling methods – incidental observations ................................................................................. 4
 Sampling methods - shellfish .......................................................................................................... 4
 Data analysis – shellfish .................................................................................................................. 5
 Results – substrate .............................................................................................................................. 7
 Results - epifauna................................................................................................................................ 9
 Results – incidental observations ....................................................................................................... 9
 Results - cockles ................................................................................................................................ 10
 Northern SEA................................................................................................................................. 10
 Mid SEA ......................................................................................................................................... 12
 Southern SEA................................................................................................................................. 14
 Results – wedge shell ........................................................................................................................ 16
 Northern SEA................................................................................................................................. 16
 Mid SEA ......................................................................................................................................... 16
 Southern SEA................................................................................................................................. 16
 Results – pipi ..................................................................................................................................... 20
 Northern SEA................................................................................................................................. 20
 Mid SEA ......................................................................................................................................... 20
 Southern SEA................................................................................................................................. 20
Summary ............................................................................................................................................... 21
 Substrate ....................................................................................................................................... 21
 Epifauna ........................................................................................................................................ 21
 Birds .............................................................................................................................................. 21
 Cockles .......................................................................................................................................... 21
 Wedge shell................................................................................................................................... 21
 Pipi ................................................................................................................................................ 21
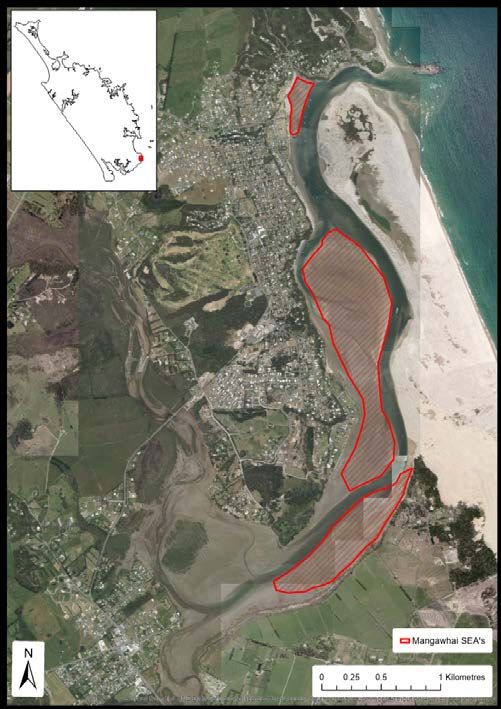
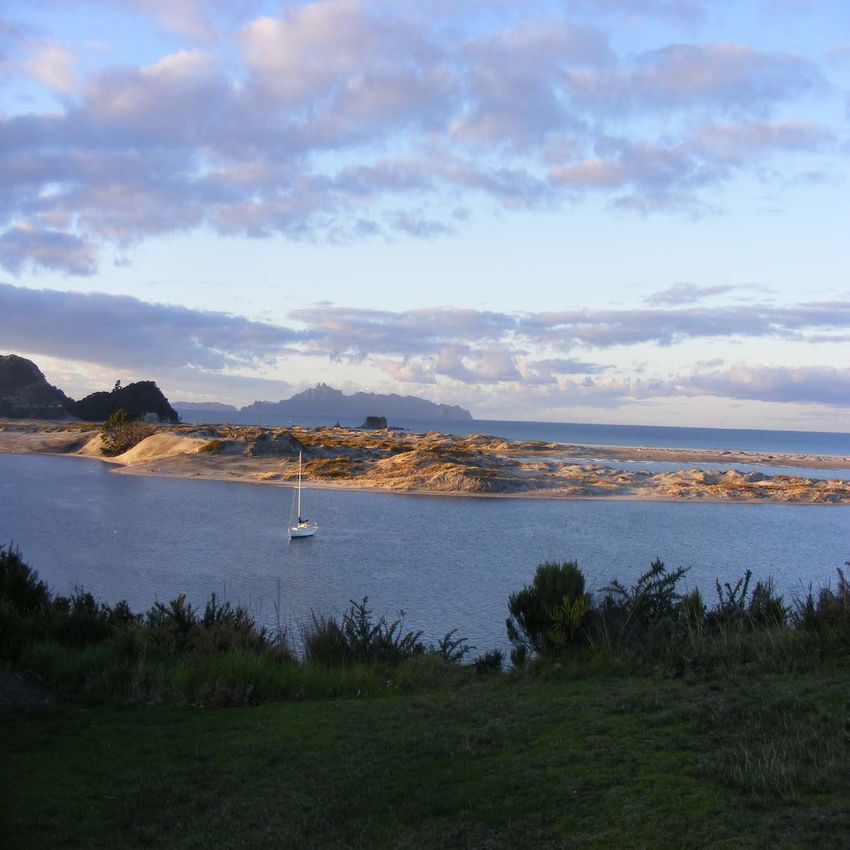
Introduction
In the Proposed Regional Plan for Northland (Northland Regional Council 2016), three marine
significant ecological areas (SEAs) have been identified in the Mangawhai Estuary. In September
2019, Northland Regional Council (NRC) conducted a habitat assessment of these SEAs. This report
documents the key findings of that survey.

Methods
Study area
Mangawhai estuary is located on the east coast of the Northland peninsula (Figure 1).

 Figure 1. Mangawhai Estuary.

Mangawhai SEA habitat assessment 1
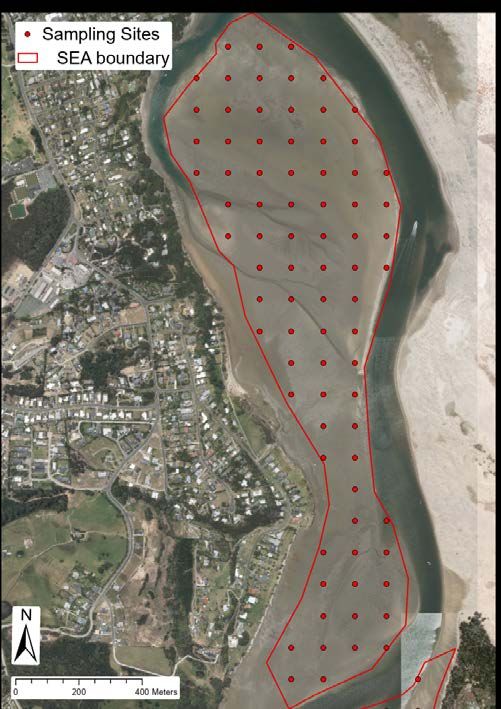
Sampling sites
For the northern SEA, transects were located 50m apart with stations located 50m along each
transect (Figure 2). In the mid and southern SEAs, transects were located 100m apart with stations
located 100m along each transect (Figure 3 & 4).

 Figure 2. Sample locations in the northern SEA.

Mangawhai SEA habitat assessment 2
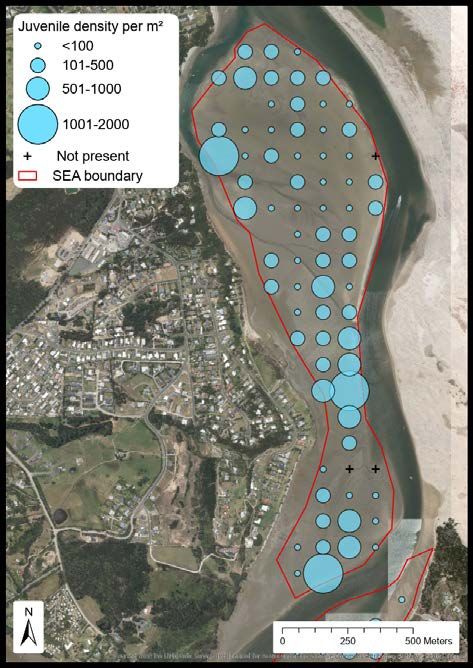
Figure 3. Sample locations in the mid SEA.

 Figure 4. Sample locations in the southern SEA.

Mangawhai SEA habitat assessment 3
Sampling methods - substrate
At each sampling station the substrate was classified into one of nine categories (Table 1). These
categories were developed by Griffiths et al. (2019) from the sediment categories in the Estuary
Monitoring Protocol (Robertson et al., 2002) and an intertidal habitat survey of Waikato estuaries
conducted by Needham et al. (2013).

Table 1. Substrate categories.

 Substrate Description
 categories
 Very soft mud The surface appears brown with a black anaerobic layer below. When walking on the
 substrate you’ll sink greater than 5cm.
 Soft mud The surface appears brown with a black anaerobic layer below. When walking on the
 substrate you’ll sink 2-5cm.
 Firm mud/sand A mixture of mud and sand, the surface appears brown with a black anaerobic layer
 below. When walking on the substrate you’ll sink 0-2cm.
 Firm sand Firm sand flats may be mud-like in appearance but are granular when rubbed between
 the fingers, and solid enough to support an adult’s weight without sinking more than
 1-2cm. Firm sand may have a thin layer of silt on the surface making identification from
 a distance impossible.
 Mobile sand The substrate is clearly recognised by the granular beach sand appearance and the
 often rippled surface layer. Mobile sand is continually being moved by strong tidal
 currents and often forms bars and beaches. When walking on the substrate you’ll sink
 less than 1cm.
 Soft sand Substrate containing greater than 99% sand. When walking on the substrate you’ll sink
 greater than 2cm.
 Very soft sand Substrate containing greater than 99% sand. When walking on the substrate you’ll sink
 greater than 5cm.
 Gravelfield Sediment characterised by unconsolidated gravel (2-20mm diameter). Visually
 observed to cover ~70-100% of sediment surface to the extent that very little (or none)
 of the underlying sediment is visible.
 Shell hash The substrate is dominated by shells.

Sampling methods - epifauna
At each sampling station, a 0.25m2 quadrat was placed on the ground and all animals (excluding
shellfish) were recorded. In addition, any crustacean burrows, algae, seagrass or mangroves within
the quadrat were recorded.

Sampling methods – incidental observations
Any unusual flora or fauna encountered between stations was recorded. In addition, bird
observations were recorded at each SEA.

Sampling methods - shellfish
Samples were collected by taking a sample unit consisting of two adjacent, circular cores (with a
150mm diameter) pushed into the substrate to a depth of 150mm. The contents from the two cores
were aggregated (so each sample unit covered a cross sectional area of 0.0353m2) and passed
through a 6mm aperture sieve. All cockles (Austrovenus stutchburyi), wedge shell (Macomona
Liliana) and pipi (Paphies australis) retained on the sieve were counted. A photograph was taken of
all the shellfish, and the images were analysed using Photoblique v2.0.16. This software allows the

Mangawhai SEA habitat assessment 4
user to set the spatial scale of the photographs using a reference measure, such as a ruler, and then
measure the shell length of each shellfish (Figure 5). In order to allow for batch processing of the
spatial scale of the photographs, each field officer had a specially adapted 20L bucket. The lid of
each bucket had a hole drilled through it and an indent to match their phone’s camera. This ensured
that each photograph was taken at the same height and centred in the middle of the bucket.

The shell length measurements made using Photoblique were exported as a csv and used to
calculate the proportion of juveniles and adults, and to estimate the biomass of cockles.

Figure 5. Shellfish measurements using Photoblique v2.0.16.

Data analysis – shellfish
The mean density (per square metre) and standard error was estimated for juvenile and adult
cockles and wedge shells in each SEA. Cockles 15mm or greater in shell length and wedge shell
30mm or greater were classified as adults (Griffiths et al. 2019). Very few pipis were recorded, so
juvenile and adult densities were not estimated separately. Instead the mean density (per square
metre) and standard error was calculated for all pipis.

For the purpose of this survey each SEA was treated as one stratum. The total population for each
stratum was estimated by calculating the average density (per square metre) and then multiplying this
by the area of the SEA using the formula:

 ( ) = � ̅
 −1

Where: Wi is the stratum area (m2), and xi is the average density (per square metre) in stratum i.

Mangawhai SEA habitat assessment 5
Length weight relationship

The weight of individual shellfish was estimated using the length of each shellfish and an established
length-weight relationship:

 =

The relationship between length-weight relationship derived by Williams et al. (2009) for cockles at
Snake Bank, Northland, where a = 0.00014 and b = 3.29, was used to estimate cockle biomass. W is
weight in g and L is length in mm.

There are currently no established length-weight relationships for wedge shell as it is not a
commercially important species, therefore biomass was not calculated for wedge shells. There are
established length-weight relationships for pipi, but as very few pipi were recorded in the survey,
biomass was not estimated.

Mangawhai SEA habitat assessment 6
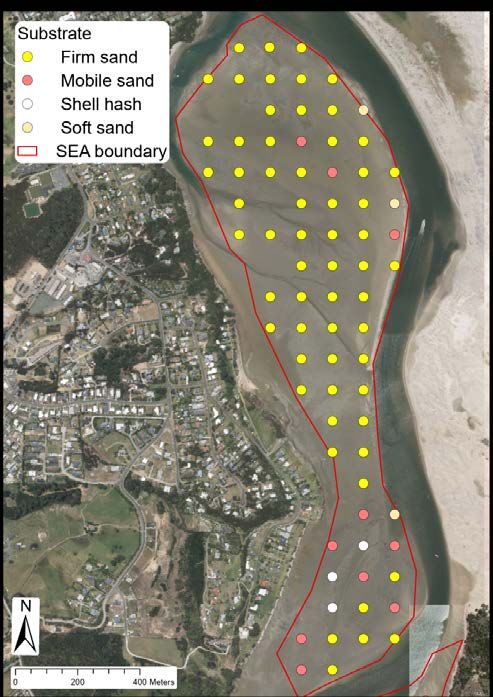
Results – substrate
Substrate in the northern SEA was predominantly firm sand with some mobile sand found in the
upper intertidal area towards the north-western area of the SEA (Figure 6). Substrate in the mid SEA
was predominantly firm sand in northern area of the sandflat with a combination of mobile sand,
shell hash and mobile sand towards the south of the sandflat (Figure 7). Substrate in the southern
SEA was predominantly firm sand, with some areas of mobile sand and a smaller area of soft sand
(Figure 8).

 Figure 6. Substrate type in the northern SEA.

Mangawhai SEA habitat assessment 7
Figure 7. Substrate type in the mid SEA.

 Figure 8. Substrate type in the southern SEA.

Mangawhai SEA habitat assessment 8
Results - epifauna
In total, 17 different taxa of benthic invertebrate were recorded (Table 2). No non-native taxa were
recorded. One unusual organism, Hydatina physis, was recorded in the southern SEA. H. physis or
Rose petal bubble shell is a species of sea snail, a marine opisthobranch gastropod mollusc. It is
relatively uncommon in New Zealand (Andrew Spurgeon pers com). This is the first recording of the
species in Mangawhai or the Kaipara District (source: http://www.mollusca.co.nz/).
Table 2. Epifauna recorded in Mangawhai.

 Taxa Common name
 Austrovenus stutchburyi Tuaki/Tuangi, Cockle
 Paphies australis Pipi
 Macomona Liliana Hanikura, Wedge shell
 Fellaster zelandiae Kina papa, Sand dollar
 Hydatina physis Rose petal bubble shell
 Diloma subrostratum Top shell
 Austrominius modestus Estuarine barnacle
 Zeacumantus lutulentus Koeti, Horn shell, Spire shell
 Chiton glaucus Papatua kakāriki, Chiton
 Cominella glandiformis Mud flat whelk
 Cominella adspersa Kawari, Speckled whelk
 Anthopleura aureoradiata Mud flat anemone
 Notoacmea helmsi Limpet
 Patiriella sp Cushion star
 Unidentified worm Unidentified worm
 Unidentified crab Unidentified crab
 Unidentified shrimp Unidentified shrimp

Results – incidental observations
In total ten different taxa of bird were recorded (Table 3).
Table 3. Bird taxa recorded at Mangawhai.

 Northern SEA Mid Sea Southern SEA
 Haematopus unicolor, Variable Haematopus unicolor, Variable Haematopus unicolor, Variable
 oystercatcher oystercatcher oystercatcher
 Charadrius obscurus, Charadrius obscurus, Charadrius obscurus Tūturiwhatu,
 Tūturiwhatu, Dotterel Tūturiwhatu, Dotterel Dotterel
 Larus dominicanus, Black-backed Larus dominicanus, Black-backed Larus dominicanus, Black-backed
 gull gull gull
 Larus novaehollandiae, Red-billed Larus novaehollandiae, Red-billed Larus novaehollandiae, Red-billed
 gull gull gull
 Stemidae, unidentified Tern
 Sternula nereis, Tara-iti, Fairy Tern
 Platalea regia, Spoonbill Platalea regia, Spoonbill
 Limosa lapponica, Bar-tailed Limosa lapponica, Bar-tailed
 godwit godwit
 Himantopus himantopus, Pied
 stilt
 Morus serrator, Australasian
 Gannet

Mangawhai SEA habitat assessment 9
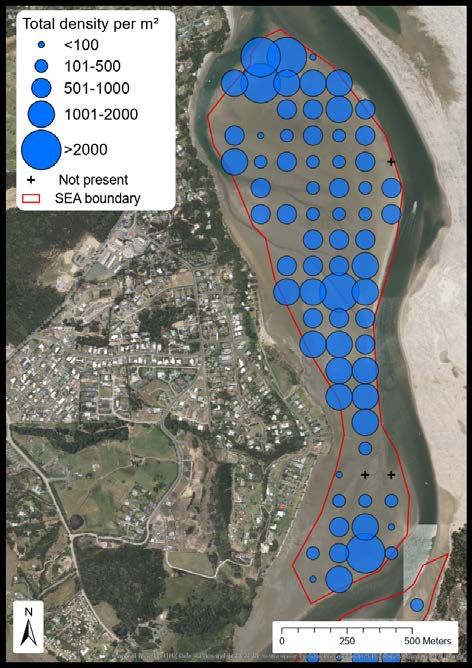
Results - cockles
Northern SEA
The extent of the northern SEA was determined to be 0.052km2. The total population of cockles in
the SEA was estimated to be 49.7 million (Table 4). The total biomass was estimated to be 169.6
tonnes (Table 5). High densities were found throughout the SEA although lower densities were
found higher up the intertidal zone towards the north-western corner of the SEA (Figure 9).
Table 4. Cockle density and population found in northern SEA.

 Juvenile cockles Adult cockles All cockles
 Sample size 20 20 20
 Mean density per square metre 170 785 955
 Standard error 54.5 151.1 178.7
 Stratum area (m2) 52055 52055 52055
 Total population (millions) 8.8 40.9 49.7

Table 5. Cockle biomass found in northern SEA.

 Sample size Mean biomass
 Stratum Area (m2) Total (tonnes)
 (g/m2) (SE)
 20 3257 (750.4) 52055.25 169.6

Mangawhai SEA habitat assessment 10
Figure 9. Cockle densities in the Northern SEA.

Mangawhai SEA habitat assessment 11
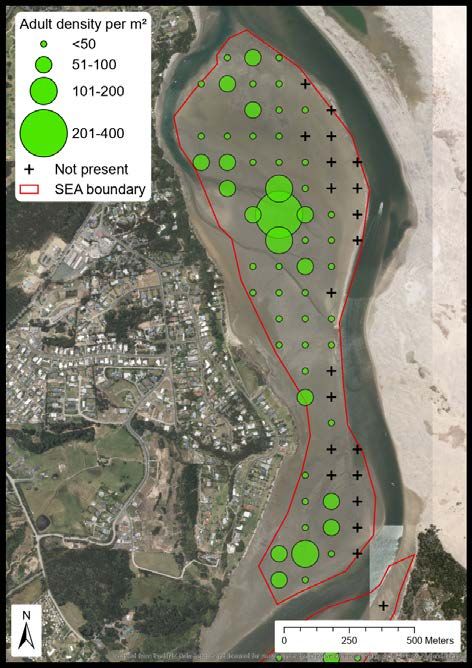
Mid SEA
The 2019 population of cockles in the SEA was calculated to be 659.6 million (Table 6). The total biomass
was estimated to be 1577.3 tonnes (Table 7). The highest densities were found towards the northern
edge of the sandflat, with densities as high as 3452 individuals per square metre at the tip of the sandflat.
High densities were also recorded in the middle section of the sand flat and at the southern end of the
SEA (Figure 10).
Table 6. Cockle density and population found in the mid SEA.

 Juvenile cockles Adult cockles All cockles
 Sample size 76 76 76
 Mean density (per square metre) 252 563 816
 Standard error 34.4 61.1 80.1
 Stratum area (m2) 807955 807955 807955
 Total population (millions) 203.9* 454.5* 659.6*

* There is a small difference between the juvenile and adult population and the total population because some cockles
 could not be measured due to broken shells.

Table 7. Cockle biomass found in the mid SEA.

 Sample size Mean biomass (g/m2)
 Stratum Area (m2) Total (tonnes)
 (SE)
 76 1952 (227.7) 807955 1577.3

Mangawhai SEA habitat assessment 12
Figure 10. Cockle densities in the mid SEA.

Mangawhai SEA habitat assessment 13
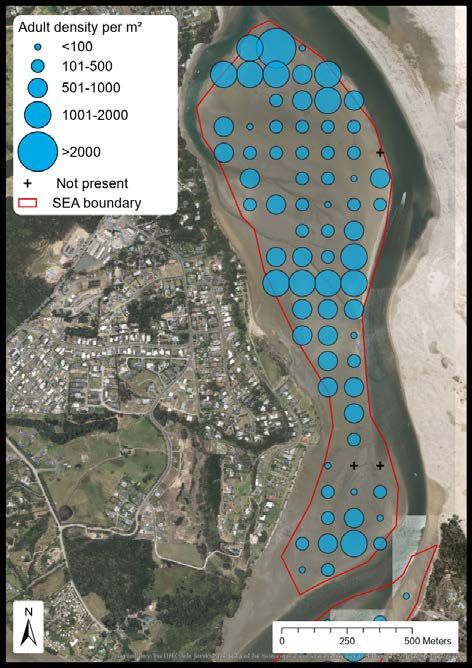
Southern SEA
The 2019 population of cockles in the SEA was calculated to be 245.3 million (Table 8). The total biomass
was estimated to be 608.4 tonnes (Table 9). High densities were found throughout the SEA (Figure 11).
There was only one site in the southern SEA where cockles were not present. This site was high up the
intertidal area very close to the shoreline where cockles would not be expected to occur.
Table 8. Cockle density and population found in the southern SEA.

 Juvenile cockles Adult cockles All cockles
 Sample size 33 33 33
 Mean density (per square
 169 518 687
 metre)
 Standard error 32.0 83.0 108.7
 Stratum area (m2) 357151.9 357151.9 357151.9
 Total population (millions) 60.3 185.0 245.3

Table 9. Cockle biomass found in the southern SEA.

 Sample size Mean biomass (g/m2)
 Stratum Area (m2) Total (tonnes)
 (SE)
 33 1703 (293.9) 357151.9 608.4

Mangawhai SEA habitat assessment 14
Figure 11. Cockle densities in the southern SEA.

Mangawhai SEA habitat assessment 15
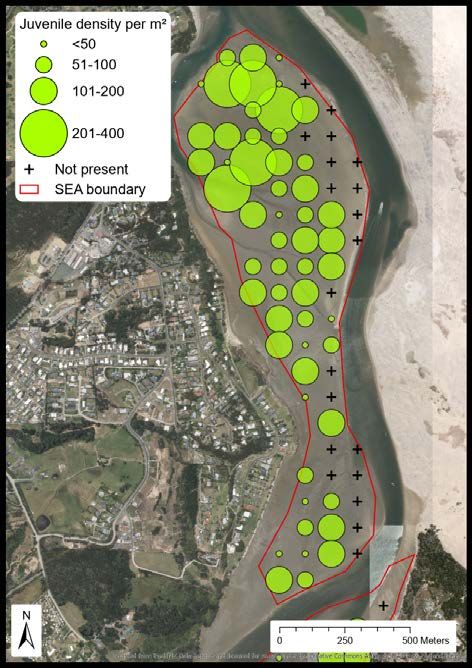
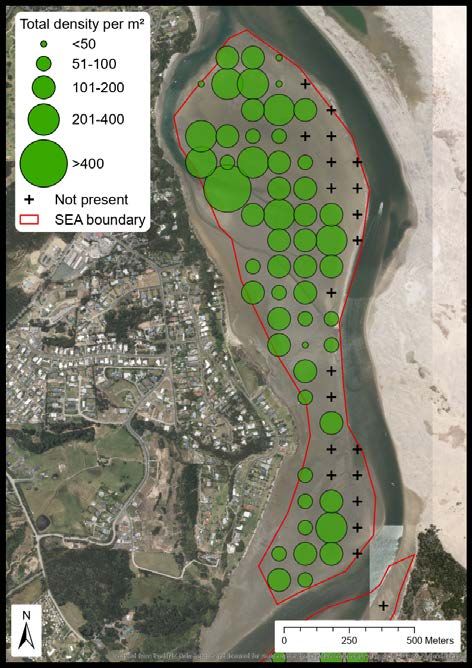
Results – wedge shell
Northern SEA
The 2019 population of wedge shell in the SEA was calculated to be 4.2 million (Table 10). High densities
were found throughout the SEA although lower densities were found higher up the intertidal zone
(Figure 12).
Table 10. Wedge shell density and population found in the northern SEA.

 Juvenile wedge shells Adult wedge shells All wedge shells
 Sample size 20 20 20
 Mean density (per square metre) 48 33 81
 Standard error 9.9 8.3 15.9
 Stratum area (m2) 52055.2 52055.2 52055.2
 Total population (millions) 2.5 1.7 4.2

Mid SEA
The 2019 population of wedge shells in the SEA was calculated to be 89.6 million (Table 11). High
densities were recorded throughout the SEA, although lower densities were found along the eastern
edge of the SEA (Figure 13).
Table 11. Wedge shell density and population found in mid SEA.

 Juvenile wedge shells Adult wedge shells All wedge shells
 Sample size 76 76 76
 Mean density (per square metre) 83 28 111
 Standard error 10.0 4.7 11.4
 Stratum area 807955 807955 807955
 Total population (millions) 66.8 22.9 89.6

Southern SEA
The 2019 population of wedge shell in the southern SEA was calculated to be 40.7 million (Table 12).
High densities were found throughout the SEA (Figure 14). Additional samples collected outside the
southern boundary of the SEA, contained moderate to high densities of wedge shells.
Table 12. Wedge shell density and population found in southern SEA.

 Juvenile wedge shells Adult wedge shells All wedge shells
 Sample size 33 33 33
 Mean density (per square metre) 86 28 114
 Standard error 10.7 4.6 12.2
 Stratum area (m2) 357151.9 357151.9 357151.9
 Total population (millions) 30.6 10.1 40.7

Mangawhai SEA habitat assessment 16
Figure 12. Wedge shell densities in the northern SEA.

Mangawhai SEA habitat assessment 17
Figure 13. Wedge shell density in the mid SEA.

Mangawhai SEA habitat assessment 18
Figure 14. Wedge shell densities in the southern SEA.

Mangawhai SEA habitat assessment 19
Results – pipi
Northern SEA
The 2019 population of pipi in the northern SEA was calculated to be 1.3 million (Table 13).
Table 13. Pipi density and population found in northern SEA.

 Sample size Pipi density (per m2) (SE) Stratum Area (m2) Total (million)
 20 25 (44.8) 52055.25 1.3

Mid SEA
The 2019 population of pipi in the mid SEA was calculated to be 7.9 million (Table 14).
Table 14. Pipi density and population found in the mid SEA.

 Sample size Pipi density (per m2) (SE) Stratum Area (m2) Total (million)
 76 10 (2.5) 807955.3 7.9

Southern SEA
Only three pipi were recorded in the southern SEA. The population of pipi in the northern SEA was
estimated to be 32,468 (Table 15).

Table 15. Pipi density and population found in southern SEA.

 Sample size Pipi density (per m2) (SE) Stratum Area (m2) Total
 33 0.1 (0.1) 357151.9 32468

Mangawhai SEA habitat assessment 20
Summary
Substrate
Substrate in all three SEAs was comprised of mainly firm sand, with some areas of mobile sand. A recent
habitat assessment of Ruakaka Estuary indicated that firm sand and mobile sand were important
substrate types for cockles and wedge shells (Griffiths et al. 2019).

Epifauna
In total, 17 different taxa were recorded. The diversity of taxa recorded, and the individual species
present were indicative of a healthy sand flat. No non-native taxa were recorded.

Birds
In total, ten taxa of birds were recorded. The diversity and numbers of bird taxa recorded was high for an
intertidal sand flat (personal observation).

Cockles
The Ministry of Primary Industries has used a density of 25 cockles (>30mm shell length) per square
metre, as a guideline to identify areas which may need management control (Pawley, 2012). Separately,
Hewitt & Funnel (2005) developed an ecological classification for their survey of benthic habitats in the
southern Kaipara Harbour, which was subsequently used by Griffiths (2014) in a survey of the northern
Kaipara Harbour. Hewitt and Funnell (2005) classified cockle habitat if adult densities were greater than
226 individuals per square metre.

The mean density of adult cockles (>15mm shell length) in the northern, mid and southern SEA was 785,
563 and 518 individuals per square metre respectively. The current survey therefore indicates that all
three SEAs contain extensive cockle beds.

Wedge shell
Needham et al. (2013) developed a classification system which classifies wedge shell habitat if densities
are equal or greater than four individuals (>30mm shell length) from a 15 x 15cm area (177 individuals
per square metre). The same classification criteria were used by Griffiths et al. (2019) in a habitat survey
of Ruakaka Estuary.

The mean density of adult wedge shell (>30mm shell length) in the northern, mid and southern SEA was
33, 28 and 28 individuals per square metre respectively. The current survey therefore indicates that
although wedge shells were found throughout all three SEA, the densities were generally below the
number required to be classified as wedge shell habitat.

Pipi
Low densities of pipi were recorded in all three SEAs. Pipi are generally found from the low intertidal to
subtidal zone. The current SEA boundary does not extend sufficiently down the tidal range to include
subtidal habitat where large densities of pipi may be present.

Mangawhai SEA habitat assessment 21
References
Griffiths R., Eyre R., Bamford N., Umuroa N., Brotherhood B., Jolly M., Sharp-Heward J. (2019). Ruakaka
remote piloted aircraft system (RPAS) survey and habitat mapping. Northland Regional Council,
Whangārei. pp46.

Griffiths R. (2014). Kaipara Harbour Estuary Monitoring Report 2014. Northland Regional Council,
Whangārei, pp 58.

Hewitt J.E & Funnell G.A. (2005). Benthic marine habitats and communities of the southern Kaipara.
Prepared by NIWA for Auckland Regional Council. Auckland Regional Council. Technical Publication
275pp.

Needham H. R., Townsend M., Hewitt J. E & Hailes, S. (2013). Intertidal habitat mapping for ecosystem
goods and services: Waikato estuaries. Hamilton, NZ: Waikato Regional Council. pp64.

Northland Regional Council (2018). Proposed Regional Plan for Northland. pp 303.

Pawley, M.D.M. (2012). The distribution and abundance of pipis and cockles in the Northland,
Auckland and Bay of Plenty regions, 2012. New Zealand Fisheries Assessment Report 2012/45.

Robertson B.M; Gillespie P.A; Asher R.A, Frisk S, Keeley N.B.; Hopkins G.A.; Thompson S.J.; Tuckey B.J.
(2002). Estuarine environmental; Assessment and Monitoring: A National Protocol. Part A. Development,
Part B. Appendices, and Part C. Application. Prepared for supporting Councils and the Ministry of
Environment, Sustainable Management Fund Contract No. 5096. Part A. 93pp. Part B. 159pp. Part C. 40
pp plus field sheets.

Williams J.R.; Smith M.D, Mackay G. (2009). Biomass survey and stock assessment of cockles
(Austrovenus stutchburyi) on Snake Bank, Whangarei Harbour, 2009. New Zealand Fisheries Assessment
Report 2009/29. 22 pp.

Mangawhai SEA habitat assessment 22
Northland Regional Council
P 0800 002 004
E info@nrc.govt.nz
W www.nrc.govt.nz
You can also read