The international role of the euro - SUERF webinar 14 June 2021
←
→
Page content transcription
If your browser does not render page correctly, please read the page content below

The international
role of the euro

SUERF webinar

                                                  Hans-Joachim Klöckers and Arnaud Mehl
14 June 2021
                    The views expressed here are those of the authors and do not necessarily represent those of the ECB or the Eurosystem

                                                                                                     w ww.ecb.europa.eu ©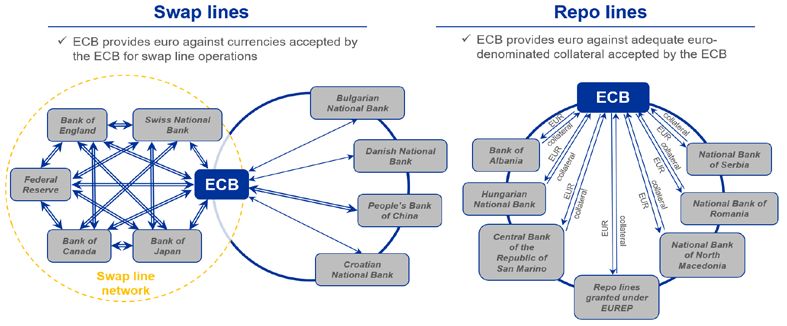
Outline

 1. Key developments in the international role of the euro in 2020

 2. Special features
     A. EU and ECB policy responses to the pandemic and the euro’s global role
     B. Central bank digital currency and global currencies
     C. The euro as an invoicing currency for global trade

 3. Conclusions

                                                   2                             w ww.ecb.europa.eu ©
The role of the euro remained broadly stable at a low level in 2020
Composite index of the international role of the euro
(percentages; at current and constant Q4 2020 exchange rates; four-quarter moving averages)
Constant exchange rates
Current exchange rates
24
23
22
21
20
19
18
17
1999 2000 2001 2002 2003 2004 2005 2006 2007 2008 2009 2010 2011 2012 2013 2014 2015 2016 2017 2018 2019 2020
Sources: BIS, IMF, CLS Bank International, Ilzetzki, Reinhart and Rogoff (2019) and ECB calculations.
Notes: Arithmetic average of the shares of the euro at constant (current) exchange rates in stocks of international bonds, loans by banks outside the euro area to borrowers outside the euro area, deposits with banks
outside the euro area f rom creditors outside the euro area, global foreign exchange settlements, global foreign exchange reserves and global exchange rate regimes. Data at constant exchange rates are not available
f or global f oreign exchange settlements. The estimates for the share of the euro in global exchange rate regimes from 2016 onwards were obtained by ECB staff using the same methodology as Ilzetzki, E., Reinhart,
C. and Rogoff, K. “Exchange Arrangements Entering the 21st Century: which anchor will hold?”, Quarterly Journal of Economics, Vol. 134(2), 2019, pp. 599 646, complemented with ECB staff judgement. The latest
observ ations are for the fourth quarter of 2020.
3 w ww.ecb.europa.eu ©The euro remains the second most important currency globally
Snapshot of the international monetary system
(percentages)
US dollar Japanese yen
Euro Chinese renminbi
70
60
50
40
30
20
10
0
Foreign exchange International debt International loans Foreign exchange Global payment
reserves turnover currency (SWIFT)
Sources: BIS, IMF, SWIFT and ECB calculations.
Note: The latest data for foreign exchange reserves, international debt and loans are for the fourth quarter of 2020. Foreign exchange turnover data as of April 2019. SWIFT data as of December 2020.
4 w ww.ecb.europa.eu ©The US dollar punches above the US global economic weight
Global currency status vs. share in global GDP Global currency status vs. share in global exports
(percentages) (percentages)
30 30
25 25
Share of global GDP (PPP, %)
Share of glob al exports of goods
20 Chi nese 20
renmi nbi US dol lar Euro
and services (%)
Chinese
15 15renminbi
Euro
US dollar
10 10
Ja pa nese yen Japanese yen
5 5
0 0
0 10 20 30 40 50 60 0 10 20 30 40 50 60
Composite index of global currency status (%) Composite index of glob al currency status (%)
Sources: BIS, IMF, SWIFT and ECB calculations.
Note: The latest data for foreign exchange reserves, international debt and loans are for the fourth quarter of 2020. Foreign exchange turnover data as of April 2019. SWIFT data as of December 2020. The 45-degree
line is indicated as a red dashed line.
5 w ww.ecb.europa.eu ©The pandemic affected some indicators of the euro’s global appeal to
different degrees
Evolution of selected indicators of the euro’s international role in 2020 Euro exchange rates in 2020
(Q4 2020 – Q4 2019 changes, percentages, at constant Q4 2020 exchange rates) (end-2020 – end-2019, percentages)
10
1
8
0
6
-1
4
-2
2
-3
0
-4
EUR NEER-42 EUR/USD
International Foreign currency Foreign exchange International debt International loans Invoicing of euro
deposits debt issuance reserves securities area goods imports Source: ECB.
Notes: EUR NEER-42 refers to the nominal effective exchange rate of
the euro v is-à-vis the currencies of 42 major trading partners. An
Sources: ECB, BIS, IMF, national sources and ECB staff calculations. increase indicates an appreciation of the euro.
6 w ww.ecb.europa.eu ©The “dash for cash” that accompanied the pandemic also benefited the US
dollar as an international deposit currency
Currency composition of outstanding amounts of international deposits
(percentages, at constant Q4 2020 exchange rates)
Euro US dollar Yen Other
80
70
60
50
40
30
20
10
0
1999 2002 2005 2008 2011 2014 2017 2020
Sources: BIS and ECB calculations.
Notes: The latest observations are for the fourth quarter of 2020. International deposits are defined as deposits with banks outside the currency area from creditors outside the currency area
7 w ww.ecb.europa.eu ©Strong issuance of US dollar bonds by emerging markets led to a decline in
the share of the euro in foreign currency bond issuance
Currency composition of foreign currency- Regional breakdown of US dollar-denominated
denominated bond issuance international bond issuance
(percentages) (USD billions)
Euro area
Euro US dollar Other Japan
Other advanced economies
Emerging market economies
80% Non-euro area EU
700
600
60%
500
40% 400
300
20% 200
100
0%
0
1999 2002 2005 2008 2011 2014 2017 2020 1999 2002 2005 2008 2011 2014 2017 2020
Sources: Dealogic and ECB calculations. Sources: Dealogic and ECB calculations.
Note: The latest observations are for end-2020. Note: The latest observations are for the fourth quarter of 2020.
8 w ww.ecb.europa.eu ©The share of the euro in global foreign exchange reserves declined slightly in
2020 and that of the US dollar stands at a two-decade low
Evolution of the share of selected currencies in Average interest rates for major reserve
global foreign exchange reserves currencies in 2020
(percentages; at constant Q4 2020 exchange rates) (percentages)
Euro (right-hand scale)
5-year government bond yield 1-month deposit rate
US dollar (left-hand scale)
Other currencies (right-hand scale) 0.75
74 28
72 26
0.50
70 24
68 22 0.25
66 20
0.00
64 18
62 16
-0.25
60 14
58 12 -0.50
56 10
54 8 -0.75
1999 2002 2005 2008 2011 2014 2017 2020 EUR JPY GBP AUD USD CAD
Sources: Haver Analytics, Refinitiv Datastream and ECB staff calculations. Note: the 5-year government
Sources: IMF and ECB calculations. y ield f or the euro area is calculated as a debt-weighted average of 5-year euro area yields of sovereigns
Note: The latest observations are for the fourth quarter of 2020. with at least an AA credit rating according to Standard and Poor’s.
9 w ww.ecb.europa.eu ©The euro remained a key currency in international green bond markets
Currency breakdown of “global” issuance Currency breakdown of “international” issuance
of green bonds (all issuers worldwide) of green bonds (only non-national issuers)
(percentages) (percentages)
EUR EUR: Non-euro area nationality
USD USD: Non-US nationality
Other Other: Foreign nationality
100% 100%
90% 90%
80% 80%
70% 70%
60% 60%
50% 50%
40% 40%
30% 30%
20% 20%
10% 10%
0% 0%
2013 2014 2015 2016 2017 2018 2019 2020 2013 2014 2015 2016 2017 2018 2019 2020
Sources: Dealogic and ECB calculations. Source: Dealogic and ECB calculations.
Note: Bonds issued by all issuers, irrespective of their nationality or residence. The latest observations are Note: Bonds issued by non-national issuers. The latest observations are for 31 December 2020.
f or 31 December 2020.
10 w ww.ecb.europa.eu ©Summary Part 1
• Broad stability in the international role of the euro after the pandemic shock.
• This compares favourably to the developments after the GFC, reflecting a forceful
joint policy response in the EU this time
• Average share of the euro across various indicators remaining historically
relatively low, well below pre-Lehmann peaks
• Global trend towards reserve currency diversification continuing
• Euro has potential to strengthen its international role in green bond markets
11 w ww.ecb.europa.eu ©2. Special features
A. EU and ECB policy responses to the pandemic and the euro’s global
role
B. Central bank digital currency and global currencies
C. The euro as an invoicing currency for global trade
12 w ww.ecb.europa.eu ©EU bonds issuance under SURE well received by non-euro area investors
Geographical distribution of investors for SURE bonds issued in 2020
different EU bonds issued in 2020 Investor distribution at the time of allocation
(percentages)
Non-EA investors EA investors Of which domestic investors
Central banks
Maturity Value Insurance and Other asset Non-euro area
and official
Germany (Bund 15Y) (years) (€bn) pension funds managers inv estors
institutions
ESM (ESM bond 10Y)
5 8 30% 5% 65% 60%
France (OAT 20Y)
COM (SURE bond 10Y) 10 10 37% 6% 57% 49%
COM (SURE bond 15Y)
15 8.5 15% 14% 71% 45%
Italy (BTP 15Y)
20 7 13% 13% 74% 31%
COM (SURE bond 20Y)
30 6 15% 23% 62% 35%
0% 20% 40% 60% 80% 100%
Sources: ECB staff calculations based on data released by the European Commission (COM), the Source: ECB staff calculations based on data released by EU and national authorities. Data refers to
European Stability Mechanism (ESM) and national authorities. distribution at the time of the first allocation of SURE bonds. “Other asset managers” includes the following
Notes: data refers to the distribution at the time of first allocation of bonds. categories: fund managers, bank treasures, banks, hedge funds, others.
13 w ww.ecb.europa.eu ©NGEU first step towards an European safe asset but unlikely to change the
global status of the euro
Amount outstanding of general government Market capitalisation of Bloomberg Barclays
debt securities Global Aggregate Aaa Index
(USD trillions) (percentage of world GDP)
25
20
NGEU +
15 SURE
(Aaa)
Aaa
10 Aaa
Aa
5 A1
A1
A to
Aa3
Ba
0
US
UK
Japan
Euro area
China
Sources: BIS, Haver Analytics, Bloomberg, European Commission and ECB calculations.
Notes: The data refer to total debt securities issued by the general government. Planned issuance for NGEU. Sources: Bloomberg, IMF and ECB staff calculations.
Latest Moody ’s local currency long-term sovereign debt rating. The observations are for the third quarter of 2020 Notes: The Bloomberg Barclays Global Aggregate - Aaa Index is a measure of Aaa index rated debt
f or the amount outstanding of debt securities and for 2 March 2021 for credit ratings. including treasury, government-related, corporate and securitized fixed-rate bonds.
14 w ww.ecb.europa.eu ©The ECB´s monetary policy measures in response to the pandemic have
been swift and forceful and helped stabilise the euro area economy
• Launch of the pandemic emergency purchase programme (PEPP) in March
2020:
Initial envelope increased from €750 billion to €1,850 billion in December 2020.
• Expansion of longer-term liquidity refinancing operations (TLTRO III):
– Volume of outstanding take-up reached €2 trillion in May 2021
– Measures to increase attractiveness of TLTRO III
Lending interest rate reduced to up to -1%.
Increase in the borrowing allowance
Expansion of the range of eligible collateral
15 w ww.ecb.europa.eu ©Providing euro liquidity internationally through liquidity lines contributed to
forestall the pandemic’s potential adverse implications on the euro area
Estimated impact of ECB liquidity lines on
Eurosystem framework for providing euro funding cost of recipients (currency basis)
liquidity to other central banks (basis points)
0
-5
-10
-15
-20
-25
Announcement day 1 week after 2 weeks after
Source: ECB.
Note: Under the swap line arrangements, the ECB provides euro liquidity against currencies accepted
by the ECB for swap line operations. Under the repo line arrangements, the ECB provides euro liquidity
Sources: ECB calculations.
against adequate euro-denominated collateral accepted by the ECB. EUREP is the Eurosystem repo
Notes: The chart shows estimates from an event study of the effect of the liquidity lines obtained in 2020 by
f acility for central banks. The countries mentioned in the overview of the Eurosystem’s repo line
Bulgaria, Croatia, Denmark, Hungary and Romania on their corresponding currency basis, controlling for fixed
arrangements are only examples to illustrate the functioning of these types of agreements. A double
ef f ects, month effects and the VIX index. The estimates are obtained on daily data over the period 2010-2020.
line in the swap lines ov erview indicates that the agreement is reciprocal.
16 w ww.ecb.europa.eu ©2. Special features
A. EU and ECB policy responses to the pandemic and the euro’s global role
B. Central bank digital currency and global currencies
C. The euro as an invoicing currency for global trade
17 w ww.ecb.europa.eu ©Central bank digital currency supports use of a currency in cross-border
payments, depending on its design
• Issuing a digital euro may become important if foreign digital money (foreign
CBDC or stablecoins) largely displaced existing means of payments in the
euro area.
• A digital euro will mainly serve domestic payment purposes. But it could
also reduce frictions and costs of euro-denominated cross-border payments
and thereby support the euro’s global role.
• Features specific to digital means of payment could ease international
adoption of a central bank digital currency:
Safety, low transaction costs, bundling effects and programmability, potential
feedback loops in use as means of payment and store of value.
• Design choices matter for the global outreach of a central bank digital
currency:
Interoperability, restrictions on non-resident holdings, remuneration.
18 w ww.ecb.europa.eu ©CBDC supports global use of a currency but not necessarily a game changer
Model simulations on the impact of CBDC for international currency use
(Currency breakdown of global export payments in alternative simulations, percentages)
Currency 1
Other currencies
100
90
80
70
60
50
40
30
20
10
0
Baseline without CBDC Baseline with CBDC
Source: ECB calculations.
Notes: The lef t panel shows simulations based on a three-country DSGE model in the spirit of Eichenbaum et al. (2020) with no capital controls, a 1% liquidation cost for debt securities, symmetric 33%-weights for all
countries and the same volatility of the exogenous shocks in both simulations.
19 w ww.ecb.europa.eu ©2. Special features
A. EU and ECB policy responses to the pandemic and the euro’s global role
B. Central bank digital currency and global currencies
C. The euro as an invoicing currency for global trade
20 w ww.ecb.europa.eu ©The US dollar is a globally dominant invoicing currency while the euro is a
regionally dominant currency in Europe and some parts of Africa
Trade and invoicing currency shares at the country level: US dollar vs. euro
(percentages)
100 100
Serbia
Montenegro
West Af rican
80 80 f ranc zone
EUR export inv oicing share
USD export inv oicing share
Moldov a
60 60
40 40
20 20
Russia
Kazakkstan
Algeria
Azerbaijan
0 0
0 20 40 60 80 100 0 20 40 60 80 100
Export share accounted for by the United States Export share accounted for by the euro area
Source: Boz et al. (2020).
Notes: The chart presents scatter plots of the share of countries' total exports accounted for by the United States and the share of total exports invoiced in US dollars (left panel), as well as the share of total exports
accounted for by the euro area and the share of total exports invoiced in euro (right panel). The 45-degree line is shown as a black dashed line.
21 w ww.ecb.europa.eu ©3. Conclusions
• Broad resilience in the international role of the euro despite the pandemic
shock, in contrast to the euro area sovereign debt crisis episode.
• This may reflect, to some extent, the effectiveness of the unprecedented
policy support measures and coordinated approach prevailing in the euro
area.
• Stability of the role of the euro at a low level suggests that only further
resolute policy measures and reform efforts would enable to realise its
global potential.
22 w ww.ecb.europa.eu ©3. Conclusions (cont’d)
• Policy implications stressed by the Eurosystem in the past still valid:
“The international role of the euro is primarily supported by a deeper and more complete EMU, including
advancing the capital markets union, in the context of pursuing sound economic policies in the euro area.
The Eurosystem supports these policies and emphasises the need for further efforts to complete EMU.”
• Euro area capital markets less deep and liquid than in the US
Progress towards Capital Markets Union
• Other positive factors for the euro’s role:
NGEU, and creating a common safe asset
Green bonds, setting global standards and deepening the market
• Digital euro work in early stages, unlikely to be a game changer
23 w ww.ecb.europa.eu ©History offers lessons for the euro
Currency composition of globally disclosed foreign exchange reserves: 1899-2020
(percentages; at current exchange rates)
Pound sterling Japanese yen
US dollar Euro
French franc Chinese renminbi
German mark
90
80
70
60
50
40
30
20
10
0
1899 1909 1919 1929 1939 1949 1959 1969 1979 1989 1999 2009 2019
Source: Updated from Eichengreen, Barry, Arnaud Mehl and Livia Chiţu (2017), How global currencies work, Princeton University Press.
Notes: Data available for only 1899 and 1913 prior to the World War I. No data available for 1914-1927 and 1937-1946 due to incomplete archival records. The latest observations are for the third quarter of 2020.
24 w ww.ecb.europa.eu ©You can also read