SUSTAINABLE MANAGEMENT OF WATER BODIES BASED ON MULTISTEMPORAL SATELLITE IMAGES
←
→
Page content transcription
If your browser does not render page correctly, please read the page content below
Proceedings Vol. 1, 8th International Conference on Cartography and GIS, 2020, Nessebar, Bulgaria
                                                                            ISSN: 1314-0604, Eds: Bandrova T., Konečný M., Marinova S.

SUSTAINABLE MANAGEMENT OF WATER BODIES BASED ON
        MULTISTEMPORAL SATELLITE IMAGES

            Silviya Katsarska-Filipova1, Dobromir Filipov2, Paulina Raeva3

1PhD Eng. Silviya Katsarska-Filipova, Department of Photogrammetry and Cartography, Faculty
of Geodesy, University of Architecture, Civil Engineering and Geodesy, Sofia, email:
filipova_fgs@uacg.bg

2PhD Eng. Dobromir Filipov, Department of Photogrammetry and Cartography, Faculty of
Geodesy, University of Architecture, Civil Engineering and Geodesy, Sofia, email: dobrigf@abv.bg

3Eng. Paulina Raeva, Department of Geomatics, Faculty of Civil Engineering, CTU in Prague,
email: paulina.raeva@fsv.cvut.cz
Abstract
In this paper, the authors present a robust methodology for multitemporal analyses of ‘Ogosta’ reservoir near Montana
in Bulgaria, based on the processing of satellite images only with open-source data and software solutions. The
‘Ogosta’ reservoir was chosen as it is one of the largest man-made water body in the country and its wall is situated
less than 600m away from the nearest neighbourhoods and the free water level of the reservoir is higher than the level
of the city of Montana. Reservoir poses an enormous danger for the population of the region, especially after heavy
snow melting. Thus, the authors decided to analyse the multitemporal development of the water surface. We chose
open-source optical data from Sentinel-2. The extraction method was by computing the normalized difference water
index and binarizing the images. Every binary image was later vectorized in order to created polygons with surface
water data and calculate their area. The results were compared with a surface polygon of the reservoir.

Keywords: Copernicus, sentinel, NDWI, water bodies

INTRODUCTION

Monitoring of water bodies such as dams and reservoirs plays an important role in the National Security of the state.
Dams are built to provide with fresh water which is vital for humans or for agricultural irrigation purposes. In either
way, the key to the sustainable management of water bodies is to keep track of the spatial and temporal variability of
the water. Elevation of surface water, water areas and volumes are just a few of the hydraulic variables that are daily
measured by engineers. One of the numerous Remote Sensing tasks is mapping open water bodies accurately. Remotely
sensed data provide with technology on how to effectively observe land cover and especially surface water bodies.
According to a review article (Huang et al., 2018) based on the number of scientific publications since 2000, satellite
images have become widely used in monitoring surface water. By 2019, the publications have doubled. Surface water
bodies are rivers, lakes, dams, reservoirs, etc. They are crucial water resources for both fresh-water supply and
irrigation. Thus, it is of paramount importance that we keep track of their development. Water bodies are dynamic.
Especially artificial water bodies such as dams and reservoirs. They shrink after the summer and expand after the snow
melting. Therefore, multitemporal monitoring is strongly advisable to be used in managing man-made water bodies.

For our study, optical image data from Sentinel-2 was used. Sentinel-2 mission is part of the Copernicus programme
conducted by the European Space Agency and the European Union. Sentinel-2 are two twin satellites: Sentinel-2A and
Sentinel-2B launched in 2015 and 2017 (European Space Agency, 2020b). The mission provides with high-resolution
optical imagery which is fully open-source and available the Copernicus Open Access Hub website (European Space
Agency, 2020a). The platform uses a push-broom sensor which records multispectral images alongside a 290 km swath.
The satellites provide optical image data in 13 bands with spatial resolution varying from 10m to 60m. The temporal
resolution of Sentinel-2 is 5 days. The visible bands have the following parameters: blue (490nm), green (560nm), red
(665) and have a spectral resolution of 10m. Some of the main purposes of Sentinel-2 are spatial planning, agro-
environmental monitoring, water monitor, vegetation monitoring, etc.

There are several methods for extracting surface water from satellite data: image classification (supervised or
unsupervised) applied in some scientific studies (Kaplan and Avdan, 2017), Random Forest Classification (Acharya,

                                                                                                                                    693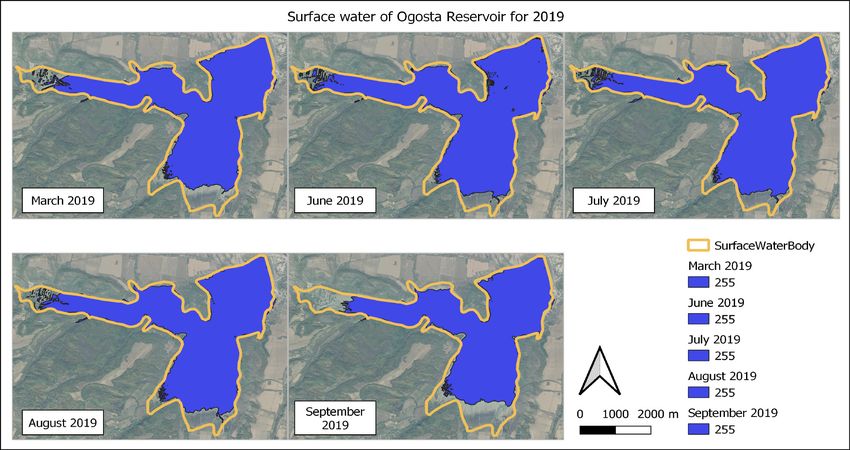
Proceedings Vol. 1, 8th International Conference on Cartography and GIS, 2020, Nessebar, Bulgaria
                                                                               ISSN: 1314-0604, Eds: Bandrova T., Konečný M., Marinova S.

Subedi and Lee, 2019) and water indices. In this paper, we present the simplest method for surface water extraction – by
using a water index, namely, the Normalized Difference Water Index. Multitemporal data can map the decreasing trends
in case of droughts and leakage or increasing – when snow melting. The study focuses on the usage of open-source data
and software solutions.

STUDY AREA

The focus of this paper is on the water reservoir Ogosta near the city of Montana, Bulgaria (43.38o, 23.18o). It is the
fourth largest by area and second-largest by volume artificial reservoir in the country. The water body is situated 600m
away and 60 m above the city. Ogosta captures the waters of the rivers Ogosta, Barzia and Zlatica. The construction
was finalized in 1986 and its main purpose was for irrigation of large arable areas. Unfortunately, only half of the
irrigation pipelines were built.

                          Figure 1. The geographical position of Ogosta reservoir. CS: WGS ‘84

Given the fact that only half of the irrigation installations are constructed, that leads to the Ogosta reservoir not being
used at its full capacity. Moreover, the quality of the water is bad and that it is not used as intended. Instead of irrigation
purposes, today’s purpose of the reservoir is producing electricity by two water power plants. The parameters of the
reservoir are stated in Table 1.

                                        Table 1. Parameters of the Ogosta reservoir
                                           Catchment basin                                    Average water
     Length               Width                                             Area                                           Volume
                                                area                                          mass per year

     6.3 km               2.6 km                 948 m2                  23.6 km2               384 mil. m3              506 mil. m3

The dam wall of the Ogosta reservoir is probably the most notoriously discussed in Bulgaria. It is claimed that the wall
is unstable, a probable landside is discussed. The fact that the water level is 60 m above the town of Montana makes it a
potential peril to the near and further settlements. The main reason we chose to analyse this reservoir is the publicity on
how the water ‘disappears’ during the summer which is an index of dry seasons (vesti.bg, 2020), (Za vodata, 2014),
(Wikipeadia, 2020). Moreover, there is an active petition sent to the European Parliament for immediate actions on state
of the dam wall (European Parliament, 2020).

                                                                                                                                       694
Proceedings Vol. 1, 8th International Conference on Cartography and GIS, 2020, Nessebar, Bulgaria
                                                                             ISSN: 1314-0604, Eds: Bandrova T., Konečný M., Marinova S.

CURRENT STAGE OF THE PROBLEM

In Bulgaria, dam and river waters are managed by the Ministry of Ecology and Water (MEW), however, hydro-
engineering constructions and riverbeds are managed by the Ministry of Regional Development and Public Works
(MRDPW). As per MEW, Bulgarian territory is divided water-wise into four large groups, water-wise: East Aegean
River Basin Directorate, West Aegean River Basin Directorate, Black Sea Basin Directorate and Danube River Basin
Directorate (Tuntova, no date). The Ogosta reservoir is under the management of the Danube River Basin Directorate
which is part of the Ministry of ecology and water. There are two important geographical information systems whose
purpose is to monitor different object entities in Bulgaria and, of course, water bodies. The first one is the GIS of the
Ministry of Regional Development and Public Works (see Figure 2) and the second one is by the Ministry of Ecology
and Water (see Figure 3). The second GIS is more detailed as far as waters are concerned. It consists of vector data of
the water bodies, as well as water catchments and control points. However, both GIS do not include multitemporal data
of the water bodies.

        Figure 2. GIS of the Ministry of Regional Development and Public Works. The platform is available at
                                            http://gis.mrrb.government.bg/

   Figure 3. Geoinformation system for water management and reporting of the Ministry of Ecology and Water. The
                          platform is available at http://gwms.eea.government.bg/giswmr/

                                                                                                                                     695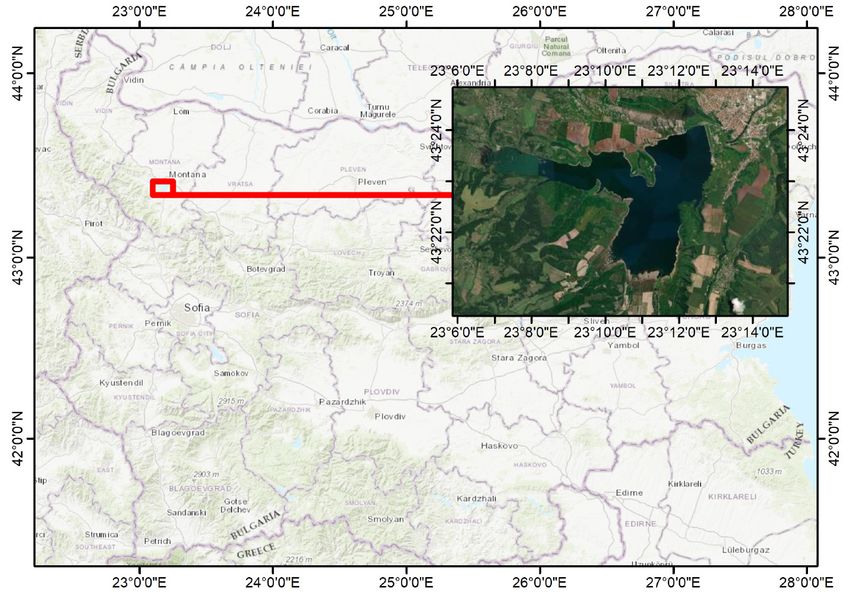
Proceedings Vol. 1, 8th International Conference on Cartography and GIS, 2020, Nessebar, Bulgaria
                                                                              ISSN: 1314-0604, Eds: Bandrova T., Konečný M., Marinova S.

PROPOSED METHODOLOGY

In this paper, we aim at proposing a simple processing methodology for multitemporal observing of water bodies. For
this purpose, we use fully open data by the Copernicus programme.

Figure 4. Copernicus Open Access Hub available at https://scihub.copernicus.eu/dhus/#/home. Satellite imagery is fully
                                          accessible after registration.

We opted for optical data by the twin satellites Sentinel-2. We used data from 2019. We worked with imagery after the
snow melting, during the summer and imagery from the autumn (see Table 2).

        Table 2. Tables should be produced directly within the text. Captions 10 pt., Italic, Center, above the table
 Multitemporal
                           Scene 1               Scene 2                 Scene 3                  Scene 4                 Scene 5
   Imagery

        date             25th March              8th June                18th July              7th August             8th September

Before creating a workflow, we decided to test different color composites in order to choose the methodology where
water is seen as contrast as possible. We used four different approaches – true-color composite, false-color, NDWI and
mNDWI. When working with Sentinel-2 data, the band order must be followed:

    •     RGB – or true-color composite [B4, B3, B2]
    •     False-color composite - [B8, B4, B3]
    •     NDWI – normalized difference water index – (B3-B8)/(B3+B8)
    •     mNDWI mean normalized difference water index – (B3-B11)/(B3+B11)
In tru-color composite, the water down not have good contrast and could unrecognizable. However, in the false-color
composite water appear dark and vegetation reddish. When having NDWI or mNDWI water appear white and
vegetation dark. Based on this analys we concluded to work our methodology by computing the NDWI as way of
surface water extraction.

                                                                                                                                      696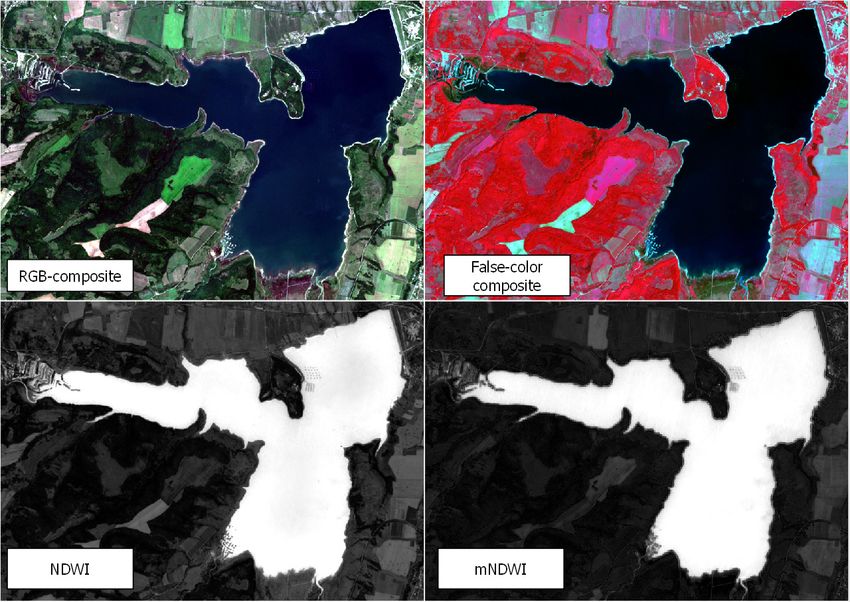
Proceedings Vol. 1, 8th International Conference on Cartography and GIS, 2020, Nessebar, Bulgaria
                                                                            ISSN: 1314-0604, Eds: Bandrova T., Konečný M., Marinova S.

Figure 5. State of the Ogosta reservoir on 8th June seen in true-color composite, false-color composite and NDWI and
                                                       mNDWI.

The postprocessing was conducted in the Sentinel native open-source software – ESA SNAP (SNAP Tutorials | STEP,
no date). The processing workflow is shown in Figure 7. The downloaded scenes are zipped with an approximate size of
1GB. The zipped file (a.k.a. product) was imported into SNAP. We created a workflow graph to automized the
processing the multitemporal images. The graph is shown in Figure 6. The workflow was applied to all scenes. Given
the fact that the spatial resolution of the channels is different, the processing step is to conduct a resampling of the
bands from 10 m to 60 m. The bands with a 10m-resolution are red, green, blue and near infra-red. We chose to
resample all bands to have a spatial resolution of 10m. Then we conducted a geospatial subset with predefined
coordinates of the Ogosta area.

                    Figure 6. Automatical satellite image processing in SNAP using a graph builder

When subsetting the area of interest, one could save valued time and computer memory when applying further
calculations. Thus, we calculated the Normalized Difference Water Index as per formula

                                                                                                                                    697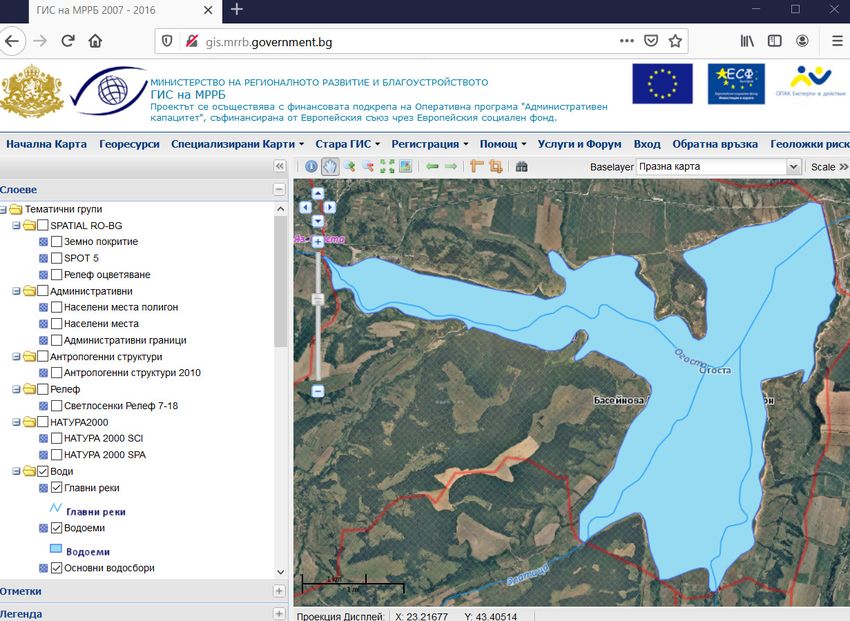
Proceedings Vol. 1, 8th International Conference on Cartography and GIS, 2020, Nessebar, Bulgaria
                                                                            ISSN: 1314-0604, Eds: Bandrova T., Konečný M., Marinova S.

                                         NDWI = (B3 – B8)/(B3+B8), (1)

Where B3 is the green band and B8 is the near infra-red band. The green electromagnetic light has a high reflectance
and the NIR band to the contrary has low reflectance. The NDWI values from a mathematical point of view belong to
the interval [-1; +1].

                                 Figure 7. The workflow of the proposed methodology

After calculating the NDWI index we set a threshold to the values in order to binarize the image. The threshold was set
according to Formula (2):

                                           if NDWI >0 then 1 else 0, (2)

This formula gives us a binary image where the water pixels get a value 1 and the non-water pixels – 0. The work
continued in the open-source software QGIS (QGIS community, 2020). The binary images were imported and vectorize
in order to get a polygon or a few polygons which contain surface water. Then we calculated the area of each water
polygon and the total area of all polygons. This metadata was saved in the attribute table of every dataset.

The results from the postprocessing were compared to the surface polygon of the Ogosta reservoir is available from the
European Environmental Agency. The total area of the surface polygon is 17.23 km2.

RESULTS

The results of the analyses are monthly maps comparing the water surface status with the original water boundary. The
areas are computed for each month that was observed. Given the fact that we used a predefined computation workflow,
thanks to the graph builder in SNAP, the computation of 5-month worth of data was less than 3 hours.

 Figure 8. State of the Ogosta reservoir as per 8th June seen in true-color composite, false-color composite and NDWI
                                                      and mNDWI.

                                                                                                                                    698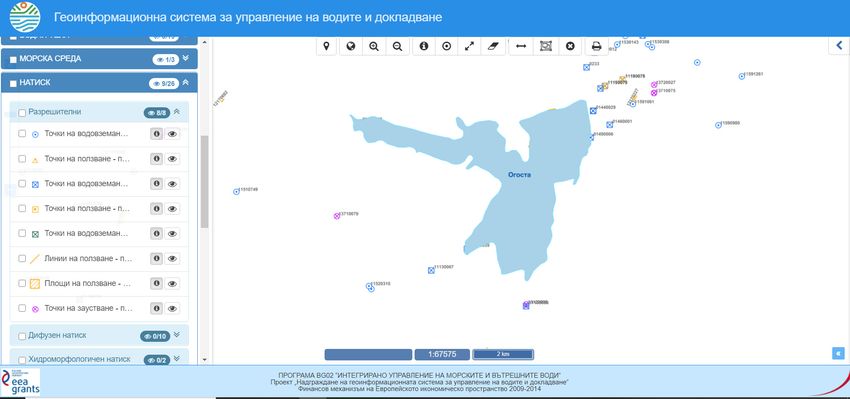
Proceedings Vol. 1, 8th International Conference on Cartography and GIS, 2020, Nessebar, Bulgaria
ISSN: 1314-0604, Eds: Bandrova T., Konečný M., Marinova S.
The first maps in Figure 8. are false-color composites which show the exact state of the surface water. Nonetheless, the
area calculations were based on vectorized binary images. The results of the surface water computations are shown in
Figure 9.
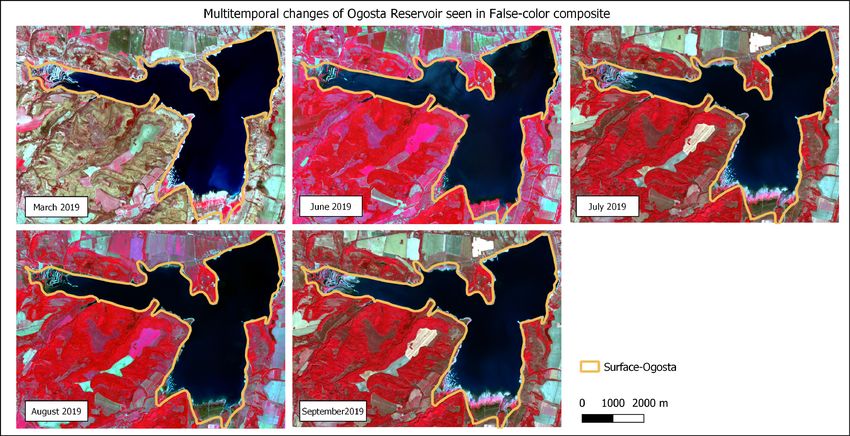
Figure 9. Multitemporal analyses of the surface water of Ogosta reservoir in 2019
The monthly calculations of the water surface area are shown in Table 3. alongside with the official area of the reservoir
and the area boundary presented by the European Environmental Agency. The results show that after the snow melting,
the surface area increases to 15-16 km2. The biggest area value is observed in August which is an index that 2019 was
not a dry year. Judging by the results in August 2019 water was started to be released from the reservoir in the Ogosta
river. This is a classical operation to prepare the reservoir area for the following autumn and winter season.
Table 3. Surface water area of Ogosta reservoir
2
Area [km ] September
EEA [km2] March [km2] June [km2] July [km2] August [km2]
[km2]
Official
26.60 17.28 14.19 15.16 15.43 15.96 13.27
We also compared the results to two area values available from official information and the data from the EEA. It is
noticeable that there is a big difference between the official area value 23.6 km2 and the calculated ones from 2019.
This could mean that the reservoir is not being filled on purpose due to the instability of the dam wall. Another reason
could be that this surface was never filled with water and this area value is a project value from the ‘80s.
699Proceedings Vol. 1, 8th International Conference on Cartography and GIS, 2020, Nessebar, Bulgaria
ISSN: 1314-0604, Eds: Bandrova T., Konečný M., Marinova S.
Figure 10. Comparison graph of the surface water area from 2019. Official surface water is stated to be 23.6 km2. The
polygon area provided by the European Environmental Agency is 17.28 km2.
CONCLUSION
The purpose of this study paper was to show the necessity of a multitemporal observation of large water bodies. A
robust and simple methodology for multitemporal surface water analyses was presented. The data used was open-source
Sentinel-2 optical satellite data. Sentinel-2 is part of the Copernicus programme by the European Space Agency and the
European Union. Image processing was conducted in the native open-source software from ESA – SNAP. The
workflow consisted of a graph builder for automatic computation of multitemporal data: band resampling, geographical
data subset, normalized difference water index computation, computing of binary images and exporting. The rest of the
processing was done in QGIS which is another open-source software GIS analyses. All binary images were vectorized
in QGIS which resulted in a few water polygons. The areas of the water polygons were computed and stored in the
attribute table of each dataset. The total area was then computed, and a comparison table was created – see Table 3. and
Figure 10.
REFERENCES
Acharya, T. D., Subedi, A. and Lee, D. H. (2019) ‘Evaluation of machine learning algorithms for surface water extraction in a landsat
8 scene of nepal’, Sensors (Switzerland), 19(12). doi: 10.3390/s19122769.
European Parliament (2020) Начална страница | PETI | Комисии | Европейски парламент. Available at:
https://petiport.secure.europarl.europa.eu/petitions/bg/petition/content/0157%252F2020/html/%25D0%259D%25D0%25B5%25D0
%25B4%25D0%25BE%25D0%25B8%25D0%25B7%25D0%25B3%25D1%2580%25D0%25B0%25D0%25B4%25D0%25B5%25
D0%25BD%25D0%25B8%25D1%258F%25D1%2582%2B%25D1%258F (Accessed: 7 June 2020).
European Space Agency (2020a) Copernicus Open Access Hub. Available at: https://scihub.copernicus.eu/dhus/#/home (Accessed: 7
June 2020).
European Space Agency (2020b) Sentinel-2 - Missions - Sentinel Online. Available at:
https://sentinels.copernicus.eu/web/sentinel/missions/sentinel-2 (Accessed: 6 June 2020).
Huang, C. et al. (2018) ‘Detecting, Extracting, and Monitoring Surface Water From Space Using Optical Sensors: A Review’,
Reviews of Geophysics, 56(2), pp. 333–360. doi: 10.1029/2018RG000598.
Kaplan, G. and Avdan, U. (2017) ‘Object-based water body extraction model using Sentinel-2 satellite imagery’, European Journal
of Remote Sensing. Taylor & Francis, 50(1), pp. 137–143. doi: 10.1080/22797254.2017.1297540.
QGIS.org (2020). QGIS Geographic Information System. Open Source Geospatial Foundation Project. http://qgis.org
SNAP Tutorials | STEP (no date). Available at: https://step.esa.int/main/doc/tutorials/snap-tutorials/ (Accessed: 7 June 2020).
700Proceedings Vol. 1, 8th International Conference on Cartography and GIS, 2020, Nessebar, Bulgaria
ISSN: 1314-0604, Eds: Bandrova T., Konečný M., Marinova S.
Tuntova, A. (no date) Water Management in Bulgaria.
vesti.bg (2020) Язовир „Огоста“ започна да разкрива тайните на дъното - Фото галерии | Vesti.bg. Available at:
https://www.vesti.bg/galerii/foto/iazovir-ogosta-zapochna-da-razkriva-tajnite-na-dynoto-9288 (Accessed: 7 June 2020).
Wikipeadia (2020) Огоста (язовир) – Уикипедия. Available at: https://bg.wikipedia.org/wiki/Огоста_(язовир) (Accessed: 7 June
2020).
Za vodata (2014) Язовир „Огоста“ – опасният хидрогигант с мистично лице | Za Vodata, Online article. Available at:
https://zavodata.com/2014/01/язовир-„огоста“-–-опасният-хидрогиг/ (Accessed: 7 June 2020).
701You can also read