AGRICULTURAL LAND-USE PATTERN IN RAEBARELI DISTRICT, UTTAR PRADESH: A
←
→
Page content transcription
If your browser does not render page correctly, please read the page content below
© 2018 IJRAR January 2019, Volume 6, Issue 1                www.ijrar.org (E-ISSN 2348-1269, P- ISSN 2349-5138)

  “AGRICULTURAL LAND–USE PATTERN IN
  RAEBARELI DISTRICT, UTTAR PRADESH: A
       GEOGRAPHICAL APPRAISAL”
                                           Dr. Brij Vilas Pandey
                             Associate Professor And Head Of The Department
                             K.S. Saket P.G. College Ayodhya, Faizabad 224123

                                         SAJAL SINGH
                                      RESEARCH SCHOLAR
                                 DEPARTMENT OF GEOGRAPHY
                      K.S. SAKET P.G. COLLEGE AYODHYA, FAIZABAD 224123

Agriculture and land use planning derives the achievement of sustainable livelihoods. Agricultural activities can
transform the lives of people in the respective region through crops, rangelands, animal farms, agriculture and
other agribusiness industries. The rapid increase of human population leads to other changes in land use and
agricultural activities in Indo-Ganga Plain. Urbanization and socioeconomic development on national level
basically changed the agricultural land use pattern in India. Rapid changes adversely effected, however,
integration of technology in agricultural activities has been bringing phenomenal change in this sector. The
challenge for Indian agriculture has achieved higher productivity to satisfy needs on the ground, irrigation and
socioeconomic factors. The agricultural land use patterns and live hood planning are affected by the availability
of water, pressures on land, administration and financial systems of peasants. At present, the agriculture sectors
contribute Over 60 per cent of the rural households depend on agriculture in the country. In addition, it
continues to serve as the main source of living for the rural population; it remains central to the Indian
Economy which employs more than 50 per cent of the total workforce and contributes around 17-18 percent to
the country’s GDP. Land use is also the prime cause of the loss or fragmentation of natural habitats due to
multiple interacting socio - economic factors causing loss of biota due to degradation of natural habitats and
ecosystem. The transformation of agriculture and land use planning would promote to integration of farmers
and their families as actors and participants in the strategic development planning process in the district. Strong
agricultural sector can bring a massive change among common man of India.

Keywords: Sustainable livelihoods, agribusiness industries, habitats, transformation.

Introductions
The history of Agriculture in India dates back to Indus Valley Civilization Era and even before that in some
parts of Southern India. Agriculture is the most important sector of Indian Economy. Indian agriculture sector
accounts for 18 per cent of India's gross domestic product (GDP) and provides employment to 50% of the
countries workforce. Gross Value Added by agriculture and allied activities is estimated at Rs 17.67 trillion

  IJRAR19J1753      International Journal of Research and Analytical Reviews (IJRAR) www.ijrar.org      768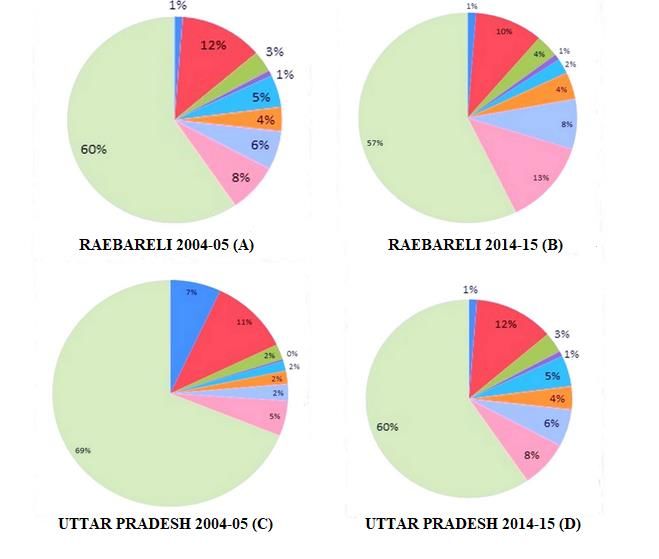
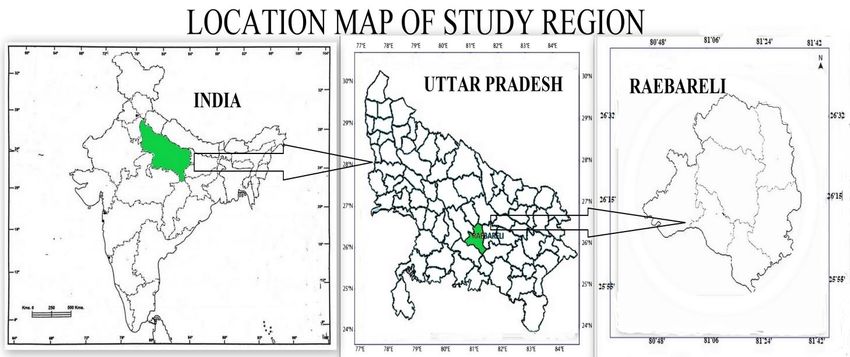
© 2018 IJRAR January 2019, Volume 6, Issue 1                www.ijrar.org (E-ISSN 2348-1269, P- ISSN 2349-5138)

(US$ 274.23 billion) in FY18 (APEDA). The Indian food industry is poised for huge growth, increasing its
contribution to world food trade every year due to its immense potential for value addition, particularly within
the food processing industry. The Indian food and grocery market is the world’s sixth largest, with retail
contributing 70 per cent of the sales. The Indian food processing industry accounts for 32 per cent of the
country’s total food market, one of the largest industries in India and is ranked fifth in terms of production,
consumption, export and expected growth. It contributes around 8.80 and 8.39 per cent of Gross Value Added
(GVA) in Manufacturing and Agriculture respectively, 13 per cent of India’s exports and six per cent of total
industrial investment. Above mention face show data show it is a good symptom of the Indian economy from
the agriculture sector.   Agriculture is ultimate source for food. It is a primary sector, which related to
agriculture, forestry, grazing, fishing and mining, so its conversion of agricultural and non-agricultural land use
development would help to understand the environment, health and economic activities interaction with nature.
The proper use of land would protect our natural environment and frequently considered to solve a local
environmental related issue. The government of India vision of doubling farmer's income by 2022 is worth
serious attention. This ambitious objective could not only improve the well-being of our farmers, but also
planning to improve land use patterns, irrigation facilities, bank loans, machineries Agro-based manufacturing
growth and market center in rural India. There are three chief cropping seasons in district also namely Kharif,
Rabi and Zaid. The major crops of this district are paddy, wheat, sugarcan, pigeon pea, gram, pea and mustard.

LOCATION OF THE STUDY REGION:-

Raebareli lies in the southern part of Uttar Pradesh. The district is irregular in shape, but fairly compact. It
forms a part of the Lucknow Division and lies between Latitude 25° 49' North and 26° 36' North and Longitude
100° 41' East and 81° 34' East. On the north, it is bounded by tehsil Mohanlal Ganj of Lucknow and Haidergarh
of Barabanki, on the east by tehsil Mussafir Khana of district Sultanpur and on the south-east by pargana Ateha
and the Kunda tehsil of district Pratapgarh. The southern boundary is formed by Ganga which separates it from
the district of Fatehpur. On the west lies the Purwa tehsil of Unnao. Rae Bareli is a district in the Uttar Pradesh
State of India.    Administratively the district is divided into 7 sub-division namely Sadar, Unchahar,
Dalmau,Tiloi, Maharajganj, Lalganj and Salon and 21 Development Blocks viz Rahi, Harchandpur ,Sataon,
Amawan, Maharajganj, Bachharawan, Shivgarh, Dalmau, Jagatpur, Unchahar, Lalganj, Khiron, Tiloi, Salon,
Deen shah gaura, Rohania, Singhpur, Bahadurpur, Deeh, Chhatoh and Saraini. There are1776 villages in the
district. Total area of Rae Bareli is 4,609 km² including 4,532.51 km² rural area and 76.49 km² urban area. Rae
Bareli has a population of 34,05,559 peoples. There are 6,19,707 houses in the district. As per live-stock census
1997, the cattle, buffalo, sheep, goat and pig population is 700775, 326366,74194,254175 and 184201,
respectively (Source - District Profile, Krishi Vigyan Kendra, Raebareli) .

  IJRAR19J1753      International Journal of Research and Analytical Reviews (IJRAR) www.ijrar.org      769
© 2018 IJRAR January 2019, Volume 6, Issue 1               www.ijrar.org (E-ISSN 2348-1269, P- ISSN 2349-5138)

Figure – 1

Aim and Objectives Present study intends the following objectives
   1. To analyze the changes of land use pattern between the periods 1997-98 and 2014-15.
   2. To analyze the changes of cropping pattern between the periods 2004-05 and 2017-18.
   3. To analyze the land-use pattern and cropping pattern.

Data Base and Mehodology:
 The present study is based on secondary data collected from Agriculture Informatics Division, National
Informatics Centre, Ministry Of Communication & IT, Govt. Of India, New Delhi., District census and
handbook, Gazetteer Agricultural epitomes, Agricultural statistical information Uttar Pradesh        were also
observed for getting relevant information. In the present investigation, district and state level data are being
utilized Raebareli district of Uttar Pradesh, for 2004 – 05 and 2014-15 to analyses the land use and for
cropping pattern 1997-98 to 2017-18. Simple statistical techniques (percentage and average) are used to
analyses the changing trend in cropping pattern and crop intensity.

                                                       Gross cropped area
                                Crop intensity = ------------------------------- x 100
                                                          Net sown area

  IJRAR19J1753     International Journal of Research and Analytical Reviews (IJRAR) www.ijrar.org     770
© 2018 IJRAR January 2019, Volume 6, Issue 1 www.ijrar.org (E-ISSN 2348-1269, P- ISSN 2349-5138) Land use Pattern The land use classifications mean ding information on land cover, and providing from work to satisfy the basic needs of the community of respective regions. Land classification is based largely on the quality and intensity of the land utilization (Mohammad Ali, 1978). The land use of the reporting area is categorized into nine categories of land use pattern which identify by “The Directorate of Economics and Statistics in the Ministry of Agriculture, Government of India”. These categories are forests, land not available for cultivation (Area Under Non Agricultural Uses & Barren and Unculturable Land), other uncultivated land, excluding fallow land (Permanent Pasture and Other Grazing Land, Land Under Misc. Tree Crops and Groves not Included in Net Area Sown & Culturable Waste Land), fallow land (Fallow Lands Other Than Current Fallows & Current Fallow), and net area sown. Land use /land cover has decreased during the last 10 years due to increasing population. The estimate for the decrease/increase land cove in the Raebareli land use record contains 456338 hectares in 2004-05 to 392045 hectares in 2014-15 (Table N-1). From 2004-05 to 2014-15, the table N. 1 indicates the volume of negative change in forests (-16.00), area under non agricultural uses (-30.86), barren and unculturable land (-9.38), permanent pasture, - other grazing land (-14.54), land under Misc (-60.33), cultural waste land (-6.08) and net sown area (-17.40). Only fallow lands other than current fallows (9.43) and current fallow (45.41) record an increase. Thus, overall decrease in agricultural land use patterns of Raebareli district. The above table explains the agricultural land use of reporting area change in Uttar Pradesh from 2004-05 to 2014-15 was 24201294 hectares to 24170454 hectares. Shrinking net sown area of Uttar Pradesh from 16682926 hectares to 16598043 hectares or -0.50, during the period of investigation. Normal shrinking of net sown area is of great concern to shift of agricultural land towards non-agricultural uses like a settlement for growing populations, infrastructure and raising factories etc. It is clear from the above discussion that net sown area in Raebareli record -17.40 per cent negative change during the periods of 2004-05 - 2014-15. Land use is always related to conservation of land resources. It is not easy to convert urban to agricultural land use, but an unprecedented change in forest regions can manage through human efforts. There is, thus, an urgent need to evolve and adapt land-saving technologies for better utilization of agricultural potentials. IJRAR19J1753 International Journal of Research and Analytical Reviews (IJRAR) www.ijrar.org 771
© 2018 IJRAR January 2019, Volume 6, Issue 1              www.ijrar.org (E-ISSN 2348-1269, P- ISSN 2349-5138)

                              Table - 1 Agricultural Land Use Pattern
                                         (Raebareli & Uttar Pradesh)
Sr.                               Uttar Pradesh         Percentage       Raebareli       Percentage
N          LAND USE                                      Change           Distirct        Change
           PATTERN                                        From                             From
                               2004-05      2014-15      2004-05-     2004-     2014-     2004-05-
                                                         2014-15       05        15       2014-15

 1      Reporting Area for    24201294     24170454        -0.13     456338    392045       -1408
              LUS
 2                             1687777      1658608        -1.72      5717      4802       -16.00
              Forests
 3        Area Under Non       2648503      3045852       15.00       57114     39488      -30.86
         Agricultural Uses
 4          Barren and         529748       461683        -12.84      15087     13671       -9.38
        Unculturable Land
 5     Permanent Pasture,-      63640        65198         2.44       3919      3349       -14.54
       Other Grazing Land
 6       Land Under Misc.      343559       305012        -11.21      22910     9088       -60.33

 7       Culturable Waste      454430       405316        -10.80      17366     16310       -6.08
               Land
 8      Fallow Lands Other     573758       509192        -11.25      27578     30180       9.43
       Than Current Fallows
 9        Current Fallow       1216953      1121550        -7.83      34811     50622       45.41

10        Net Area Sown       16682926     16598043        -0.50     271836    224535      -17.40

(Sr. N. 6)* Land Under Misc. Tree Crops and Groves not Included in Net Area Sown
Source : “The Directorate of Economics and Statistics in the Ministry of Agriculture, Government of India”

                        Agriculture Land Use Distribution
                                      Chart – 1(A,B,C & D)

     IJRAR19J1753   International Journal of Research and Analytical Reviews (IJRAR) www.ijrar.org    772
© 2018 IJRAR January 2019, Volume 6, Issue 1 www.ijrar.org (E-ISSN 2348-1269, P- ISSN 2349-5138)
(Sr. N. 6)* Land Under Misc. Tree Crops and Groves not Included in Net Area Sown
Source : “The Directorate of Economics and Statistics in the Ministry of Agriculture”.
Change in Crops/Cropping pattern
Agriculture is the main occupation of rural people in Raebareli district. The cropping intensity of Raebareli
district is 163.08. The major crops in Raebareli district are Arhar/Tur Bajra, Barley, Gram, Groundnut, Jowar,
Linseed, Maize, Masoor, Onion, Peas & beans, Potato, Rapeseed & Mustard, Rice, Sesamum, Sugarcane, Urad,
and Wheat and horticulture crops such as fruits and vegetables.
Table N.- 2
Crops Crops Crops Crops
Areas Areas Yields Yields
Crops Season (1997-98) (2017-18) Changes 1997-98 2017-18 Changes
Arhar/Tur Kharif 13751 5001 -63.63 8124 4257 -69.76
Bajra Kharif 2987 715 -76.06 3293 807 -75.49
Barley Rabi 5197 1909 -63.27 8129 4351 -46.48
Gram Rabi 9134 5417 -40.69 7416 4999 -32.59
IJRAR19J1753 International Journal of Research and Analytical Reviews (IJRAR) www.ijrar.org 773© 2018 IJRAR January 2019, Volume 6, Issue 1 www.ijrar.org (E-ISSN 2348-1269, P- ISSN 2349-5138)
Groundnut Kharif 2853 1270 -55.49 4500 1262 -71.96
Jowar Kharif 15289 6152 -59.76 14621 4568 -68.76
Linseed Rabi 287 35 -87.8 122 21 -82.79
Maize Kharif 147 97 -34.01 139 237 61.22
Masoor Rabi 81 73 -9.88 68 69 -1.47
Onion Kharif 313 236 -24.6 3222 3093 -4
Peas &
Rabi 4549 2191 -51.84 5072 2675 -47.26
beans
Potato All Year 5453 4280 -21.51 44184 66366 33.42
Rapeseed
Rabi 8261 6723 -18.62 5862 5063 -13.63
&Mustard
Rice Kharif 139897 90875 -35.04 240101 222462 -7.35
Sesamum Kharif 1971 2960 50.18 296 1231 315.88
Sugarcane All Year 4404 2417 -45.12 196454 124563 -36.59
Urad Kharif 18802 13961 -25.75 7642 4341 -43.2
Wheat Rabi 169054 132317 -21.73 324779 444982 37.01
Source : “The Directorate of Economics and Statistics in the Ministry of Agriculture, Government of India”
Chart 2 (A) Changes Of Share Of Area Under Major Copes
Chnages in Harvested Area of Raebareli District
(1997-98 to 2017-18)
60
40
20
0
-20
-40
-60
-80
-100
Source : “The Directorate of Economics and Statistics in the Ministry of Agriculture, Government of India”
IJRAR19J1753 International Journal of Research and Analytical Reviews (IJRAR) www.ijrar.org 774© 2018 IJRAR January 2019, Volume 6, Issue 1 www.ijrar.org (E-ISSN 2348-1269, P- ISSN 2349-5138)
Chart 2 (B) Changes Of Yields of Major Copes
Chnages on Yields of Major Crops Raebareli District
(1997-98 to 2017-18)
80
60
40
20
0
-20
-40
-60
-80
-100
Source : “The Directorate of Economics and Statistics in the Ministry of Agriculture, Government of India”
Rural India basically depends on the amount and stability of agricultural production, as determined by crop
yield and cultivated area, because Agriculture land is crucial for humans because it produced all the types of
biomass and important economic sources. Static data about the Raebareli district show, crops harvested area
decreasing of almost crops except Sesamum. There are three crops’ production growth is positive Wheats,
potatoes & Sesamum and the rest have decreased from 1997-98 to 2014-15.
Intensity of Cropping
Intensity of Cropping pattern of any region depends upon geographical features as soil, climate, rainfall, etc.
Apart from this, it depends on the nature and availability of irrigation facilities. The net sown area has
decreased from 271836 to 224535 hectares in 2004 to 2014-15. The present cropping intensity of Raebareli
District, 163.08 has registered an increase of only 8.6 % from last 20 years.
Conclusions
The present study concludes that in Raebareli district, the wheat & rice cultivation are suggested to sustain
with the adoption of improved HYV and recent technology. The new approach to agricultural development and
land use planning can provide an opportunity to get employment generation, poverty alleviation, community
empowerment and development of other economic activity of the rural areas. The state government, local
community and business houses should establish a public policy framework to support new agricultural
economic era development. After the analysis of land-use and land-cover changes district main cause are fall
under the following categories: population, technology, political economy, political structure, and attitudes and
IJRAR19J1753 International Journal of Research and Analytical Reviews (IJRAR) www.ijrar.org 775© 2018 IJRAR January 2019, Volume 6, Issue 1 www.ijrar.org (E-ISSN 2348-1269, P- ISSN 2349-5138)
values. The agricultural sector is indispensable for the Raebareli district, since the existing policy need to focus
on protection and conservation farmers and promote sustainable developments.
References and Bibliography
1. Abani, k. Bhagabatti. (1993): “Agricultural development in Assam”, annals of the national association
of geographers, India. Vol, 13, No.2. 19-28.
2. Das M.M. 1981): Land use Pattern in Assam, Geographical Review of India. Vol. 43 No.3 Calcutta
pp-43-44.
3. Chandna, R. C. (2007), “Geography of Population - Concepts, Determinants and Patterns, Kalyani
Publishers, New Delhi
4. Hussain Majid (1996), “Systematic Agricultural Geography” Tata McGraw –Hill Publication New
Delhi, pp 256-264.
5. Primary Census Abstract (2001), Registrar General of India and Census Commissioner, New Delhi.
6. Primary Census Abstract (2011), Registrar General of India and Census Commissioner, New Delhi.
7. R.P. Singh (1967) “Concept of Landuse”, Patna University Journal, Vol.22, pg. 52- 62.
8. Weaver J.C.,(1954), “ Crop Combination Region in Middle West”, Geographical Review, Vol. XLIV,
1954,pp, 175-20.
IJRAR19J1753 International Journal of Research and Analytical Reviews (IJRAR) www.ijrar.org 776You can also read