WINNERS AND LOSERS: THE 2020 CENSUS AND CALIFORNIA'S 2021 REDISTRICTING
←
→
Page content transcription
If your browser does not render page correctly, please read the page content below
WINNERS AND LOSERS:
THE 2020 CENSUS AND
 CALIFORNIA’S 2021
  REDISTRICTING
Abstract        The 2020 Census will determine the lines of the 2021’s Congressional, Senate, and
                 Assembly Districts. Using new county and assembly district level data population
                 estimates, this study projects the major demographic shifts in California between
                 2010 and 2020. This study examines these transitions along regional lines, as
                 California’s population center continues to shift    and representation follows.
  Contributors

                 Douglas Johnson ‘92, Ph.D.
                 Christopher Skinnell ‘99, J.D.
                 Darryl Wold ‘63, J.D.
                 Rachel Alaynick ‘20
                 Phillip Williams ‘22
                 Adhitya Venkatraman ‘22
                 Jacob Leischner ‘21
                 Lindsay Burton ‘19
                 Elena Castellanos ‘21
                 Katherine Adelman ‘21
Advisory

                 Douglas Johnson ‘92, Ph.D.
 Board

                 Christopher Skinnell ‘99, J.D.
                 Darryl Wold, ‘63 J.D.
                 Andrew Busch, Ph.D.
                 Ryder Todd Smith ‘96
                 Marguerite Leoni, J.D.
                 Deborah Gonzalez ‘85, J.D.
  Contact

                                      Rose Institute of State and Local Government
                      Kravis Center, Fourth Floor, 850 Columbia Ave. Claremont, CA 91711-6420
                                  E: roseinstitute.org/ F: 909.607.4288/T: 909. 621.8159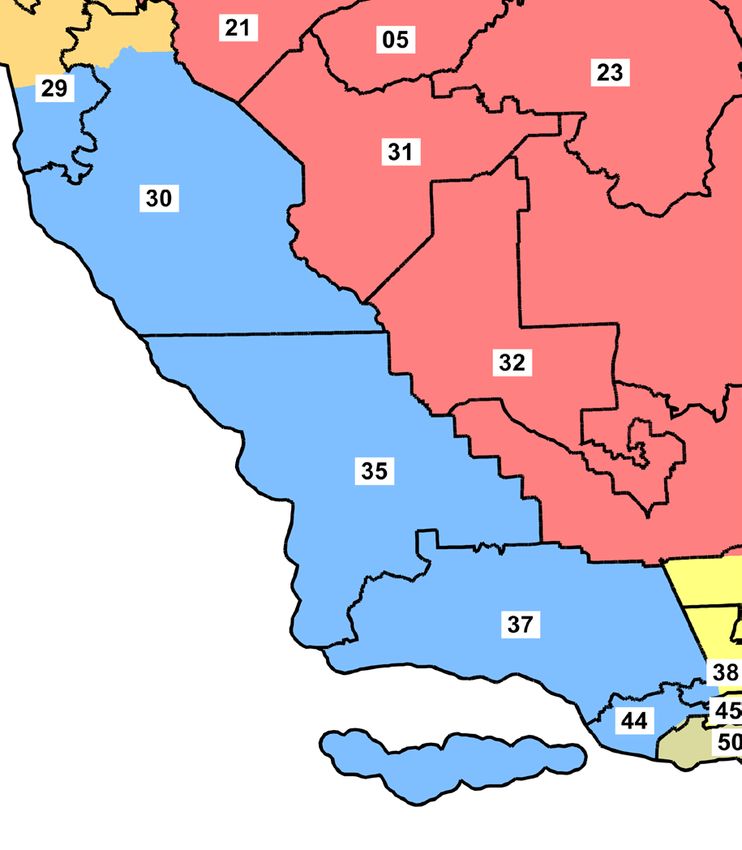
Table of Contents
Acknowledgments                                           4

Overview                                                  5

Statewide Overview                                        8

Regional Analysis - The Far North                         10

Regional Analysis - San Francisco Bay Area                12

Regional Analysis - Central Coast                         14

Regional Analysis - Central Valley                        16

Regional Analysis - Southern California                   18

Regional Analysis - Los Angeles (Westside)                20

Regional Analysis - Los Angeles (Downtown/Gateway)        21

Regional Analysis - Los Angeles (San Gabriel)             22

Regional Analysis - Los Angeles (San Fernando/Antelope)   24

Conclusion                                                26

Methodology                                               27
Acknowledgements   This report continues the Rose Institute’s     Assistant Marionette Moore for their
                   long tradition of analyzing California’s       encouragement and support.
                   population trends and their consequences
                   for redistricting.                             Caveat on population figures in this
                                                                  report: The population figures in this
                   The report would not have been possible        report are not the official census count
                   without our dedicated student research         that will be taken in 2020, and on
                   team. The Rose Institute provides              which final redistricting plans will be
                   hands-on policy research experience for        based. While the Rose Institute believes
                   the students of Claremont McKenna              the figures in this report are reliable
                   College, and students made essential           indicators of actual populations in 2020,
                   contributions at all stages of this project.   they are based on preliminary counts and
                                                                  projections, and are subject to change in
                   We wish to thank the generous donors           the official census. For more information,
                   who have financially supported the             see the Data and Methodology section at
                   Rose Institute’s redistricting research        the end of this report.
                   program. In particular, we are grateful
                   to the members of the Rose Institute
                   Board of Governors, who have provided
                   consistent support and encouragement.

                   Our current redistricting research builds
                   on the accomplishments of the Rose
                   Institute’s founder, Dr. Alan Heslop,
                   and the late Dr. Leroy Hardy, former
                   co-director (with Dr. Heslop) of our
                   redistricting research program. Their
                   work established the Rose Institute
                   as a leader in the redistricting field. A
                   generation of redistricting researchers
                   and technicians, the authors included,
                   owe our knowledge to these pioneers of
                   redistricting research and analysis.Finally,
                   we owe a special thanks to Rose Institute
                   Director Dr. Andrew Busch, Associate
                   Director Dr. Ken Miller, Assistant
                   Director for Research and Publications
                   Bipasa Nadon, and Administrative

                                                                                                               4
Overview
This Rose Institute study forecasts the relative 2010 to 2020 shifts in population between
different areas of California, and the likely effects of those shifts on legislative and
congressional representation.
In 2021, California will draw new state legislative and congressional districts based on
official data from the 2020 census. The census will be taken on April 1, 2020, and final
results are expected by March 31, 2021. Using those official figures, the California
Citizens Redistricting Commission will propose district lines for the state legislature,
congressional delegation, and the Board of Equalization. The plans are required to
contain an equal number of persons in each district. The new maps will reflect the
relative shifts in populations between various areas in the state, and the state’s projected
loss of one congressional seat. The 2022 elections will be the first to use the new district
lines.
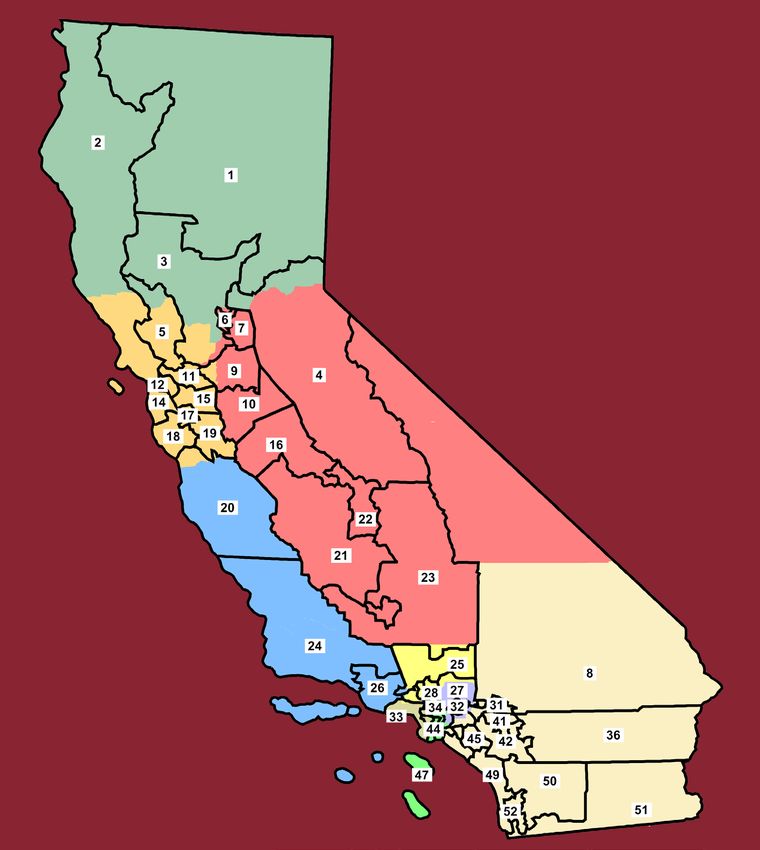
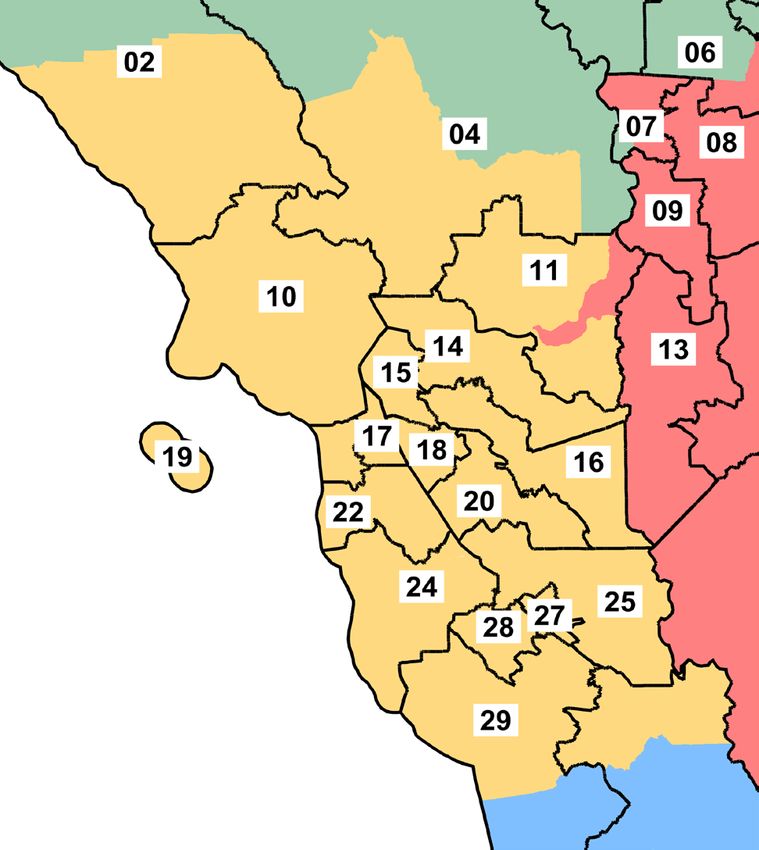
For this analysis, we divided California into nine regions:
1. Far North 5. Southern 9. LA San Fernando/Antelope
2. San Francisco Bay Area 6. LA Westside Valley
3. Central Coast 7. LA Downtown/Gateway
4. Central Valley 8. LA San Gabriel Valley
5
Overview   Statewide, we project California’s 2020 population will be 8.7 percent larger than the
           2010 population, crossing the 40 million mark to 40,506,274. But different regions have
           grown at significantly different rates: San Francisco Bay Area (11.9 percent growth) and
           the Southern region (10.7 percent growth) grew the fastest. Los Angeles County’s San
           Gabriel Valley (4.6 percent growth) and Los Angeles County’s Downtown/Gateway
           region (3.9 percent growth) grew the slowest. Slower-growing regions are likely to lose
           representation, as representation follows population into the faster growing regions.

           In five of the nine regions, population growth was close enough to the statewide average
           that those regions are unlikely to gain or lose representation, though each may lose a
           small portion of a congressional district as their contribution to the state’s overall loss
           of a district. These five ‘average growth’ regions are the Far North, Central Coast,
           Central Valley, LA Westside, and LA San Fernando/Antelope Valley.

           The Southern region’s population growth is expected to shield it from a loss of
           congressional representation, despite the state’s overall loss of a district. And the region’s
           growth should lead to a gain of nearly half (0.4) of an additional Assembly district and
           one-fifth (0.2) of a State Senate district.

           The fast-growing San Francisco Bay Area is the only region expected to gain congressional
           representation, even with the expected statewide loss of a congressional district. The
           Bay Area can also expect to gain half an Assembly district and one-fifth of a State
           Senate district.

           The gains in the Bay Area and Southern regions come almost entirely at the expense
           of LA’s San Gabriel Valley and Downtown/Gateway regions. Combined, the two
           neighboring regions should expect to lose one-third of an Assembly district, half a State
           Senate district, and half a congressional district.

           In the San Gabriel and Downtown/Gateway regions, current congressional districts 27,
           32, 38 and 40 appear to be most at risk of becoming the district California loses in 2021.
           All four of those districts are represented by Latino or Asian-American Members of
           Congress. Traditionally in California, seats held by Latino, African-American, or Asian-
           American representatives were relatively protected by the Federal Voting Rights Act,
           with their districts pushing east or west to pick up the population needed -- at the
           expense, in the past, of the Republican-held seats on the edges of Los Angeles County.
           But the 2018 Democratic wave essentially swept Republicans out of the County and
           Orange County is entirely represented by Democrats. Unless Republicans pick up a seat
           in the area in the 2020 election, California’s lost seat is likely to be a Democratic one.

                                                                                                            6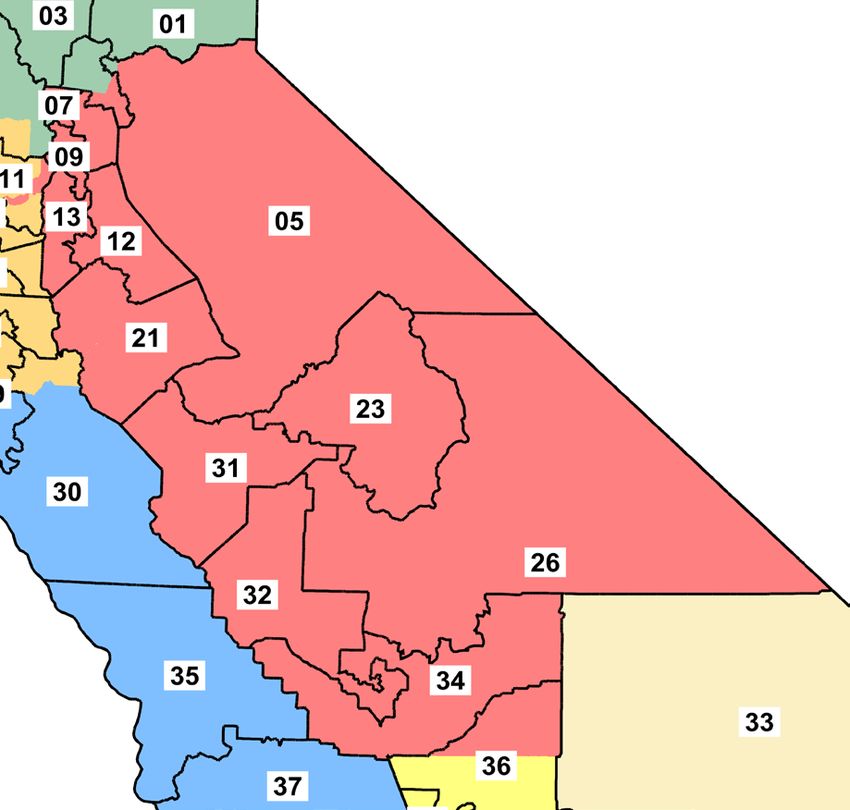
Overview
    California’s history has shown that politics and partisan gerrymandering can significantly
    affect the ultimate distribution of representation. The role of California’s new
    Independent Redistricting Commission is designed to limit partisan gerrymandering.
    The 2011 IRC showed some success and some failures at achieving that goal. Clever
    demographers, armed with detailed voting history and social patterns and computers,
    have at times achieved unexpected outcomes. Slices of districts can divide up a region
    to absorb its population. Or a city can be tied into a distant district to bolster the distant
    district’s population to manipulate redistricting to avoid the representation changes
    seemingly dictated by population shifts.Those regions expecting gains will need to
    work to ensure full and accurate census counts and fair treatment by the Independent
    Redistricting Commission, while those areas expecting to lose representation may
    improve their situations through higher census participation levels and/or effective
    lobbying of the Commission.

7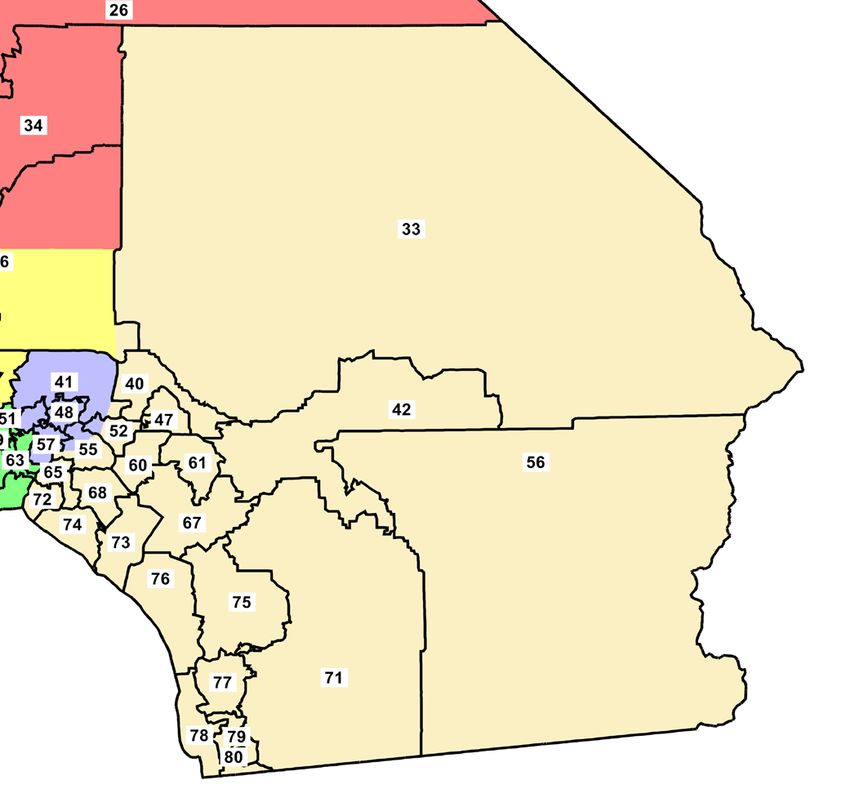
Regional Analysis   THE FAR NORTH
                                                                                The Far North has experienced low
                                                                                growth relative to the other regions. The
                                                                                total population in 2021 is projected to be
                                                                                1,862,884, an increase of 95,467 people
                                                                                over the past 10 years. The Far North’s
                                                                                population change is uneven, with 50%
                                                                                of its counties losing residents. Within
                                                                                the region, Placer County is growing
                                                                                the most, while Sierra County is losing
                                                                                residents. Tables 2 and 3 highlight the
                                                                                expected seats in the Far North based
                                                                                on population and the population
                                                                                breakdown by county. Due to the region’s
                                                                                relatively low growth, the Far North is in
                                                                                danger of losing Assembly, State Senate,
                                                                                and congressional seats in 2021.
                                              Map 1. Congressional Districts

                    Table 2. Expected Seats in the Far North

                       Far North      2011 Expected                                                             2021 Expected
                                                                               Actual 2011
                         Seats        by Population                                                             by Population

                                                            Whole               Majority
                                                                                             Sliver Districts
                                                            Districts           Districts

                        Assembly            3.8                 2                  2.6              2                3.7

                       State Senate         1.9                 0                  3                2                1.8

                        Congress            2.5                 1                  2                3                2.4

                                                                                                                                8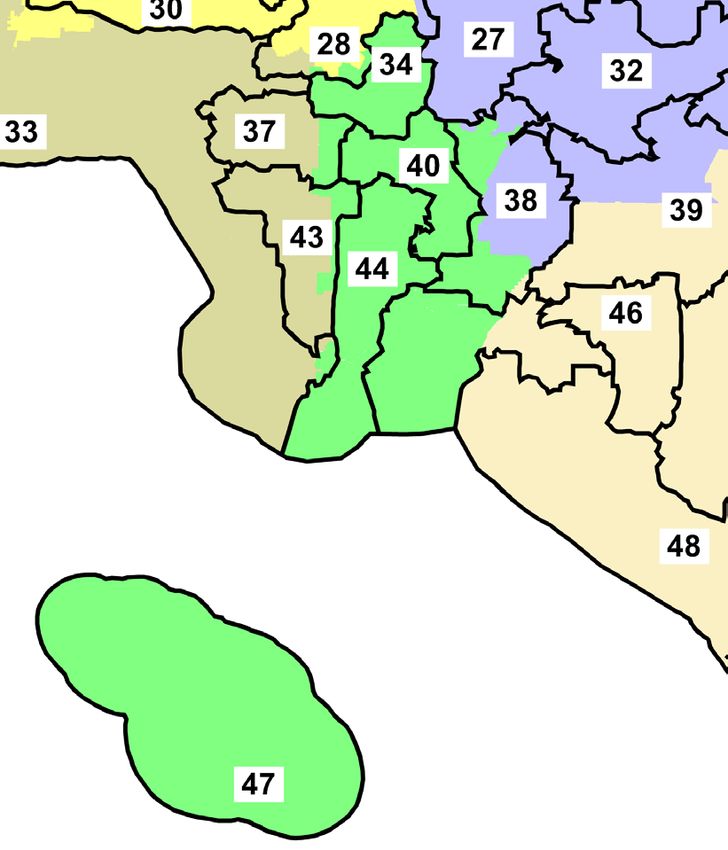
Regional Analysis
                              Map 2. Assembly Districts                     Map 3. State Senate Districts

    Table 3. Far North Population by County
                                                 Projected
     Far North County    Population 2010                        Total Change       Percent Change
                                              Population 2020
          Sierra              3,240                2,733            -507                -15.7%
        Humboldt             134,623              137,667          3,044                  2.3%
         Siskiyou            44,900                42,943          -1,957                -4.4%
          Plumas             20,007                18,174          -1,833                -9.2%
        Mendocino            87,841                88,094           253                   0.3%
          Lassen             34,895                30,002          -4,893                -14%
        Del Norte            28,610                26,941          -1,669                -5.8%
          Glenn              28,122                27,855           -267                 -0.9%
           Butte             220,000              233,277          13,277                 6.0%
          Nevada             98,764               100,264          1,500                  1.5%
          Modoc               9,686                 8,730           -956                 -9.9%
          Trinity            13,786                12,716          -1,070                -7.8%
         Tehama              63,463                63,154           -309                 -0.5%
          Shasta             177,223              181,077          3,854                  2.2%
           Yolo              200,849              226,945          26,096                 13%
           Lake              64,665                64,066           -599                 -0.9%
          Colusa             21,149                21,505           86                    0.4%
          Sutter             94,737                97,467          2,730                  2.9%
           Yuba              72,155                79,121          6,966                  9.7%
          Placer             348,432              402,338          53,906                15.5%

9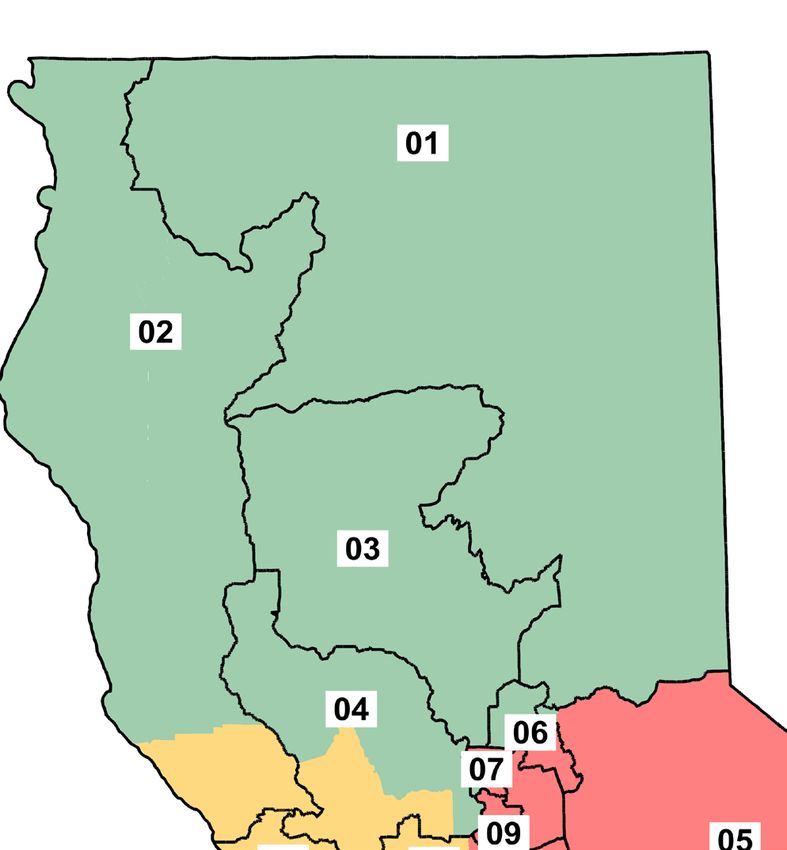
Regional Analysis   SAN FRANCISCO BAY AREA
                                                                                    The San Francisco Bay Area is
                                                                                    experiencing the most growth
                                                                                    relative to other regions, suggesting
                                                                                    that the region may gain an
                                                                                    additional Assembly district. In the
                                                                                    State Senate, population projections
                                                                                    indicate the region’s expected Senate
                                                                                    seats will increase from 8.0 to 8.2,
                                                                                    but this growth will likely not be
                                                                                    enough for an entire additional
                                                                                    seat. The number of congressional
                                                                                    seats for the San Francisco Bay
                                                                                    Area is expected to increase to 10.7,
                                                                                    which should protect its current
                                                                                    congressional delegation.

                                                  Map 4. Congressional Districts

                    Table 4. Expected Seats in the San Fransico Bay Area

                      SF Bay Area    2011 Expected                                                             2021 Expected
                                                                             Actual 2011
                         Seats       by Population                                                             by Population

                                                           Whole               Majority
                                                                                            Sliver Districts
                                                           Districts           Districts

                       Assembly            15.9               13                                   3               16.4

                      State Senate         8.0                 6                   1               2                8.2

                        Congress           10.5                8                   1               4               10.7

                                                                                                                               10
Regional Analysis
Map 5. Assembly Districts Map 6. State Senate Districts
Table 5. San Fransico Bay Area Population by County
Population Projected Population
SF Bay Area Counties Total Change Change
2010 2020
San Francisco 805,235 918,275 113,040 14%
Santa Cruz 262,382 281,689 19,307 7.4%
San Mateo 718,451 794,107 75,656 10.5%
Marin 252,409 264,618 12,209 4.8%
Alameda 1,510,271 1,728,727 218,456 14.5%
Sonoma 483,878 512,934 29,056 6%
Santa Clara 1,781,642 2,005,229 223,587 12.5%
Solano 413,344 459,221 45,877 11.1%
Napa 136,484 142,897 6,413 4.7%
Contra Costa 1,049,025 1,189,616 140,591 13.4%
11Regional Analysis CENTRAL COAST
The Central Coast is growing
slightly slower than the state as a
whole, putting the region at risk
of losing seats. In 2021, the region
is expected to slip from 4.3 to 4.2
Assembly districts. The State Senate
should stay at 2.1 seats, while the
congressional delegation is expected
to contract from 2.8 to 2.7 districts.
Map 7. Congressional Districts
Table 6. Expected Seats in the Central Coast
Central Coast 2011 Expected 2021 Expected
Actual 2011
Seats by Population by Population
Whole Majority
Sliver Districts
Districts Districts
Assembly 4.3 2 2 3 4.2
State Senate 2.1 1 1 2 2.1
Congress 2.8 1 2 2 2.7
12Regional Analysis
Map 8. Assembly Districts Map 9. State Senate Districts
Table 7. Central Coast Population by County
Projected
Central Coast Counties Population 2010 Total Change Percent Change
Population 2020
Santa Barbara 423,895 458,545 34,650 8.2%
San Benito 55,269 60,129 4,860 8.8%
Monterey 415,057 447,700 32,643 7.9%
San Luis Obispo 269,637 289,306 19,669 7.3%
Ventura 823,318 867,468 44,150 5.4%
13Regional Analysis CENTRAL VALLEY
Seats in the Central Valley are
projected to remain constant.
The region is unlikely to gain or
lose Assembly, State Senate, or
congressional seats. But with large
immigrant and other “Hard to
Reach” populations, the region will
need to work to ensure an accurate
census count and full representation
in redistricting.
Map 10. Congressional Districts
Table 8. Expected Seats in the Central Valley
Central Valley 2011 Expected 2021 Expected
Actual 2011
Seats by Population by Population
Whole Majority
Sliver Districts
Districts Districts
Assembly 12.4 10 2 3 12.4
State Senate 6.2 3 2 4 6.2
Congress 8.2 5 5 1 8.1
14Regional Analysis
Map 11. Assembly Districts Map 12. State Senate Districts
Table 9. Central Valley Population by County
Projected
Central Valley Counties Population 2010 Total Change Percent Change
Population 2020
Alpine 1,175 1,215 40 3.4%
Mono 14,202 13,996 -206 -1.4%
Inyo 18,546 18,045 -501 -2.7%
Tuolumne 55,365 53,271 -2,094 -3.8%
Mariposa 18,251 17,404 -847 -4.6%
Amador 38,091 36,907 -1,121 -2.9%
Fresno 930,450 1,014,457 84,007 9%
Sacramento 1,418,788 1,578,541 159,753 11.3%
Tulare 442,179 474,056 31,877 7.2%
El Dorado 181,058 192,385 11,327 6.3%
Stanislaus 514,451 562,234 47,783 9.3%
Kings 152,982 148,866 -4,116 -2.7%
Kern 839,631 916,042 76,411 9.1%
Merced 255,793 279,907 24,114 9.4%
Calaveras 45,578 44,834 -744 -1.6%
Madera 150,865 159,472 8,607 5.7%
San Joaquin 685,308 771,188 85,880 12.5%
15Regional Analysis SOUTHERN CALIFORNIA
Southern California is experiencing high
rates of growth, primarily in Riverside
County, relative to other regions. Because
this region’s districts are largely contained
within the fast-growing region, it is likely
that the region is not vulnerable to losing
a seat based on population, but the region
may have to work to prevent Los Angeles
County poaching population to bolster its
own districts.
Map 13. Congressional Districts
Table 10. Expected Seats in the Southern California
Southeastern
2011 Expected 2021 Expected
California Actual 2011
by Population by Population
Seats
Whole Majority
Sliver Districts
Districts Districts
Assembly 22.6 22 2 2 23
State Senate 11.3 8 4 2 11.5
Congress 14.9 12 2 3 14.9
16Regional Analysis
Map 14. Assembly Districts Map 15. State Senate Districts
Table 11. Southern California Population by County
Southern California Projected
Population 2010 Total Change Percent Change
Counties Population 2020
San Diego 3,095,313 3,441,559 346,246 11.2%
Orange 3,010,229 3,267,616 257,387 8.6%
Imperial 174,528 186,388 11,860 6.8%
San Bernardino 2,035,210 2,209,773 174,563 8.6%
Riverside 2,189,641 2,523,391 333,750 15.2%
17Regional Analysis LOS ANGELES - WESTSIDE
The Westside is experiencing relatively
average growth and is not expected to
gain or lose any seats. However, the region
did not receive as many seats as expected
in 2011, as the Downtown/Gateway
cities area used Westside population to
fill out the Downtwon/Gateway districts.
The region faces similar challenges
from Ventura and the Downtown/
Gateway area in the 2021 redistricting.
Map 16. Congressional Districts
Table 12. Expected Seats in Los Angeles - Westside
Los Angeles - 2011 Expected 2021 Expected
Actual 2011
Westside Seats by Population by Population
Whole Majority
Sliver Districts
Districts Districts
Assembly 4.0 4 0 1 3.9
State Senate 2.0 0 2 2 1.9
Congress 2.7 0 3 2 2.5
18Analysis
Regional
Regional Analysis
Map 17. Assembly Districts Map 18. State Senate Districts
Table 13. Los Angeles - Westside Population by Assembly District
Los Angeles - Westside Projected
Population 2010 Total Change Percent Change
Assembly Districts Population 2020
44 8,270 8,635 365 4.4%
50 470,048 497,836 27,788 5.9%
54 466,314 492,570 26,256 5.6%
62 466,844 487,471 20,627 4.4%
66 467,745 483,448 15,703 3.4%
19Regional Analysis LOS ANGELES - DOWNTOWN/GATEWAY
The Downtown/Gateway region is doubly at
risk of losing seats with relatively low population
growth rates and a large “Hard to Reach”
population. The result is a significant risk of
losing seats. With a full count, the region should
go from 7.0 to 6.7 Assembly districts and see
similar drops in Senate and congressional districts
- with larger losses if Census participation is low.
Map 19. Congressional Districts
Table 14. Expected Seats in Los Angeles - Downtown/Gateway
2011 2021 Expect-
LA Downtown/
Expected by Actual 2011 ed by Popula-
GatewaySeats
Population tion
Whole Majority
Sliver Districts
Districts Districts
Assembly 7.0 7 0 0 6.7
State Senate 3.5 1 2 3 3.3
Congress 4.6 2 2 5 4.3
20Regional Analysis
Map 20. Assembly Districts Map 21. State Senate Districts
Table 15. Los Angeles-Downtown/Gateway Population by Assembly District
Los Angeles -
Projected
Downtown/ Gateway Population 2010 Total Change Percent Change
Population 2020
Assembly Districts
51 465,643 474,537 8,894 1.9%
53 463,916 492,547 28,631 6.2%
58 468,258 483,399 15,141 3.2%
59 465,168 475,990 10,822 2.3%
63 461,153 476,093 14,940 3.2%
64 466,400 499,242 32,842 7%
70 468,514 484,975 16,461 3.7%
21Regional Analysis LOS ANGELES - SAN GABRIEL
San Gabriel is experiencing the slowest
growth relative to other regions,
foreshadowing decreases in expected
seats across the board. Of its expected
4.4 Assembly seats in 2011, San Gabriel
received 3 whole districts, 1 majority
district, and 2 sliver districts. Looking
forward to 2021, the region’s expected
Assembly seat count is expected to fall
to 4.3. For the State Senate, the region
expects a drop from 2.2 to 2.1 seats in
2021. Finally, San Gabriel was expected
to receive 2.9 congressional districts in
2011, but received only 1 whole district, 2
majority districts, and 3 sliver districts. In
Map 22. Congressional Districts
2021, San Gabriel is expected to have 2.8
congressional seats. In each category, San Gabriel is at risk of losing seats because of
its relatively slow growth and the pressure from surrounding regions.
Table 16. Expected Seats in Los Angeles - San Gabriel
Los Angeles - San 2011 Expected 2021 Expected
Actual 2011
Gabriel Seats by Population by Population
Whole Majority
Sliver Districts
Districts Districts
Assembly 4.4 3 1 2 4.3
State Senate 2.2 1 2 2 2.1
Congress 2.9 1 2 3 2.8
22Regional Analysis
Map 23. Assembly Districts Map 24. State Senate Districts
Table 17. Los Angeles - San Gabriel Population by Assembly District
Los Angeles - San
Population Projected
Gabriel Assembly Total Change Percent Change
2010 Population 2020
Districts
41 364,993 382,890 17,897 4.9%
48 461,346 483,745 22,399 4.9%
49 462,545 482,626 20,081 4.3%
52 149,602 156,316 6,714 4.5%
55 167,827 173,075 5,248 3.1%
57 465,845 488,081 22,236 4.8%
23Regional Analysis LOS ANGELES-SAN FERNANDO/ANTELOPE
Within Los Angeles, the San Fernando and
Antelope Valleys are growing at essentially
the same rate as the state as a whole. The
total population in 2021 is projected to be
2,786,844, which represents an increase
of 178,670 people over the past 10 years.
The region is likely not in danger of losing
any seats, as the expected seat counts
in 2011 and 2021 differ marginally, but
there may be pressure on the districts
from efforts to pressure the San Gabriel
Valley and/or Downtown districts.
Map 23. Congressional Districts
Table 18. Expected Seats in Los Angeles - San Fernando/Antelope Volleys
Los Angeles -
2011 Expected 2021 Expected
San Fernando/ Actual 2011
by Population by Population
Antelope Seats
Whole Majority
Sliver Districts
Districts Districts
Assembly 5.6 3 3 0 5.5
State Senate 2.8 1 1 3 2.8
Congress 3.7 1 3 3 3.6
24Regional Analysis
Map 23. Assembly Districts Map 24. State Senate Districts
Table 17. Los Angeles-San Fernando/Antelope Valleys Population by Assembly District
Los Angeles - San
Projected
Fernando/ Antelope Population 2010 Total Change Percent Change
Population 2020
Assembly Districts
36 400,571 415,614 15,043 3.8%
38 342,617 367,896 72,997 21.3%
39 466,422 472,903 6,481 1.4%
43 468,406 491,731 23,325 5%
45 465,717 525,088 59,371 12.7%
46 464,441 513,612 49,171 10.6%
25Conclusion The 2021 redistricting will reorder California’s legislative and congressional districts to
reflect population shifts from 2010 to 2020. Southern California and San Francisco Bay
Area will likely gain representation, while the San Gabriel and Downtown/ Gateway
regions of LA County will likely lose represenation.
These population projections are based on current population estimates from the Census
Bureau’s 2017 American Community Survey. The predicted results could change based
on last-minute population shifts or from regional variations in Census participation rates.
Regions that fail to generate a complete 2020 Census count face both the loss of federal
dollars and a loss of representation.
26This Rose Institute report relies on demographic data compiled by the U.S. Census Bureau in its
Methodology
annual ACS. The Rose Institute used the following process to project population and seat counts in
2020.
Population Projection Methodology:
1. Researchers divided California by county and (in LA County) by Assembly district into 9 regions:
the Far North, Central Coast, SF Bay Area, Southern, Central Valley, LA - Westside, LA - San Ga-
briel, LA - San Fernando/Antelope, and LA - Downtown/Gateway.
2. For the first five regions, researchers gathered county population totals for each year 2010 - 2017.
The 2010 county population count came from the decennial Census. 2011 - 2017 came from the
American Community Survey 1-year estimates.
3. Researchers calculated the growth per year for each county from 2010 to 2017 by taking the dif-
ference in population per year.
4. Researchers averaged the annual growth by taking the growth per year and dividing by the total
number of years.
5. Researchers multiplied the average annual growth by 3 to calculate the projected growth for the
3-year period between the most recent 2017 ACS data and the 2020 Census.
6. Researchers added the projected 3-year growth to the 2017 American Community Survey estimate
for each county to calculate the expected population in 2020.
7. For the LA regions, researchers repeated the same process using American Community Survey
5-year estimate data from 2011 - 2015 and the 2010 decennial Census data.
Seat Count Methodology:
1. Using the projected statewide population total, researchers divided that number by 40 to get the
population per State Senate seat, by 80 to get the population per Assembly seat, and by 52 to get the
population per congressional seat.1
2. Researchers then divided each region’s projected population count by the expected population per
Senate, Assembly, and congressional seats to get the expected seats per region.
1
Election Data Services, “2018 Reapportionment Analysis.” December 19, 2018. https://www.elec-
tiondataservices.com/wp-content/uploads/2018/12/NR_Appor18.pdf; Polidata, “Apportionment
For 2020, Based Upon 2018 Estimates with Projections.” December 19, 2018. http://www.polidata.
org/news.htm#20181219a
27To learn more about the Rose Institute’s research and publications, view our website at
http://roseinstitute.org/, follow us on Twitter @RoseInstitute, or contact us at:
Rose Institute of State and Local Government
Claremont McKenna College
Kravis Center, Fourth Floor,
850 Columbia Ave.
Claremont, CA 91711
Phone: 909.621.8159
28You can also read