2Q21 White Settlement ISD - District Demographics Update
←
→
Page content transcription
If your browser does not render page correctly, please read the page content below
White Settlement ISD
  District
Demographics
  Update
               2Q21

                 Solutions Through Demographics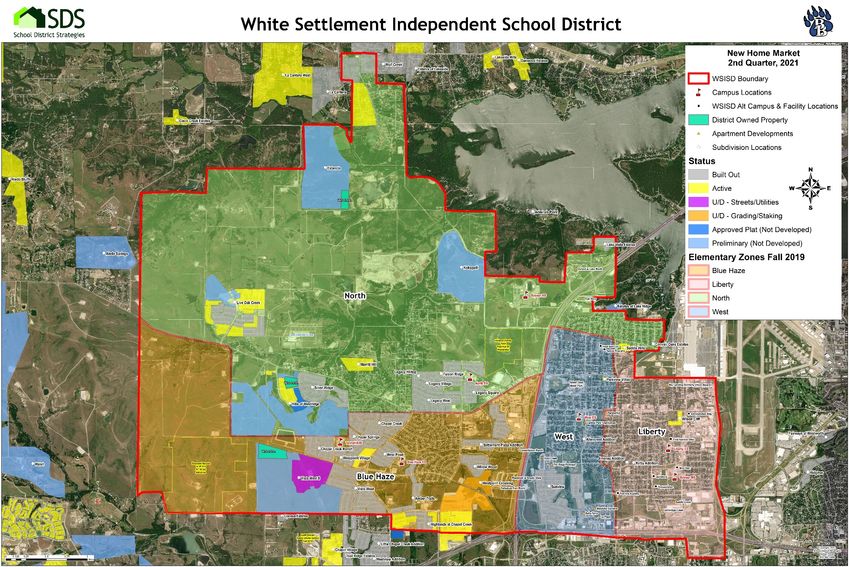
DFW: NEW HOME STARTS, CLOSINGS &
          LOT DELIVERIES
                60,000
                                         Annual Starts: 57,233 (+43.0% YoY)
                55,000                  Annual Closings: 45,079 (+18.5% YoY)
                50,000                   Lot Deliveries: 49,481 (+17.8% YoY)
                45,000
                40,000
                                              Current Cycle
  Annual Rate

                35,000
                30,000
                25,000
                20,000
                15,000
                10,000
                 5,000
                    0
                            2
                            3
                            4
                            2
                            3
                            4
                            2
                            3
                            4
                            2
                            3
                            4
                            2
                            3
                            4
                            2
                            3
                            4
                            2
                            3
                            4
                            2
                            3
                            4
                            2
                            3
                            4
                            2
                            3
                            4
                            2
                            3
                            4
                            2
                            3
                            4
                            2
                            3
                            4
                            2
                            3
                            4
                            2
                            3
                            4
                            2
                         2006

                         2007

                         2008

                         2009

                         2010

                         2011

                         2012

                         2013

                         2014

                         2015

                         2016

                         2017

                         2018

                         2019

                         2020

                         2021
                               Starts         Closings        Lot Deliveries

Ø DFW homebuilders produced another record level of home starts in 2Q21 with
  just over 15,000 starts generated. For the year, builders have already produced
  over 30,000 starts, and the annual start pace has climbed to an all-time high of
  57,233 starts.                                                                     2
DFW HOUSING MARKET—2021 FIRST HALF DEMAND SURGE
1Q21-2Q21 Focused on Dealing           Repercussions from the Buyer Wave
with Wave of Buyer Demand              • Lack of material/labor causes
                                          direct construction costs to surge
•   Record decline in mortgage            by 20%+
    rates creates flood of buyers      • Builders aggressively raise new
•   Components of demand:                 home prices to keep up with costs
                                            – $50-60K increases in base prices
     Ø First-time Millennial buyers           commonplace
     Ø Renters thwarted by                  – Some builders see squeezed margins
       affordability                   •   Unable to process all of the new
     Ø Relocation buyers                   sales, many neighborhoods placed
     Ø Those unable to find existing       on allocation in late-Spring
       home listings                   •   Many adopt a ‘spec and release’
•   Demand far outpaces                    approach to new home sales
                                            – Build-to-suit contracts push price
    construction capacity                     increases back to purchaser
     – FV Inventory snapped up         •   Lot deliveries unable to keep up
     – Annual Starts surge 43% to          with starts, month supply falls
       record 57,233 pace              •   Cycle Times elongated

                                                                                   3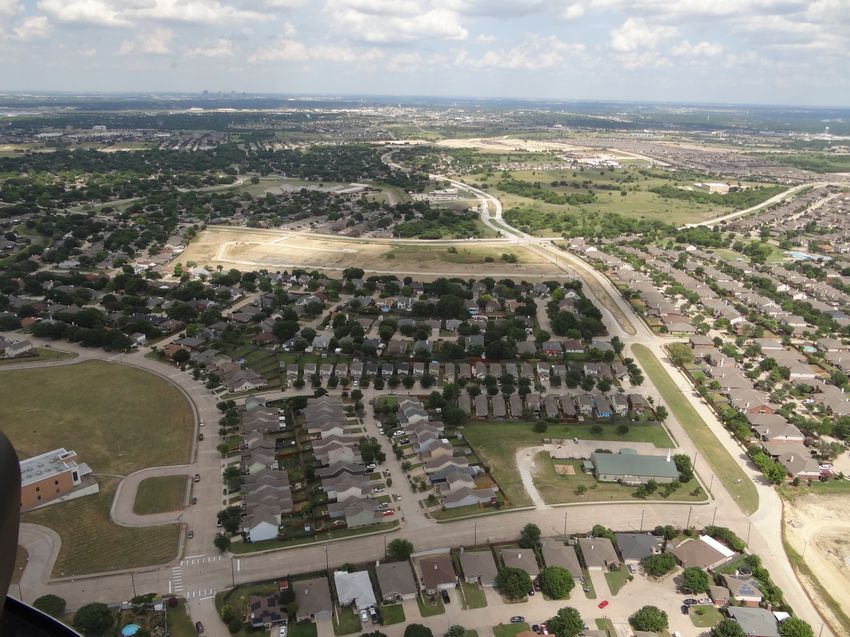
30-YEAR MORTGAGE RATE
          7

                                                                                                  July 29, 2021
         6.5
                                                                                                    30YR : 2.80%
                                                                                                    15YR : 2.10%
          6                                                                                       1YR ARM : 2.45%

         5.5

          5
Rate %

         4.5

          4

         3.5

                                                                                Housing Market Accelerates as
          3
                                                                                30-year rate drops under 3.0%
                      Source: Freddie Mac                                      Record Low on 1/7/21 at 2.65%
         2.5
               2008

                          2009

                                   2010

                                            2011

                                                   2012

                                                          2013

                                                                 2014

                                                                        2015

                                                                               2016

                                                                                      2017

                                                                                               2018

                                                                                                       2019

                                                                                                                2020

                                                                                                                       2021
                                                                                                                              4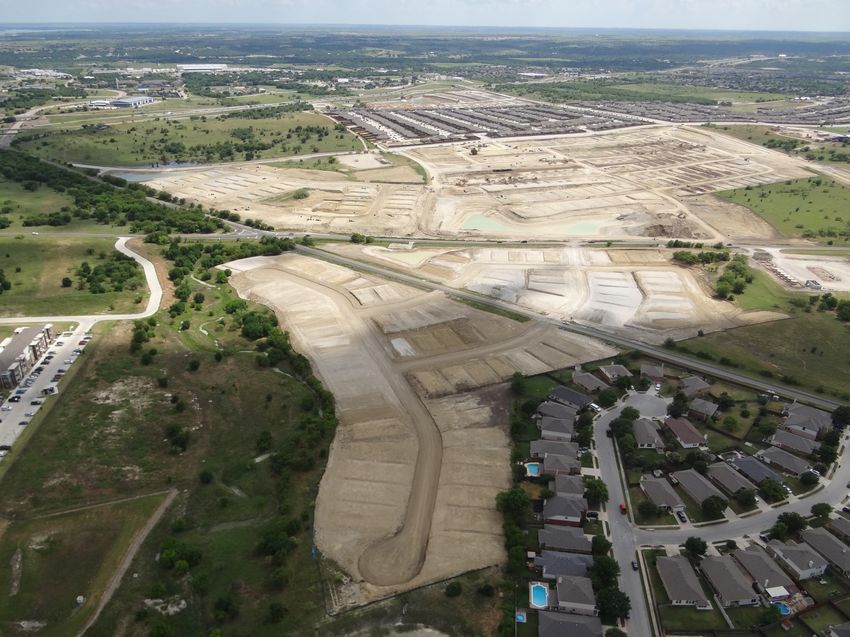
DFW EXISTING HOME SALES (DFW MSA)
120,000 9.00
110,000
8.00
100,000
7.00
90,000
Month Supply of Listing Inventory
80,000 6.00
70,000
Annual Units
5.00
Listing Inventory
60,000
Remains Near
1-month supply 4.00
50,000
40,000 3.00
30,000
2.00
20,000 Annual Resale Rate (6/21) 117,123
Up 14.6% vs. 1 Year Ago 1.00
10,000 30-Yr Low
Month Supply of Listings: 1.13
0 0.00
Sep-09
Sep-10
Sep-11
Sep-12
Sep-13
Sep-14
Sep-15
Sep-16
Sep-17
Sep-18
Sep-19
Sep-20
May-09
May-10
May-11
May-12
May-13
May-14
May-15
May-16
May-17
May-18
May-19
May-20
May-21
Jan-09
Jan-10
Jan-11
Jan-12
Jan-13
Jan-14
Jan-15
Jan-16
Jan-17
Jan-18
Jan-19
Jan-20
Jan-21
Source: Texas A&M Real Estate Center
Note that Texas A&M has redefined MLS Area to MSA instead of previous area compilations
5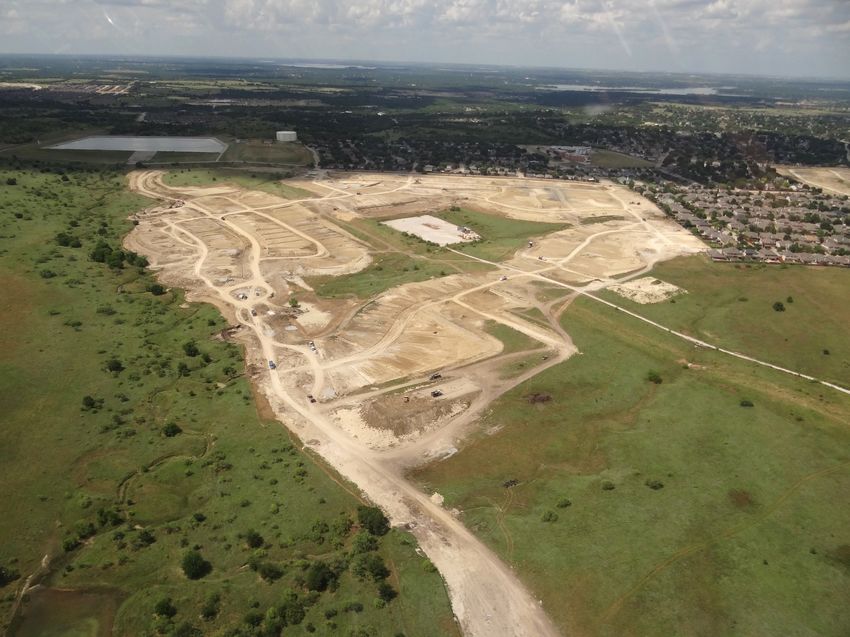
DFW RELOCATIONS
•     Census Bureau releases initial 2020 MSA population data in May
•     DFW’s total population in 2020 was just under 7.64M (DFW remains the 4th
      most populated MSA in the nation behind N.Y., L.A. and Chicago)
•     Data shows DFW had net migration (relocations) for 12-month period
      ended 7/1/20 of 74,920
       – Migration: 77.5% Domestic, 22.5% International
•     Total population change for same period (migration plus births over
      deaths) was 119,748
•     Net migration for 10-year period 2010 to 2020 was 763,593
•     Builders report that relocation buyers continued to emerge throughout the
      pandemic
       – Many out-of-town buyers bringing large amounts of equity to table
          from sale of previous home
•     Anecdotal evidence suggests as much as 40-50% of buyer demand at higher
      price points stemming from relo buyers today
Sources: CBRE, DMN, DBJ, DRC, US Census Bureau

                                                                            6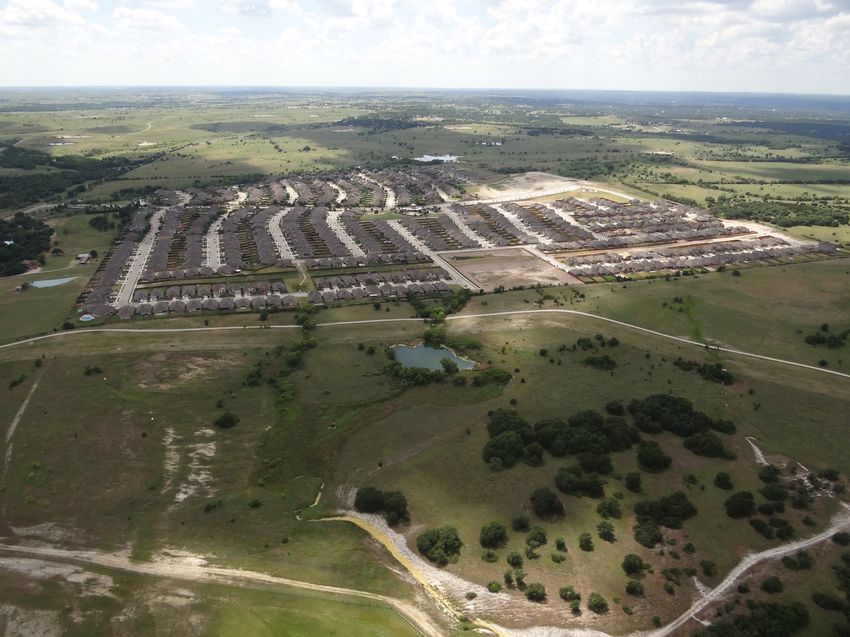
TARRANT COUNTY - 2020 CENSUS RESULTS
•     Census Bureau releases initial 2020 population counts in May & August 2021
•     Tarrant County’s total population in 2020 was 2,110,640

                                                          Tarrant Co. Population
                                                          Growth Since 2010:

                                                          Ø +301,606 people

                                                          Ø 16.7% increase

•     Next data releases scheduled for December 2021 and March 2022

    Source: US Census Bureau

                                                                                   7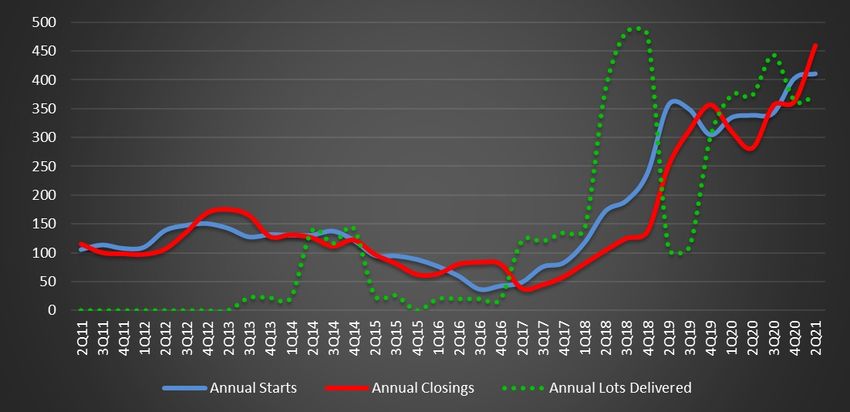
TEXAS ECONOMY                                           Employment Recovery
                                 Total Texas Employment
                                                                            How Much To Go?
                  13,500,000
                                                                              Difference From Pre-Pandemic
                  13,000,000                                                      Level of 2/20 and 6/21
                  12,500,000
                                                                          United States
                                                                          – 4.451 million                       2.95%
                  12,000,000
                                                                          Texas
Total # of Jobs

                  11,500,000                                              – 251,500                             1.95%
                                                          COVID decline
                  11,000,000                               of 1.4M jobs               Major Texas Markets
                                                          and recovery
                  10,500,000     Great                                          Gap From Pre-Pandemic High
                               Recession
                                                                          –    DFW         53,000                1.4%
                  10,000,000
                                                                          –    Houston 147,900                   4.6%
                   9,500,000
                                                                          –    Austin       5,400                 0.5%
                   9,000,000                                              –    San Antonio 10,800                 1.0%
                               '00
                               '01
                               '02
                               '03
                               '04
                               '05
                               '06
                               '07
                               '08
                               '09
                               '10
                               '11
                               '12
                               '13
                               '14
                               '15
                               '16
                               '17
                               '18
                               '19
                               '20
                               '21

                                                                          Source: TWC – CES (Not Seasonally Adjusted)

                                                                                                                        8
DFW ANNUAL EMPLOYMENT GROWTH
                    400,000
                                                                                Annual Change June ‘20 – June ‘21
                    300,000                                                       TWC CES: +206,300 (+5.76%)
                                                                                  Total Employment: 3,785,800
                    200,000                                                                                                                        Recovery
ANNUAL JOB GROWTH

                    100,000

                          0

                    -100,000

                    -200,000         •     405,800 jobs lost in April 2020
                                     •     DFW Area added 27,200 jobs in June 2021
                    -300,000         •     Region needs to add 53K more jobs to                                                  COVID-19 related
                                           reach pre-Covid level                                                                     layoffs

                    -400,000
                               '00   '01   '02   '03   '04   '05    '06   '07    '08   '09   '10   '11   '12   '13   '14   '15   '16   '17   '18     '19   '20   '21
                                                                   DFW CES Total Non-Farm Annual Employment Change

                       Sources: TWC – CES, Dallas Federal Reserve (Not Seasonally Adjusted)

                                                                                                                                                                 9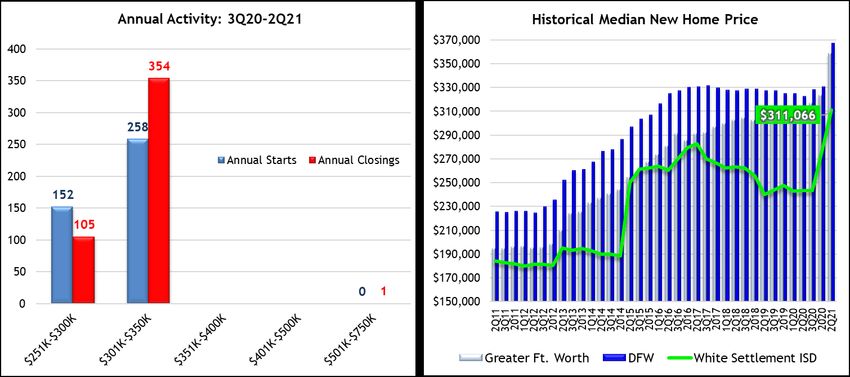
MONTHLY CHANGE IN DFW EMPLOYMENT
                                                                                                                                     Annual
                                                                                                             June 2021                              % Change
                               90,000                                                                                                Change

                                                                                                      Mining, Log, Construction      -2,400          -1.1%
                               40,000

                                                                                                           Manufacturing             +3,900           1.4%
                               -10,000
MONTHLY CHANGE IN # OF JOBS

                                                                              +27,200 jobs in         Trade, Transportation &
                                                                                                                                    +43,900           5.6%
                               -60,000                                          June 2021                     Utilities

                                                                                                            Information              +3,000           3.9%
                              -110,000

                                                                                                         Financial Activities        +7,900           2.4%
                              -160,000
                                                                                                      Professional & Business
                                                                                                                                    +52,600           8.7%
                              -210,000                                                                       Services

                                                                                                     Education & Health Services     +8,100           1.8%
                              -260,000

                                                                                                        Leisure & Hospitality       +57,900          18.2%
                              -310,000

                                                                                                           Other Services            +11,800         10.7%
                              -360,000

                                                                                                            Government               +19,600          4.6%
                              -410,000
                                         J   F   M      A   M      J     J    A      S   O   N   D
                                                                                                                     Source: TWC—CES Survey (NSA)
                                         2017    2018       2019       2020       2021

                                                                                                                                                      10
DFW UNEMPLOYMENT
14.0
DFW % Unemployment Rate
12.0
Unemployment Rates – June 2021
US : 6.1% Texas: 6.6%
10.0 DFW: 6.0%
Unemployment % Rate
8.0
6.0
4.0 4% considered ‘full
employment’
2.0
'00 '01 '02 '03 '04 '05 '06 '07 '08 '09 '10 '11 '12 '13 '14 '15 '16 '17 '18 '19 '20 '21
Not Seasonally Adjusted Source: TWC - LAUS
11WHITE SETTLEMENT ISD PRE-OWNED HOME SALES
• 645 total resales in the district from 3Q20-2Q21 (27.2% Y-o-Y)
Ø Highest annual total in more than a decade
• WSISD’s median resale sold price climbs to a record high of $223K in the 2nd quarter of 2021
Ø +14.4% vs. 3Q19-2Q20
Ø DFW median resale price 3Q20-2Q21 = $355,000
Source: NTREIS – SF detached, non-builder sales only
12WHITE SETTLEMENT ISD PRE-OWNED HOME SALES BY CITY SECTOR
Source: NTREIS – SF detached, non-builder sales only
§ 60% of existing home sales in the district occurred in Fort Worth
§ From 3Q20-2Q21, there were 261 total resales in the City of White Settlement
Ø Highest annual sales over the past decade
13WSISD ANNUAL NEW HOME CONSTRUCTION Annual Highs
Starts: 496 (1Q05-4Q05)
& NEW LOT DELIVERIES 3Q20-2Q21 Closings: 460 (3Q20-2Q21)
New Record
3Q20-2Q21 and YoY Chg.
Start = Foundation started Annual Starts: 410 (+21.3%)
Closing = Occupied home
Annual Closings: 460 (+63.1%
Current Cycle
§ 410 new homes were started in the district from 3Q20-2Q21 (+21% vs. 3Q19-2Q20)
Ø Highest annual total since 2006
§ Annual closings climb to a record 460 units, surpassing the previous high set in 2007
§ Developers delivered 372 new lots in the district from 3Q20-2Q21
14WHITE SETTLEMENT ISD
NEW HOME CONSTRUCTION BY CITY SECTOR (3Q20-2Q21)
Ø 98% of closings from 3Q20-2Q21
occurred in the City of Fort
Worth portion of the district.
15WHITE SETTLEMENT ISD TOP PRODUCING NEW HOME
SUBDIVISIONS (Ranked by Annual Closings 3Q20-2Q21)
Inventory Vacant
Annual Annual Future Elementary
Rank Subdivision Builders (UC, FV, Developed
Starts Closings Lots Zone
Models) Lots
Express Homes
1 Highlands at Chapel Creek 267 266 by D.R. Horton 180 37 286 Blue Haze
Impression,
2 Live Oak Creek 134 171 Cheldan, 34 5 95 North
Stonehollow
3 Hills of Windridge 0 12 Serene Country 4 6 1,666 North
4 Wilson Cliff 7 10 Cheldan 1 2 0 Liberty
16NEW HOME ACTIVITY BY ELEMENTARY ZONE
3Q20-2Q21
Ø The majority of the
district’s record new
home construction
has occurred within
the Blue Haze
Elementary
attendance zone
17DISTRICT NEW HOME ACTIVITY BY PRICE POINT
Ø Value driven/entry-level and move-up homes priced $251-350K remain the dominant
new home product types in WSISD
Ø WSISD’s median new home price as of June 2021 was a record $311,066 (+27.9% YoY)
Ø Greater Fort Worth’s median new home price = $358,358 (+16.4% Y-o-Y)
Ø DFW Median New Home Price = $367,038 (+13.8% Y-o-Y)
18NEW HOMEBUILDERS FOCUS ON DISTRICT’S WEST SIDE
In-process/planned
residential development
W hi
te Se
ttlem
ent
Rd.
820
L oop I-30 19WHITE SETTLEMENT ISD RESIDENTIAL LOT INVENTORY
AND FUTURE DEVELOPMENT
§ 75 new lots delivered at Chapel Creek Ranch in 2Q21
§ 161 vacant developed lots remaining in the district as of month-end June 2021
§ 625 future lots under development as of the end of 2Q21
Ø Highlands at Chapel Creek – Phase 5: 286 lots (Blue Haze ES zone)
Ø Vista West II Phase 1: (254 lots - Blue Haze / LGI Homes); expected to increase to
approximately 400 lots for initial delivery in Fall 2021
§ 4,950 single-family (SF) future lots are planned in the district as of June 2021
(currently not under development; includes Hills of Windridge and approximately
2,000 lots at ZC 19-183) with more expected
§ As of June 2021, there are a combined total of 5,957 total
single-family lots in-process/planned in White Settlement ISD (includes
homes under construction but not occupied, model homes, VDL’s, lots U/D, and planned future lots)
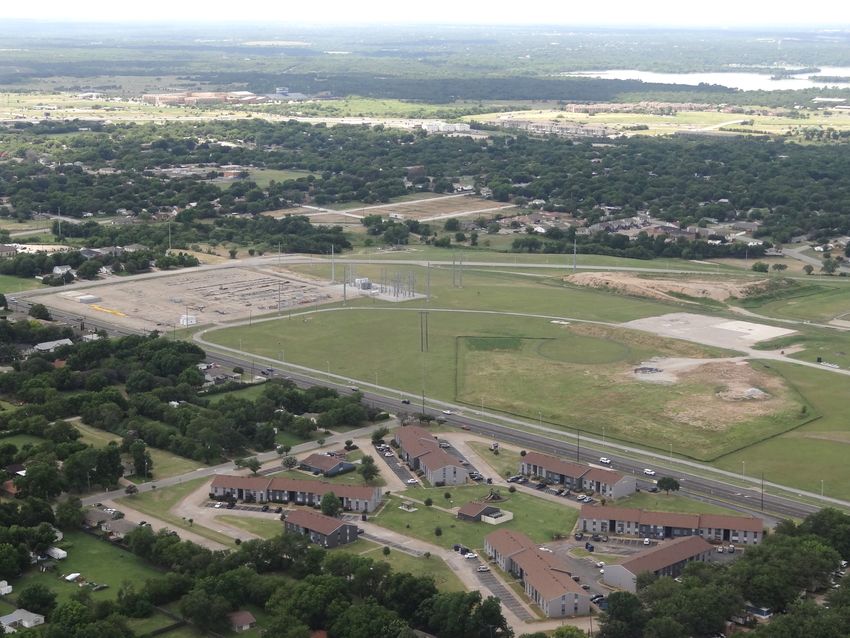
20Aerial Photos
July 1, 2021
21HIGHLANDS AT CHAPEL CREEK &
N
WESTPOINT CROSSING
Highlands at Chapel Creek
Westpoint Crossing
22VISTA WEST II
N
Tannahill IS
23CHAPEL CREEK RANCH N
Blue Haze ES
Tannahill IS
24LIVE OAK CREEK N
25SADDLE HILLS N
Brewer HS
26WSISD NEW HOME CONSTRUCTION
10-YEAR CLOSINGS FORECAST
*Annual periods represent 4Q-3Q
Ø District builders are on pace to produce 430 new home occupancies from 4Q20-3Q21
Ø WSISD is poised to see about 2,100 new homes built and occupied over the next five years,
averaging approximately 425 closings per year
Ø With D.R. Horton potentially acquiring additional locations in the district, the pace of
annual activity could climb to over 500 homes per year
Ø The district could see over 4,800 new homes occupied over the next 10 years if residential
growth continues as expected
27WSISD STUDENT YIELDS ANALYSIS
Ø The average yield per
single-family home in
subdivisions with active new
home construction is currently
0.45 per home.
Ø The Highlands at Chapel Creek
(0.44) and Live Oak Creek
(0.37)
Ø In 2020, the district’s average
multi-family yield declines
slightly to 0.19 enrolled
students per apartment unit.
Yields based on students
Enrolled in White Settlement ISD
28DISTRICT ENROLLMENT PROJECTIONS
FALL 2022-2031 (2Q21 DRAFT)
Projected Net Moderate
Growth Scenario § WSISD enrollment as of 9/8/21 is 7,005 students
3-Year (+301 students or +4.5% vs. Fall 2020 Snapshot)
372
5-Year 704
10-Year 2,054 Projected
5-Yr. Annual 2.0%
Avg.
Historical
29White Settlement ISD
2Q21 Demographics Summary
§ Record housing demand continues during the 2nd quarter of 2021
§ 645 existing homes sold over the past year (most in over a decade) at a record median price of $223K
§ From 3Q20-2Q21, new homebuilders produced 410 starts and 460 closings in WSISD; the most new home construction in
the district in 14 years and a new annual record for closings (surpassing the previous high set in early 2007)
§ 98% of district’s new homes are being built in the Fort Worth portion of the district led by the top producing subdivisions,
Highlands at Chapel Creek (Blue Haze ES) and Live Oak Creek (North ES)
§ Express Homes by D.R. Horton started 267 homes and closed 266 homes at Highlands at Chapel Creek over the past year;
Live Oak Creek builders produced 134 starts and 171 closings
§ Value driven move-up and entry-level homes are the key drivers of new home sales in district with nearly all new homes
having base pricing between $250K and $350K
§ WSISD median new home price climbs over $300K in 2Q21 to a record $311,066 (DFW = $367K)
§ Developers delivered 372 new single-family (SF) lots in WSISD over the past 4 quarters
§ 161 vacant, fully developed, SF residential lots left as of month-end June 2021
§ 625 future lots currently under development including 254+ lots at Vista West II for LGI Homes
§ An additional 4,950 future SF lots are planned for development
§ Builders poised to produce over 2,100 new single-family homes in WSISD over the next 5 years
§ District could see over 4,800 new homes occupied over next 10 years if all proposed neighborhoods are developed
§ Single-family homes in district currently yielding average of 0.45 enrolled students per home
§ Apartment units producing average of 0.19 enrolled students per unit
§ WSISD enrollment as of 9/8/21 is 7,005 students (+301 students or +4.5% vs. Fall 2020 Snapshot)
§ Enrollment growth is projected to continue trending upwards towards a 2-3% annual growth rate, which will increase
district enrollment to over 8,000 students by the 2027/28 school year and to over 9,000 students by Fall 2031
3031
16980 Dallas Parkway
                                                                      Suite 101
                                                                 Dallas, Texas 75248

                                                     www.schooldistrictstrategies.com
Although School District Strategies (SDS) has used commercially reasonable efforts to obtain information from sources it believes to be reliable and accurate, SDS
does not guarantee the accuracy or completeness of such information. Information presented in this report represents SDS’s estimates as of the date of the report
and is subject to change without notice. This report is not intended as a recommendation or endorsement of any action taken by you or any third party in regard to
the subject matter of this report or any other real estate activity. SDS WILL HAVE NO LIABILITY FOR INDIRECT, INCIDENTAL, CONSEQUENTIAL, OR SPECIAL DAMAGES,
INCLUDING (BUT NOT LIMITED TO) LOST PROFITS, OR DIMINUTION IN VALUE OF YOUR BUSINESS OR PROPERTY, ARISING FROM OR RELATING TO SDS’S SERVICES
HEREUNDER, REGARDLESS OF ANY NOTICE OF THE POSSIBILITY OF SUCH DAMAGES AND WHETHER OR NOT SUCH DAMAGES ARE REASONABLE OR FORESEEABLE UNDER
THE APPLICABLE CIRCUMSTANCES. SDS’S LIABILITY ON ANY CLAIM OF ANY KIND, INCLUDING NEGLIGENCE, FOR ANY LOSS OR DAMAGE ARISING OUT OF, CONNECTED
WITH, OR RESULTING FROM THIS REPORT OR THE SERVICES PROVIDED BY SDS SHALL IN NO SINGLE CASE, OR IN THE AGGREGATE, EXCEED THE AMOUNTS ACTUALLY
PAID TO SDS IN CONNECTION WITH THE REPORT.

The following contingencies and limiting conditions are noted as fundamental assumptions that may affect the accuracy or validity of the analysis and conclusions set
forth in this report. Specifically, the parties assume: that the Dallas/Fort Worth metropolitan area, the State of Texas, and the nation as a whole will not suffer any
major economic shock during the time period of the forecast contained in this report; that general population levels will continue to increase at or above the rate
forecast; that the public and third party sources of statistical data and estimates used in this analysis are accurate and complete in all material respects, and that
such information is a reasonable resource for project planning purposes; the proposed real estate development projects described herein, when completed, will be
designed, promoted, and managed in a manner that will have an impact on the local market that is reasonably consistent with other similar projects in the past; and
that the recommendations set forth in this report will be acted upon within a reasonable period of time to preclude major changes in the factual conditions
evaluated.

                                                             Copyright 2021 School District Strategies.

                                                                                                                                                                32
You can also read