Using Location Analytics to Plan for a Post-Pandemic Economic Recovery - Retail Districts of Greater Philadelphia
←
→
Page content transcription
If your browser does not render page correctly, please read the page content below
5 P’s that Aren’t Pandemic • Location Analytics • Diverse Downtowns • Breaking Ground 2021

Retail Districts of Greater Philadelphia:
Using Location Analytics to Plan for a
Post-Pandemic Economic Recovery
February 2021
Background and Next Steps
2008                 2019                    Spring 2020               Fall 2020                          March 2021
Classic Towns        Classic Towns           COVID-19 pandemic         DVRPC executes                     One year into the
program              program                 impacted region, and      location analytics                 pandemic:
launched to          discontinued            DVRPC launched            contract with
help promote                                 5 Ps that Aren’t          Buxton Co.                         DVRPC launches Diverse
and market the                               Pandemic social                                              Downtowns social media
region’s                                     media campaign            Retail inventory                   campaign
downtowns                                                              update complete
                                             Location analytics                                           Reports findings to
                                             identified as a tool to   Location analytics                 partners
                                             help plan for recovery    begins

       2013                    Winter 2020                Summer 2020                     Winter 2021                    June 2021
       DVRPC inventories       DVRPC began up-            DVRPC published                 Buxton presents                DVRPC will hold
       70+ retail districts,   dating retail district     5 Ps that Aren’t                findings and data              Breaking Ground
       and publishes:          inventory                  Pandemic report,                dashboard for 23 former
       Revitalizing                                       hosted a webinar on             Classic Towns                  Technical Assistance
       Suburban                                           retail strategies and                                          Webinar and host
       Downtown Retail                                    planning for recovery,          DVRPC combines                 panel to discuss
       Districts: Strategies                              and released Location           location analytics             economic recovery for
       and Best Practices                                 Analytics RFP                   with retail inventory.
                                                                                          Identifies relationship        Greater Philadelphia’s
                                                          Retail districts from           between downtown               retail districts and
                                                          the region’s four Core          diversity and the              downtowns
                                                          Cities added to analysis        pandemic’s impact
                                                          to ensure an equitable          on 75 of the region’s
                                                          approach to recovery            downtowns

                   February 2021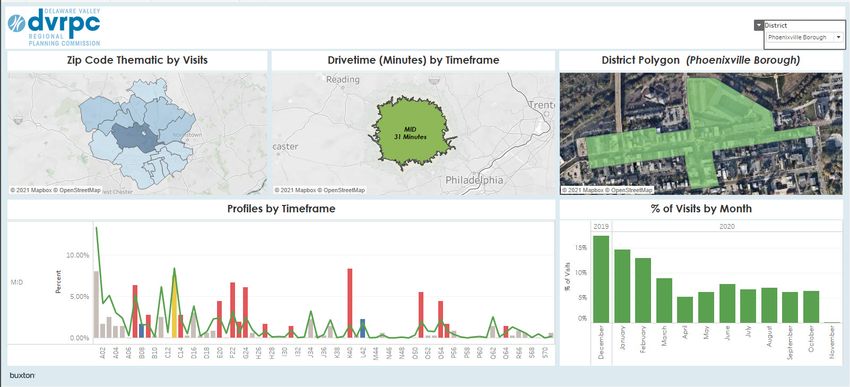
Location Analytics Data | 75 Downtowns
New Jersey                                                          Pennsylvania
Burlington County                Gloucester County                  Bucks County                          Montgomery County
Bordentown City                  Glassboro Borough                  Bristol Borough                       Ambler Borough
Burlington City                  Gloucester City                    Doylestown Borough                    Cheltenham Township (Glenside)
Maple Shade Township             Harrison Township (Mullica Hill)   Langhorne Borough                     Hatboro Borough
Moorestown Township              Paulsboro Borough                  Morrisville Borough                   Jenkintown Borough
Mount Holly Township             Pitman Borough                     New Hope Borough                      Lansdale Borough
Palmyra Borough                  Swedesboro Borough                 Newtown Borough                       Lower Merion Township (Ardmore)
Riverside Township               Wenonah Borough                    Perkasie Borough                      Lower Merion Township (Bryn Mawr)
Riverton Borough                 Westville Borough                  Sellersville Borough                  Lower Merion Township (Haverford)
                                 Woodbury City                      Quakertown Borough                    Narberth Borough
Camden County                                                       Yardley Borough                       Norristown Borough
Audubon Borough (Merchant St.) Mercer County                                                              Pottstown Borough
Barrington Borough             Hightstown Borough                   Chester County                        Souderton Borough
Berlin Borough                 Princeton                            Coatesville City                      Telford Borough
Camden City (Federal Street)   Trenton (State Street)               Downingtown Borough
Collingswood Borough                                                Kennett Square Borough                Philadelphia County
Haddon Heights Borough                                              Malvern Borough                       52nd Street
Haddon Township (Westmont)                                          Phoenixville Borough
Haddonfield Borough                                                 West Chester Borough
Laurel Springs Borough
Merchantville Borough                                               Delaware County
Pennsauken Township                                                 Chester City (Avenue of the States)
Pine Hill Borough                                                   Darby Borough
                                                                    East Lansdowne Borough
                                                                    Haverford Township (Brookline)
                                                                    Haverford Township (Oakmont)
                                                                    Lansdowne Borough
                                                                    Marcus Hook Borough
                                                                    Media Borough
                                                                    Norwood Borough
*Former Classic Towns analyzed by Buxton Co.                        Radnor Township (Wayne)
as part of the location analytics contract.                         Ridley Park Borough
                                                                    Swarthmore Borough
                                                                    Upper Darby Township

                      February 2021
Buxton’s Analysis | 23 Downtowns
Of the 75 downtowns for which DVRPCpurchased geolocation data, Buxton
conducted an analysis of and developed a data dashboard for these 23 downtowns:
New Jersey Pennsylvania
Burlington County Bucks County Montgomery County
Bordentown City Bristol Borough Ambler Borough
Moorestown Township Doylestown Borough Cheltenham Township (Glenside)
Riverton Borough New Hope Borough Jenkintown Borough
Quakertown Borough Lansdale Borough
Camden County Lower Merion Township (Ardmore)
Collingswood Borough Chester County Souderton Borough
Haddon Heights Borough Kennett Square Borough
Merchantville Borough Phoenixville Borough
West Chester Borough
Gloucester County
Glassboro Borough Delaware County
Woodbury City Media Borough
Radnor Township (Wayne)
February 2021Buxton’s Analysis | Three Time Periods
Visits to the 23 downtowns were separated into
three distinct time periods:
1 Pre-Pandemic
December 1, 2019 through March 13, 2020
2 Economic Shutdown
March 14, 2020 through June 15, 2020
3 Economic Reopening
June 16, 2020 through November 30, 2020
February 2021Buxton’s Analysis | Trade Area Impacts
Trade areas are defined as the time (in minutes) that 75% of a downtown’s
visitors are willing to drive to get to the downtown.
Buxton found that the average trade area for the 23 downtowns was:
Pre-Pandemic Economic Shutdown Economic Reopening
41 Minutes 31 minutes 36 minutes
25% decrease 16% increase
February 2021Buxton’s Analysis | Consumer Profiles
Consumer profiles are used to understand the characteristics, behaviors, and
interests of current and potential visitors to the downtowns in order to better
plan for consumer growth and retention.
In order to develop consumer profiles for visitors to the region’s downtowns,
Buxton used Experian’s Mosaic segmentation.
Mosaic divides the U.S. population into 19 Groups and 71 more detailed types,
which are described on subsequent slides and are delineated as follows:
Greyed out text indicates this type was not a core consumer for the 23
downtowns pre-pandemic.
Blue text indicates the type was a core consumer for the 23 downtowns
pre-pandemic.
February 2021Buxton’s Analysis | Consumer Profile Group A
Segment A01: American Royalty
Affluent, influential and successful couples and families living in prestigious suburbs
Segment A02: Platinum Prosperity
Wealthy and established empty-nesting couples residing in suburban and in-town homes
Segment A03: Kids and Cabernet
Prosperous, middle-aged married couples with children living child-focused lives in
affluent suburbs
Segment A04: Picture Perfect Families
Established families of child-rearing households living in wealthy suburbs
Segment A05: Couples with Clout
Middle-aged, childless couples living in affluent metro areas
Segment A06: Jet Set Urbanites
Upscale singles and couples living high-rise fashionable lives; city-style
February 2021Buxton’s Analysis | Consumer Profile Group B
Segment B07: Across the Ages
Flourishing couples and multi-generational families living a wide range of lifestyles in
suburbia
Segment B08: Babies and Bliss
Middle-aged couples with large families and active lives in affluent suburbia
Segment B09: Family Fun-tastic
Upscale, middle-aged families with older children pursuing busy kid-centered lives in
satellite cities
Segment B10: Cosmopolitan Achievers
Affluent middle-aged and established couples and families enjoying dynamic lifestyles in
metro areas
February 2021Buxton’s Analysis | Consumer Profile Group C
Segment C11: Sophisticated City Dwellers
Wealthy boomer-aged couples living in cities and closed-in suburbs
Segment C12: Golf Carts and Gourmets
Thriving retirees and empty-nesters in comfortable communities
Segment C13: Philanthropic Sophisticates
Mature, upscale couples and singles in suburban homes
Segment C14: Boomers and Boomerangs
Baby boomer adults and their teenage/young adult children sharing suburban homes
February 2021Buxton’s Analysis | Consumer Profile Group D
Segment D15: Sports Utility Families
Upscale, middle-aged couples with school-aged children living active family lifestyles in
outlying suburbs
Segment D16: Settled in Suburbia
Upper middle-class diverse family unites and empty nesters living in established suburbs
Segment D17: Cul De Sac Diversity
Cultured families settled in new suburban neighborhoods
Segment D18: Suburban Nightlife
Upper established couples and families living mainly in the expanding suburbs
February 2021Buxton’s Analysis | Consumer Profile Groups E & F
Segment E19: Consummate Consumers
Households with adult children in an upper-middle class lifestyle with discretionary
income living sophisticated lifestyles
Segment E20: No Place Like Home
Upper middle-class multi-generational households in exurban areas
Segment E21: Unspoiled Splendor
Comfortably established baby boomer couples in town and country communities
Segment F22: Fast Track Couples
Active, young, upper middle-class suburban couples and families living upwardly-mobile
lifestyles
Segment F23: Families Matter Most
Young, middle-class families in scenic suburbs leading active, family-focused lives
February 2021Buxton’s Analysis | Consumer Profile Groups G & H
Segment G24: Ambitious Singles
Youthful, cutting-edge singles living in mid-scale metro areas balancing work and leisure
lifestyles
Segment G25: Urban Edge
Lively, up-and-coming singles living big city lifestyles located within top MSA markets
Segment H26: Progressive Assortment
Mature couples with comfortable and active lives in established suburbs
Segment H27: Life of Leisure
Upper established couples living leisure lifestyles in small towns and cities
Segment H28: Everyday Moderates
Mid-scale, multi-cultural couples and families living in mid-tier metro suburban settings
Segment H29: Destination Recreation
Middle-aged, midscale couples in rural towns and fringe suburbs working to enjoy their
active lifestyles
February 2021Buxton’s Analysis | Consumer Profile Group I
Segment I30: Potlucks and the Great Outdoors
Comfortably established, middle-income couples with children living in suburbia
Segment I31: Hard Working Values
Established families in smaller cities and towns with solid blue-collar jobs
Segment I32: Steadfast Conventionalists
Conventional Generation X families located in selected coastal city homes
Segment I33: Balance and Harmony
Middle-class families living lively lifestyles in city-centric neighborhoods
February 2021Buxton’s Analysis | Consumer Profile Group J
Segment J34: Suburban Sophisticates
Established sophisticates living comfortable suburban lifestyles
Segment J35: Rural Escape
Sophisticated, established couples and singles living comfortable lives in rural towns
Segment J36: Settled and Sensible
Mature, established couples with adult children and singles in suburban and rural
neighborhoods
February 2021Buxton’s Analysis | Consumer Profile Group K
Segment K37: Wired for Success
Young, mid-scale singles and couples living socially-active city lives
Segment K38: Modern Blend
Comfortably established singles and couples living suburban lifestyles
Segment K39: Metro Fusion
Ethnically-diverse, middle-aged singles living urban active lifestyles
Segment K40: Bohemian Groove
Mature, unattached individuals enjoying settled urban lives
February 2021Buxton’s Analysis | Consumer Profile Groups L & M
Segment L41: Booming and Consuming
Older empty-nesting couples and singles enjoying relaxed lives in small towns
Segment L42: Rooted Flower Power
Mid-scale baby boomer singles and couples rooted in established suburban communities
and approaching retirement
Segment L43: Homemade Happiness
Lower middle-class baby boomer households living in remote town and country homes
Segment M44: Creative Comfort
Rural families with modest incomes and diverse household dynamics
Segment M45: Growing and Expanding
Young, working-class families and single parent households living in small established,
city residences
February 2021Buxton’s Analysis | Consumer Profile Group N
Segment N46: True Grit Americans
Older, middle-class households in town and country communities located in the nation’s
midsection
Segment N47: Countrified Pragmatics
Lower middle-income couples and singles living rural, casual lives
Segment N48: Rural Southern Bliss
Lower middle-income multi-generational families living in small towns
Segment N49: Touch of Tradition
Working-class, middle-aged couples and singles living in rural homes
February 2021Buxton’s Analysis | Consumer Profile Group O
Segment O50: Full Steam Ahead
Younger and middle-aged singles gravitating to second-tier cities
Segment O51: Digitally Savvy
Young singles who live digital-driven smaller city lifestyles
Segment O52: Urban Ambition
Mainly Generation Y African-American singles and single families established in mid-
market cities
Segment O53: Colleges and Cafes
Young singles and recent college graduates living in college communities
Segment O54: Influenced by Influencers
Young singles living in Midwest and Southern city centers
Segment O55: Family Troopers
Families and single-parent households living near military bases
February 2021Buxton’s Analysis | Consumer Profile Group P
Segment P56: Mid-scale Medley
Middle-aged, mid-scale unattached adults living in secondary cities
Segment P57: Modest Metro Means
Mid-scale singles established in inner-city communities
Segment P58: Heritage Heights
Singles and families with mid and low incomes living settled lives in urban apartments
Segment P59: Expanding Horizons
Middle-aged, mid-scale income families living mainly within US border cities
Segment P60: Striving Forward
Cultured families and single parents earning modest incomes in gateway communities
Segment P61: Simple Beginnings
Singles and single parent households with modest incomes in city apartments
February 2021Buxton’s Analysis | Consumer Profile Groups Q & R
Segment Q62: Enjoying Retirement
Relaxed, retired couples and widowed individuals in suburban homes living quiet lives
Segment Q63: Footloose and Family Free
Elderly couples and widowed individuals living active and comfortable lifestyles
Segment Q64: Established in Society
Stable, sophisticated seniors living in older homes and leading sedentary lifestyles
Segment Q65: Mature and Wise
Retirees settled in metro apartment communities living cost-effective, sensible lives
Segment R66: Ambitious Dreamers
Lively singles and single-parents with cost-conscious mindsets starting out in city
apartments
Segment R67: Passionate Parents
Young, single parents with cost-conscious mindsets in second-city apartments
February 2021Buxton’s Analysis | Consumer Profile Group S
Segment S68: Small Town Sophisticates
Sophisticated, down-scale singles and couples with adult children living in modest,
exurban small towns
Segment S69: Urban Legacies
Cultured singles and single parents established in modest urban settings
Segment S70: Thrifty Singles
Middle-aged singles with limited income in transitional small town and exurban
apartments
Segment S71: Modest Retirees
Mature singles with limited income typically concentrated in inner-city apartments
February 2021Buxton’s Analysis | Pre-Pandemic Consumer Profile
Primary Core Visitors Secondary Core Visitors Tertiary Core Visitors
Segment groups whose share of visits Segment groups whose share of visits Segment groups who are less likely
was actually larger than their share of was equal to their share of the trade to visit, but represent an opportunity
the trade area’s total population. area’s total population. for growth.
%
%
%
%
%
Segment group’s
share of the trade
% area’s total
population.
%
A06
B10
C12
D15
D16
D17
D18
L41
L42
L43
M44
M45
N46
N47
N48
N49
O50
O52
O53
O54
O55
P56
P57
P58
P59
P60
P61
Q62
Q63
Q64
Q65
R66
R67
S68
S69
S70
S71
E21
F23
G25
H26
H27
H28
H29
I30
I32
I33
J34
J35
J36
K38
K39
February 2021Buxton’s Analysis | Economic Shutdown Consumer Profile
Primary Core Visitors Secondary Core Visitors Tertiary Core Visitors
Segment groups whose share of visits Segment groups whose share of visits Segment groups who are less likely
was actually larger than their share of was equal to their share of the trade to visit, but represent an opportunity
the trade area’s total population. area’s total population. for growth.
%
%
%
%
%
Segment group’s
share of the trade
% area’s total
population.
%
A03
A06
B07
B10
C11
C12
C13
D15
D16
D17
D18
E19
L41
E21
F23
G25
H26
H27
H28
H29
I30
I32
I33
J34
J35
J36
K38
K39
L43
M44
M45
N46
N47
N48
N49
O50
O52
O53
O54
O55
P56
P57
P58
P59
P60
P61
Q62
Q63
Q64
Q65
R66
R67
S68
S69
S70
S71
February 2021Buxton’s Analysis | Reopening Consumer Profile
Primary Core Visitors Secondary Core Visitors Tertiary Core Visitors
Segment groups whose share of visits Segment groups whose share of visits Segment groups who are less likely
was actually larger than their share of was equal to their share of the trade to visit, but represent an opportunity
the trade area’s total population. area’s total population. for growth.
%
%
%
%
%
Segment group’s
share of the trade
% area’s total
population.
%
B10
C12
D15
D16
D17
D18
E19
L41
L42
L43
M44
M45
N46
N47
N48
N49
O50
O52
O53
O54
O55
P56
P57
P58
P59
P60
P61
Q62
Q63
Q64
Q65
R66
R67
S68
S69
S70
S71
A06
E21
F23
G25
H26
H27
H28
H29
I30
I32
I33
J34
J35
J36
K38
K39
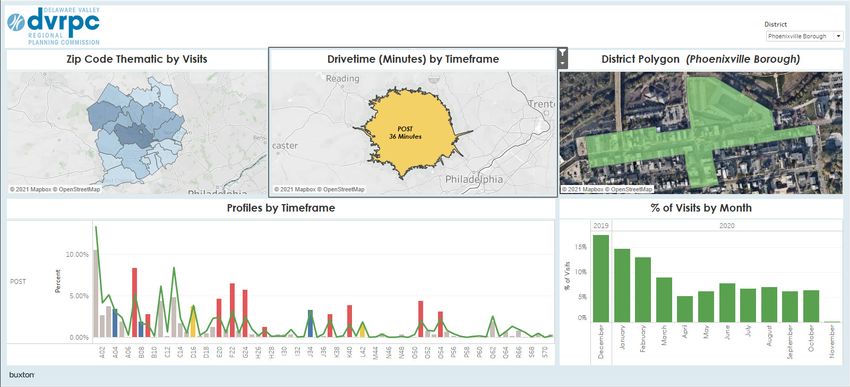
February 2021Buxton’s Analysis | Data Dashboard
Buxton developed a data dashboard for the 23 downtowns, which provides the
following interactive charts and maps for the three time periods on which they
conducted their analysis:
1 Zip Code Map 2 Trade Area Map 3 Downtown Boundaries
Volume of visits to the Drive time trade area is Provides the downtown
downtown by zip code the distance from which boundaries over an aerial
from which they came 75% of the downtown’s image
visits came
4 Consumer Profiles 5 Visits by Month
A bar chart showing the A bar chart that provides
downtown’s Primary, a breakdown of visits by
Secondary, and Tertiary month
Core Visitors
As an exmaple, the following slides highlight and provide a summary of
Phoenixville’s dashboard.
The dashboard file can be downloaded from DVRPC’s COVID-19 Resources page.
February 2021Buxton’s Analysis | Data Dashboard Example
Pre-Pandemic Visits to Phoenixville
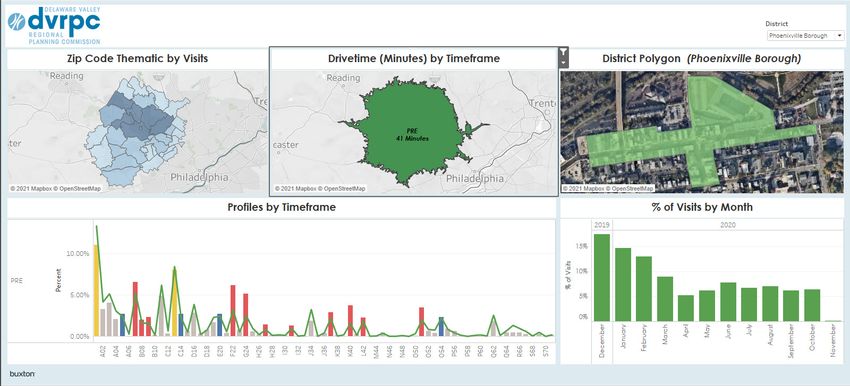
February 2021Buxton’s Analysis | Data Dashboard Example
Economic Shutdown Visits to Phoenixville
February 2021Buxton’s Analysis | Data Dashboard Example
Economic Reopening Period Visits to Phoenixville
February 2021Buxton’s Analysis | Data Dashboard Example
Some key findings from Phoenixville’s interactive dashboard are:
1 Zip Code Map 2 Trade Area Map 3 Downtown Boundary
The following zip codes The trade area for The boundary graphic
generated the most visits: Phoenixville was 41 minutes is not interactive, but for
Pre-Pandemic: 19403, 19426, before the pandemic. Phoenixville it does show
19453, 19460, 19464, 19465, that the Phoenix Village
During the shutdown the mixed-use development
19468, & 19475 trade area shrank by 24% was added to the downtown
Shutdown: 19460 down to 31 minutes, and since the 2013 retail
recovered 16% during the inventory was done.
Reopening: 19460 reopening to 36 minutes.
4 Consumer Profiles 5 Visits by Month
The greatest share of visits came from the Between December 2019 and October
following profiles: 2020, the greatest share of visits came in
Pre-Pandemic: 11.01% of visitors were December at nearly 17.5%.
from the A01 (American Royalty) segment Only 5.2% of visits occurred during April,
Shutdown: 8.31% of visitors were from the and June saw the greatest share of visits
K40 (Bohemian Groove) segment during the reopening period with a share
Reopening: 10.53% of visitors were from of 7.8% of all visits.
the A01 segment
February 2021DVRPC’s Analysis | All 75 Downtowns
Characteristics that reduced the pandemic’s impact.
Downtowns with the following characteristics were generally less impacted by the
pandemic than their peers:
Development Diversity People Trails Walkability
Recent mixed-use, Downtowns with Diverse and Existing Circuit Historic downtowns
residential, and diverse built permanent residential Trails connected with more pedestrian-
retail developments environments, populations located downtowns with open friendly built
within the downtowns demographics, within the downtowns space and enabled environments had
increased diversity as local economies, provided retailers alternative modes of greater resiliency.
well as resiliency. mix of uses, and with customers even transportation.
transportation as people stayed
options, were less close to home.
impacted.
February 2021DVRPC’s Analysis | All 75 Downtowns
Characteristics that exacerbated the pandemic’s impact.
Downtowns that lacked the characteristics found to reduce the pandemic’s impact, or
that were more greatly defined by the following characteristics, were generally more
impacted by the pandemic than their peers:
Cars Colleges Goods & Services Transit Vacancy
Auto-oriented Downtowns that As the share of The pandemic The pandemic had
downtowns with lower are overly-reliant Neighborhood Goods significantly reduced a greater impact as
Walk Scores and more on these anchor & Services (NGS) transit ridership, and downtown vacancy
cars per household institutions were less retailers increased this impact had a rates increased.
were more impacted by resilient during the in a downtown, so ripple effect in transit-
the pandemic. pandemic. did the pandemic’s oriented downtowns.
impact.
February 2021DVRPC’s Analysis | All 75 Downtowns
Summary:
Diverse Downtowns
were less impacted by the shutdown, and were
more resilient during reopening.
February 2021Continuing the Conversation
Social Media Campaign | Diverse Downtowns
March-May 2021
One year into the pandemic’s economic fallout, the Diverse Downtowns campaign will present to the
public DVRPC’s findings regarding the characteristics that both reduced and exacerbated the pandemic’s
impact, and a detailed snapshot of Greater Philadelphia’s 10 least impacted downtowns.
DVRPCWebsite | Update to the COVID-19 Resources Page
May 2021
The Buxton Company’s findings and data dashboard, as well as DVRPC’s findings for all 75 downtowns, will
be made available on the COVID-19 Resources page by the conclusion of the social media campaign.
Breaking Ground 2021 | Supporting Downtown Recovery
June 2021
Not all of Greater Philadelphia’s retail districts and downtowns were equally impacted by the pandemic.
A panel will discuss how to leverage lessons learned to ensure that the region’s downtowns are more
resilient to future economic upsets and better able to capitalize upon rising trends within the retail industry.
February 2021You can also read