Pandemic Perspective November 2013
←
→
Page content transcription
If your browser does not render page correctly, please read the page content below

1

Pandemic Perspective
November 2013

Empower Results ®

Table of Contents
Pandemic Perspective    3

A Plague of Pandemics   3

Modelling Pandemics     4

Length of the Event     6

Transparency            7

Conclusion              7

Pandemic Perspective        2

Pandemic Perspective
Anne-Lise Bagur reviews the history of pandemics and considers how the information
can be used for future risk modelling.

Did you know that, in the space of just a few months, the 1918-1919 Spanish flu killed 50
million people?

Nearly 100 years later, pandemic risk remains the most important mortality exposure for the
insurance industry and is placed above other forms of catastrophic event including natural
catastrophes, nuclear explosions, and terrorism.

A Plague of Pandemics
Humanity faced three worldwide pandemics in the 20th century: the Spanish flu, the Asian
flu (1957–1958) and the Hong Kong flu (1968–1969). Each of these outbreaks affected
approximately a third of the global population. In each case, the vigorous attack rate was
due to the lack of human immunity to a new strain of an influenza virus, born from a genetic
mutation in an animal virus, making it capable of spreading to the human population.

                                                                                            3
Pandemic Perspective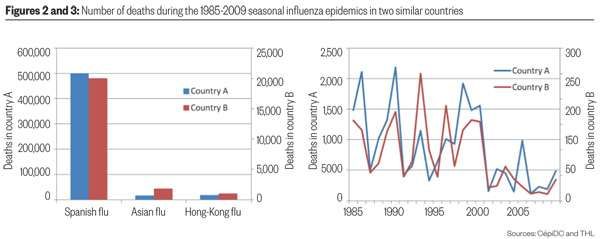
In the 21st century, the population has already faced three alarming outbreaks, which were
fortunately contained due to the absence of two major factors: effective human-to-human
transmission and high lethality. The 2005 H5N1 avian flu and the 2013 H7N9 bird flu
presented terrible mortality rates among the infected human population – 60% in 2005 and
32% in 2013 as at June 2013 – but their mode of transmission was essentially bird-to-
human. Conversely, the 2009 swine flu infected people from 21 countries in just a few weeks
but, as it was an H1N1 strain, its lethality was limited due to previous exposure (1918–1943)
and an immunisation programme in 1976.

Exposures to pandemics are therefore clearly important to insurers, not least because
pandemic risk represents a significant regulatory capital consideration. Under the European
Union’s Solvency II standard formula, the solvency capital requirement (SCR) for life
catastrophe risk is 1.5 per mille times the total death capital at risk based on a 200-year
return period pandemic scenario.

However, according to historical data, pandemics are large enough to destabilise the
insurance market more than once every 200 years, with three global pandemics recorded in
each of the last three centuries. This suggests that the majority of people working in the
insurance industry today are likely to face at least one pandemic during their careers.

Insurers should be aware that now is the time to anticipate and educate themselves on
pandemic risk, and begin to model it.

Modelling Pandemics
The World Health Organization (WHO) issued its first pandemic preparedness guidance in
1999, which has been revised twice in 2005 and 2009. In June 2013, the WHO announced
that a four-phase alert system including inter-pandemic and post-pandemic levels would
soon replace its six-phase system. Most of the current pandemic reinsurance treaties
structured as catastrophe excess of loss refer to the current six-phase alert system in their
trigger definitions, and the new version is likely to disrupt this modus operandi.

Alternatively, other covers of pandemic risk could be aggregate excess of loss where the
attachment point is an annual total amount of loss or cat bonds where the trigger is an increase in
mortality rates as reported by an official source such as the Centers for Disease Control and
Prevention (CDC) in the US.

To price these covers, the most sensitive parameter is also the hardest to calibrate – the
excess mortality rate or the mortality ratio among the infected population. This is because it
is difficult to deduce from historical data. Mortality risk, in the case of a pandemic, hugely
depends on the age of those infected, thus the parameter is more likely to be a mortality
table rather than a unique rate. To a lesser extent, mortality risk also seems to be correlated
with socio-economic status and pre-existent chronic diseases but not gender.

                                                                                                 4
Pandemic Perspective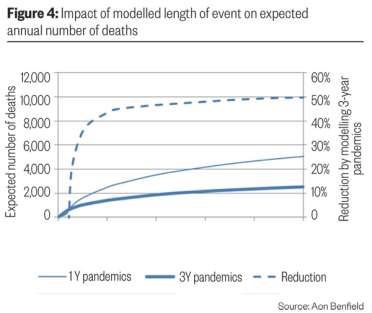
Since the Spanish flu in 1918, the discovery of antibiotics in the 1930s and the progression
of vaccination campaigns in the 1950s helped to reduce the fatality of seasonal influenza
epidemics as well as the two later pandemics (1957–1958 and 1968–1969). And since the
end of the 1990s, most developed countries have completed their preparedness plan for
pandemics at the request of the WHO. These plans include emergency measures to slow
the spread of a flu outbreak such as closure of public transport and schools, and strategies
to optimise medical care such as vaccination programmes and monitoring. These measures
are believed to significantly mitigate the impact of a pandemic, though only a few countries
have quantified the impact of such measures.
The good news is that, even if the insurance market seems largely ill-prepared, the national
preparedness plans can help in model calibration. They tend to include results of local
epidemiologist studies on the expected consequences of a future pandemic, including the
number of deaths and hospitalisations. A good example of this is the French preparedness
plan which ncludes as-if scenarios of the Spanish flu. The plan comprises very useful data
from the Institute National de Veille Sanitaire (INVS), the French national institute of health
monitoring, pertaining to associated hospitalisation and mortality rates per age band. And all
national plans are filed by the WHO and are available for free on the WHO website.

But not all countries have ready-made as-if scenarios. In the case where the exposure for an
insurance portfolio is from a non-modelled country, the best approach is to calibrate
parameters using a country that has similar historical pandemics and seasonal flu
epidemics. Some commercial life catastrophe models have recently been released in the
market, providing loss estimations per return period for insurance portfolios within their
geographical scopes. However, as their geographical scopes are partial, exposures can still
exist for a non-modelled country.
                                                                                             5
Pandemic Perspective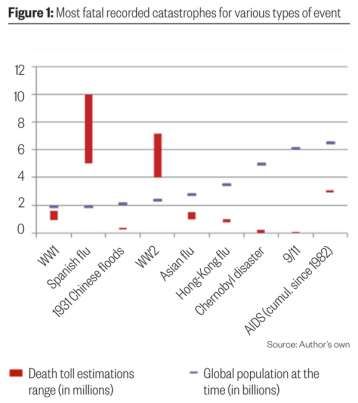
Case study 1: Number of deaths during the 20th century pandemics in two similar countries. Country B is not
modelled (no as-if scenarios are available). Among the modelled countries, country A presents similarities with
country B. Parameters of country A can help in calibrating parameters for country B.

Length of the Event
Another major aspect in pandemic modelling is length of event. Unlike natural catastrophes
which are instantaneous events, pandemics last several months, not to say a few years. And
they occur in distinct waves, which tend to be stronger during the winter periods. This means the
events are likely to cross calendar boundaries, and it has many consequences for modelling
pandemic risks.
Applying 100 percent of the total expected loss on a single calendar year, rather than
spreading the estimated loss accordingly to the length of the event and its strength over the
time, would lead to an over-estimation of reinsurance cost and the required solvency capital.
Historical data show that pandemics tend to last longer in some countries than in others.
This is partially explained by their geographical situation (for example, latitude, size, frontier
neighbours).
Therefore, even if convenient, insurers should resist the temptation of considering their
exposures in a modelled country, when their portfolio is actually exposed in a non-modelled
country.

                                                                                                                  6
Pandemic Perspective
Case study 2: Pandemic risk is modelled twice on the same insurance portfolio using the ReMetrica dynamic
financial analysis tool, rather than a commercial catastrophe model, as the length of event can be parameterised
in the ReMetrica model. The first modelling considers events bound into a calendar year. The second modelling
considers events in three waves, with a distribution of lethality over three years (35%; 50%; 15%). The results
above represent the annual number of deaths recorded from 01/01 to 31/12.
Transparency
Also, insurers modelling pandemic risks should consider the high capital requirements for life
and health catastrophe risks that Solvency II standard formula demands. It may be advisable
to consider building a partial internal model but bear in mind the regulator’s approbation
requirement on detailed documentation and validation.
Conclusion
Pandemics are not only theoretical events causing the largest modelled losses for life and health
insurance. They are real phenomena with a frequency at once high enough for us to get
prepared for the next one, and so low that historical statistics are not enough to calibrate a model
precisely.
As commercial cat models currently present several weaknesses, including limited
geographical scope, lack of flexibility and lack of transparency, therefore it is essential to
have a correct level of expertise and utilise the results from epidemiologist researches to
monitor exposure, appreciate reinsurance options or build an internal model.
This feature originally appeared in The Actuary.
7
Pandemic PerspectiveContact Information Anne-Lise Bagur Marc Beckers Irfan Akhtar +44 (0)20 7522 8239 t +44 (0)20 7086 0394 +44 (0)207 522 8294 anne-lise.bagur@aonbenfield.com marc.beckers@aonbenfield.com Irfan.akhtar@aonbenfield.com Aon Benfield 55 Bishopsgate London EC2N 3BD United Kingdom Tel: +44 (0) 20 7088 0044 Fax: +44 (0) 20 7578 7001 www.aonbenfield.com Copyright 2013. Registered office: 8 Devonshire Square, London EC2M 4PL. Aon UK Limited is authorised and regulated by the Financial Conduct Authority. Aon UK Limited trading as Aon Benfield (for itself and on behalf of each subsidiary company of Aon Plc) (‘Aon Benfield’) reserves all rights to the content of this report (‘Report’). This Report is for distribution to Aon Benfield and [insert Client name] (‘you’ ‘your’) only. Copies of the Report may be made by you and used within your organisation only. No copies shall be made for any other purpose. You agree that this Report may not be distributed in whole or in part to any third party without both (i) the prior written consent of Aon UK Limited trading as Aon Benfield (‘Aon Benfield’ or ‘us’) and (ii) the third party having first signed a’ recipient of report’ letter in a form acceptable to Aon Benfield. You agree that Aon Benfield has no liability to any third party to whom this Report is disclosed, whether disclosed in compliance with the preceding sentence or otherwise. This Report has been prepared using information that may be specific to you, and accordingly the content must not be assumed to be of general application. You acknowledge that this Report does not replace the need for you to undertake your own assessment of the proposed reinsurance programme or the likely distribution of gross losses for the subject portfolio. To the extent this Report expresses any recommendation or assessment on any aspect of risk, you acknowledge that any such recommendation or assessment is an expression of Aon Benfield’s opinion only, and is not a statement of fact. You acknowledge and agree that a decision to rely on any such recommendation or assessment of risk is entirely your responsibility. You agree that Aon Benfield will not, in any event, be responsible for any losses that may be incurred by any party as a result of any reliance placed on any such opinion. This Report includes results from the actuarial and other technical analysis undertaken to prepare a reinsurance proposal for you in respect of the subject portfolio. Where reference is made to any such analysis or the analysis results, this is solely to help you understand the analysis undertaken by Aon Benfield in preparing this reinsurance proposal, and you agree that is shall not be used, in whole or in part, for any other purpose. Neither this Report nor the analysis underlying it is intended to replace any and all analyses and/or investigations that the recipient might consider necessary to satisfy themselves as regards the suitability of the proposed reinsurance programme or the likely distribution of gross losses for the subject portfolio. The recipient acknowledges that in preparing this Report, Aon Benfield may have based analysis on data provided by you and/or from third party sources. This data may have been subjected to mathematical and/or empirical analysis and modelling. Aon Benfield has not verified, and accepts no responsibility for, the accuracy or completeness of any such data. In addition, you acknowledge that any form of mathematical and/or empirical analysis and modelling (including that used in the preparation of this Report) may produce results which differ from actual events or losses. The analysis contained in the Report has been undertaken from the perspective of a reinsurance broker and does not constitute a qualified or qualifying actuarial report. You acknowledge and agree that Aon Benfield has not undertaken any formal or expert actuarial review for you, and that the Report does not constitute an opinion of reserving levels or accounting treatment. This Report also does not constitute any form of legal, accounting, taxation, regulatory or actuarial advice. The assumptions are an integral part of this Report. You acknowledge that there are material limitations in respect of the data on which the Report is based including but not limited to availability of data and consequently that the Report may be inaccurate. The Report must be read in full or you may draw inappropriate or unintended conclusions.
You can also read