Summary Report QUANTITATIVE DATA - A Seat at the Table Gallatin Valley
←
→
Page content transcription
If your browser does not render page correctly, please read the page content below
Summary Report
Q UA N T I TAT I V E DATA

Conversations Create New Possibilities

Nearly two years ago, Bozeman Area Community Foundation and Future West, alongside a
steering committee began to convene a group of nonprofits around how state and federal
budget cuts, compounded by community growth, was affecting nonprofits’ work.

Each month, the conversation began to grow. Brilliant ideas were being sparked through these
conversations. It became clear that the conversation we were having with nonprofits needed
to be occurring all around the community - we could not be insular. What did we love about
this place? What are challenges that we’re facing? What are solutions that we bring to the table
around these challenges?

It was through this desire to better understand the challenges people of Gallatin County face,
learn about their ideas to improve their communities, and help create more engaged citizens -
especially those who aren’t typically engaged – that we initiated A Seat at the Table.

                                                        Summary Report - 2019 | A Seat At The Table   1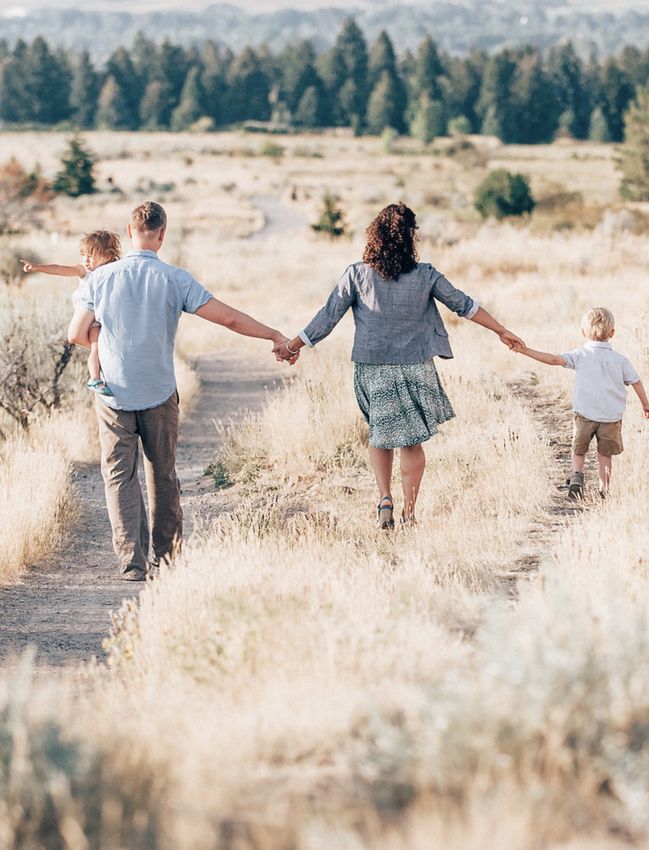
This was not a new idea. Inspired by the On the Table program initiated in 2013 by The Chicago
Community Trust to promote civic engagement, the Knight Foundation has invested over
three million dollars over three years to expand the idea in ten communities across the country.
The Knight Foundation had previously worked with Gallup polling to find out what makes a
successful community. They found that citizen attachment to the community is a crucial
component of community success.
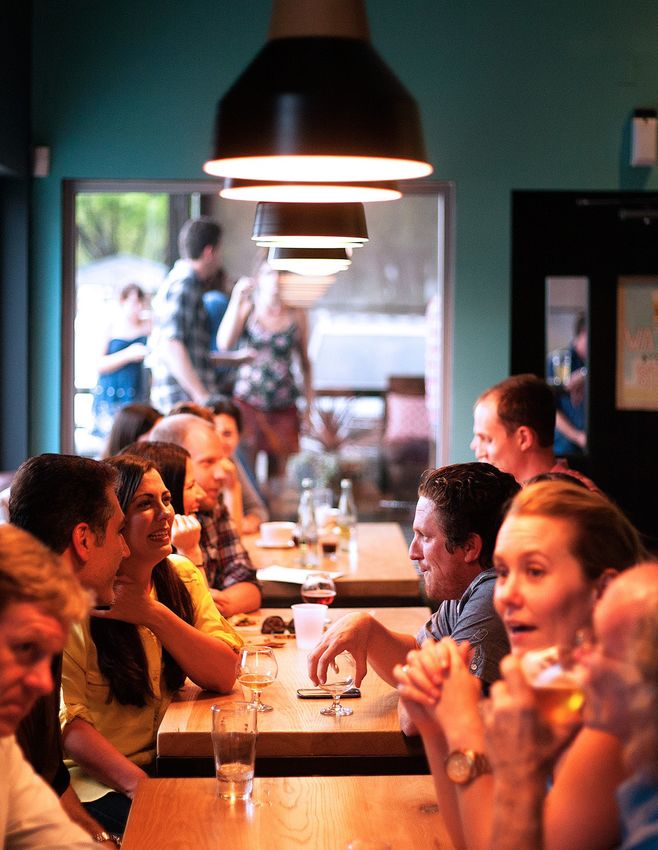
A Seat at the Table was a simple idea but one that took a lot to accomplish. In one day, our
entire county would come together over mealtime conversations in small groups to discuss
how to collaboratively build and maintain strong, safe and dynamic communities. Without the
financial support of Gallatin County, the City of Bozeman, the City of Belgrade and several
other supporters, we could not have accomplished our goal.
In actuality, these conversations took place over a two-week period in the latter part of
October 2018 with over 100 volunteers hosting “tables” in homes, faith communities, schools,
nonprofits, detention center, and on and on. Over 900 people across the county participated in
small group conversations and hosts and participants alike filled out a survey to capture
thoughts and ideas.
In today’s world, this act of coming together has never been more
important. Talking – and listening – to our neighbors is an
important first step toward creating a more connected and
engaged community. We can create better plans for a better
future when residents, organizations, businesses, and
government work together to make contributions that add up to
greater solutions than we can achieve individually.
Summary Report - 2019 | A Seat At The Table 2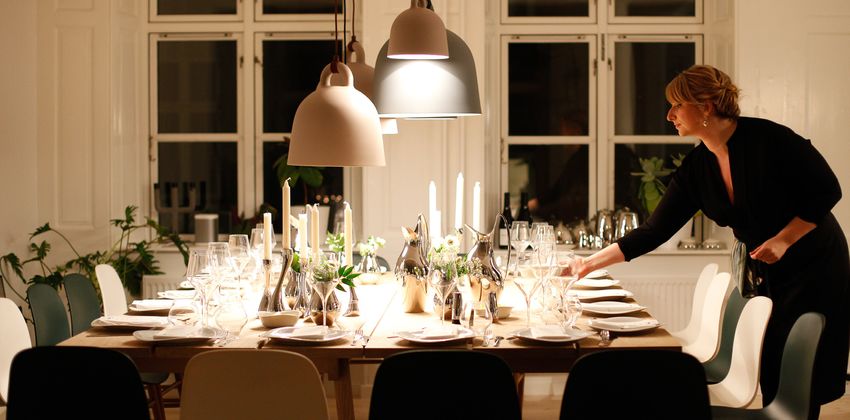
Methods and Results

The quantitative and qualitative data was voluminous. Partnership with the HELPS Lab and
Amber Raile, Ph.D, Associate Professor of Management and Director of Business
Communication Curriculum in the Jake Jabs College of Business & Entrepreneurship at Montana
State University was essential in compiling this report and the summary qualitative data report.

Going forward, the steering committee will make in-person presentations to our city and
county leaders and interested non-profit partners to help inform their strategic plans and
growth policy processes.

  Seat at the Table Conversations Hosts posed three
  questions to participants:

  1. What do you love most about your community?
  2. What are the most pressing challenges in your community?
  3. What are your ideas for making your community better?

Over 100 tables and 900 community members participated. Overwhelmingly, participants love
living in our beautiful location and value the plentiful recreational opportunities and open
space in a friendly, safe community. Community members want to participate in preserving
what they love about the area through responsible growth while making sure living here is
affordable for everyone.

After their conversations, both hosts and community member participants described their
discussions and opinions through surveys.

                                                        Summary Report - 2019 | A Seat At The Table   3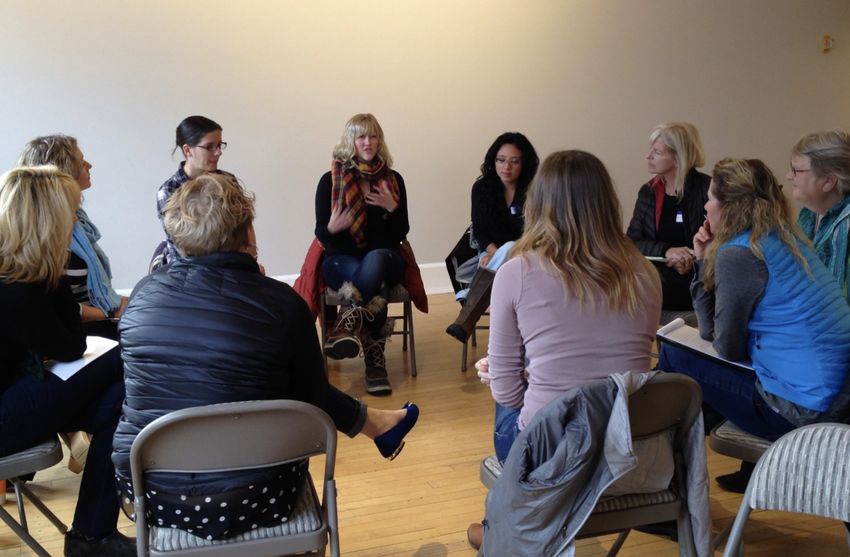
Data and Demographics

Data

       The data in this report is generally presented as a summary for all
       participants across the county. In some cases community specific results
       are reported and labeled according to local respondents. The rural
       communities category includes Amsterdam, Manhattan, Churchill,
       Willow Creek and Three Forks. Our survey was 100% voluntary, therefore
       not all respondents answered all questions, resulting in different
       response numbers on each question. For a more detailed look, we
       encourage you to download the raw data for review or further analysis.

Age

                                    55-64
                                    (101)

                                               65+
                                              (116)
                    45-54
                    (109)                                PREFER NOT TO SAY (3)

                                                         18-21 (13)

                            35-44           22-34
                            (111)           (134)

                                                      Summary Report - 2019 | A Seat At The Table   5
Data and Demographics

Ethnicity

                                                           ASIAN (6)

                                                 PREFER
                                                 NOT TO                OTHER (6)
                                                 ANSWER
                                                   (10)
                                                                                   BLACK OR AFRICAN
                                                                                   AMERICAN (3)
     WHITE
     (554)                                                                         MIDDLE EASTERN
                                             AMERICAN                              OR NORTH AFRICAN (2)
                                             INDIAN OR
                                              ALASKAN                              NATIVE HAWAIIAN
                                             NATIVE (13)                           OR PACIFIC ISLANDER (1)
                                                            HISPANIC,
                                                             LATINO,
                                                           OR SPANISH
                                                           ORIGIN (15)

Education

                   BACHELOR’S DEGREE (240)

                    GRADUATE DEGREE (234)

      ASSOCIATE/JUNIOR COLLEGE DEGREE (66)

             HS DIPLOMA OR EQUIVALENT (40)

                 LESS THAN HIGH SCHOOL (3)

                                                Summary Report - 2019 | A Seat At The Table                  6
Respondent Location

                                      M AN HAT TAN (14)
TH R E E FO R K S -WI LLOW CR E E K (15)                      D RY CR E E K (4)

                                                                            SPR I N G H I LL (8)
                                   R IV E R RO CK (8)
                                                                    B E LG R AD E (49)
            AMSTE R DAM - CH U RCH I LL (3)

                                                                        VALLE Y CE NTE R (8)                          WE ST O F
                                                                                                                      19TH AV E
                                                                                                                      & SOUTH
                                              FOU R CO R N E R S (22)                                                 O F M AI N
                                                                                                                       STR E E T         E A ST O F 19TH AV E
                                                                                                                         (37)            & N O R TH O F M AI N
                                              GALL ATI N GATE WAY (7)                                                                        STR E E T (73)

                                                                                                     WE ST O F 19TH AV E &
                                                                                                      N O R TH O F M AI N
                                                                                                         STR E E T (95)
                                             GALL ATI N C ANYO N (3)

                                                                                                                                    E A ST O F 19TH AV E &
                                                                                                                                   SOUTH O F M AI N STR E E T
                                                                                                                                             (169)

                                      B I G SK Y (40)

                                                                                                                             BOZ E M AN (374)

                                            SOM E WH E R E E L SE I N
                                             GALL ATI N CO. (20)

                                                    WE ST Y E LLOWSTO N E (3)

                                                                                                   Summary Report - 2019 | A Seat At The Table                   7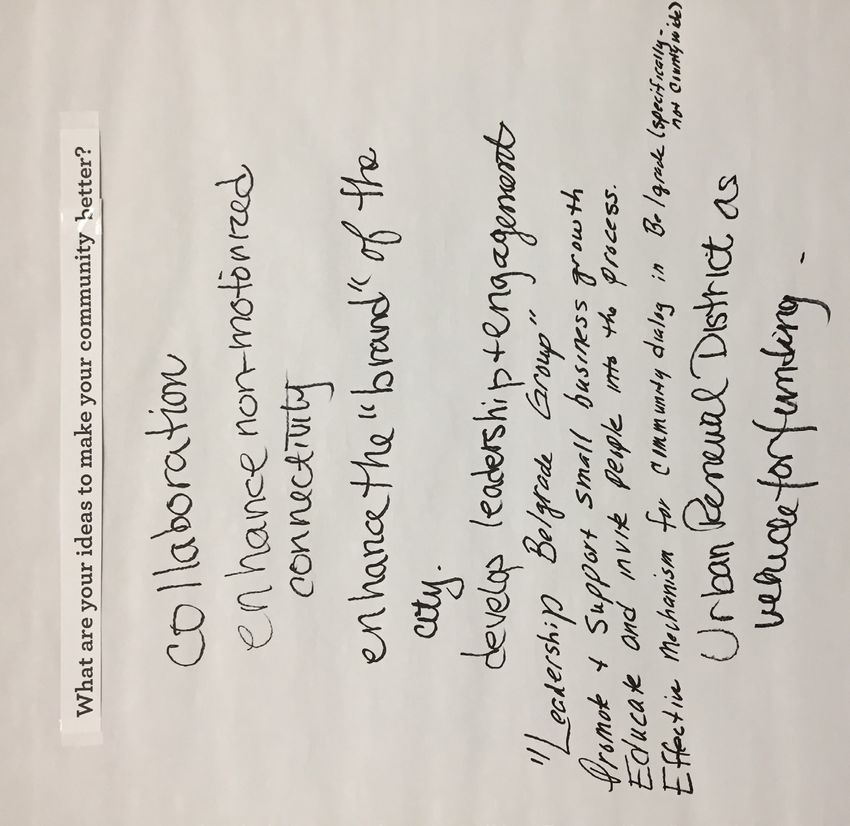
Respondent Location

               B E L G R A D E 						 8 . 4 8 %		 49
    BELGRADE

               D R Y C R E E K 						 0 . 69 %		 4

               R I V E R R O C K 						 1. 3 8 %		 8

               S P R I N G H I L L 						 1. 3 8 %		 8

               B I G S K Y 						6 .92 %		 4 0
   SK Y
   BIG

               G A L L AT I N C A N YO N 					 0 . 52 %		 3

               A M S T E R D A M - C H U R C H I L L 				 0 . 52 %		 3
    RURAL

               M A N H AT TA N 						 2 . 42 %		 14

               T H R E E F O R K S - W I L L O W C R E E K 				 2 . 6 0 %		 15

               S O M E W H E R E E L S E I N G A L L AT I N C O U N T Y 		     3 . 4 6%		    20
    OTHER

               W E S T Y E L L O W S T O N E 					 0 . 52 %		 3
   CORNERS

               G A L L AT I N G AT E WAY 					1. 21%		7
    FOUR

               F O U R CO R N E R S 					3 . 81%		2 2

               B O Z E M A N : W E S T O F 19 T H & N O R T H O F M A I N 		   16 . 4 4%		   95

               B O Z E M A N : W E S T O F 19 T H & S O U T H O F M A I N 		   6 . 4 0 %		   37
    BOZEMAN

               B O Z E M A N : E A S T O F 19 T H & N O R T H O F M A I N 		   12 . 63% 		   73

               B O Z E M A N : E A S T O F 19 T H & S O U T H O F M A I N 		   29. 24% 		    169

               VA L L E Y C E N T E R 					 1. 3 8 %		 8

                                                                 Summary Report - 2019 | A Seat At The Table   8
Love for the Community
QUESTION:
What do you love most about your community?
(Choose your top 3)
PHYSIC AL BE AUT Y
FRIE NDLY
RECRE ATION
SAFE
OPE N SPACE
HE ALTHY COMMUNIT Y
E DUC ATIONAL OPPORTUNITIES
SOCIAL OPPORTUNITIES
OTHE R
ECONOMIC OPPORTUNITIES
0 50 100 150 200 250
50 100 150 200 450
B E LG R AD E BIG SKY RU R AL FO U R OTH E R BOZ E M AN
CO R N E R S
“Our
“The community is
outdoors. The large enough to have
environment. The diversity and an economy
mountains.” that can support
professionals, but it still
feels like a tight knit
community.”
“The people
here are so
passionate, come
together and truly
love our
community.”
“Vibrant
downtown in a
naturally beautiful
environment”
Summary Report - 2019 | A Seat At The Table 9Community Challenges
QUESTION:
What are the most pressing challenges in your
community? (Choose your top 3)
AFFORDABLE HOUSING
GOOD PAYING JOBS, ECONOMIC SECURITY, & UPWARD ECONOMIC MOBILITY
LOC AL GOVE RNME NT PL ANNING & COORDINATION
ENVIRONMENTAL (AIR, WATER, LAND) CONCERNS & CONSERVATION
AVAIL ABILIT Y OF ME NTAL HE ALTH RESOURCES
STRE ETS, ROADS, BRIDG ES, & HIG HWAYS
AFFORDABLE CHILD C ARE
OTHE R
PUBLIC TR ANSPORTATION
OPE N SPACE , PARK S & RECRE ATION
AFFORDABLE HE ALTHC ARE
YOUTH INVOLVEME NT IN THE COMMUNIT Y
AG RICULTUR AL PRODUC TION
E DUC ATION & SCHOOLS
RE DUCING HOME LESSNESS
AVAIL ABILIT Y OF ADDIC TION RESOURCES
RACE RELATIONS, DISCRIMINATION, & SOCIAL JUSTICE
HUNG E R & FOOD INSECURIT Y
PUBLIC SAFET Y, CRIME , & VIOLE NCE
E ARLY CHILDHOOD DEVE LOPME NT
50 100 150 200 450
B E LG R AD E BIG SKY RU R AL FO U R OTH E R BOZ E M AN
CO R N E R S
Summary Report - 2019 | A Seat At The Table 10Community Knowledge and Goals
QUESTION:
Which of the following are your primary means
of learning about the community?
(Choose your top 3)
WORD OF MOUTH
LOC AL NEWSPAPE R
SOCIAL ME DIA
COMMUNITY GROUP OR NONPROFIT ORGANIZATION WEBSITE/NEWSLETTER
LOC AL R ADIO
LOC AL TE LEVISION
OTHE R
NE X TDOOR APP
LOC AL GOVE RNME NT WE BSITE OR NEWSLET TE R
RE LIG IOUS ORGANIZ ATION
50 100 150 200 250 300 350
50 100 150 200 250 300 350
QUESTION:
Residents have shared goals and priorities for
our community.
S T R O N G LY D I S AG R E E
(9) S T R O N G LY AG R E E
(32)
D I S AG R E E
(125)
AG R E E
(277)
NEITHER
(149)
Summary Report - 2019 | A Seat At The Table 11Sense of Community
QUESTION:
The area in which I live has a strong sense of
community.
BE LG R ADE
STRONGLY DISAGREE 2
DISAGREE 7
NEITHER 12
AGREE 41
STRONGLY AGREE 6
ALL R ESPONDE NTS
BIG SK Y
S T R O N G LY D I S AG R E E
STRONGLY DISAGREE 0 D I S AG R E E (5)
DISAGREE 4 (41)
NEITHER 3
AGREE 21
STRONGLY AGREE 12
NEITHER S T R O N G LY
RUR AL AG R E E
(5 6)
(151)
STRONGLY DISAGREE 0
DISAGREE 2
NEITHER 2
AGREE 16
STRONGLY AGREE 12
OTHE R
STRONGLY DISAGREE 1
DISAGREE 2
NEITHER 1
AGREE 11
STRONGLY AGREE 8 AG R E E
(322)
FOUR CORNERS
STRONGLY DISAGREE 0
DISAGREE 5
NEITHER 1
AGREE 18
STRONGLY AGREE 7
BOZEMAN
STRONGLY DISAGREE 2
DISAGREE 21
NEITHER 37
AGREE 215
STRONGLY AGREE 106
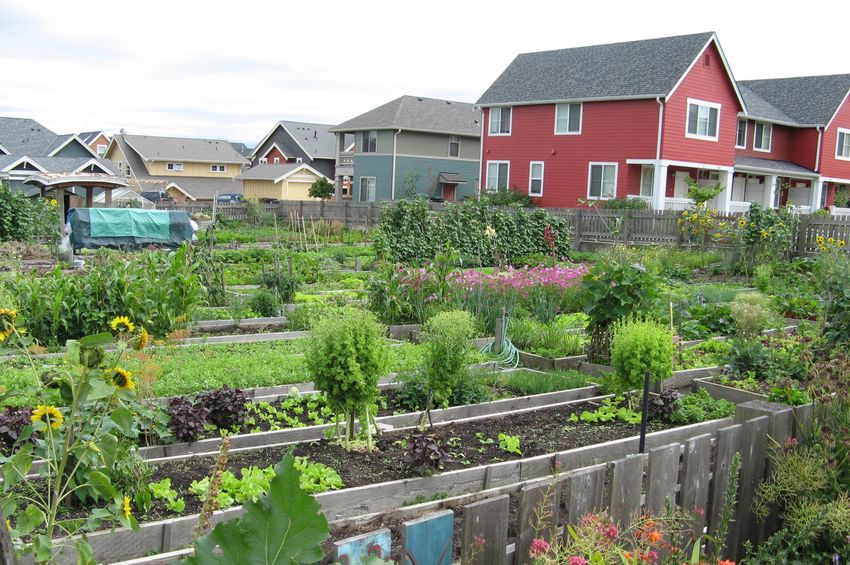
Summary Report - 2019 | A Seat At The Table 12Improving the Community QUESTION: What are your ideas for making your community better? During a Seat at the Table, we received many ideas on how community members hoped to make their community better. The scale of these ideas ranged from a local neighborhood improvements to regional programs that would serve community needs. The diverse ideas ranged from recycling initiatives to community gardens, from affordable housing to mental health program ideas. More ideas can be explored through our qualitative data that can be found in the “Conversation Summaries” report located on our website.
Opportunity for All

QUESTION:

Our community provides opportunities
for everyone.

            S T R O N G LY D I S AG R E E     S T R O N G LY AG R E E
                                                        (19)
                        (5 0)

                                                          AG R E E
                                                               (142)

                  D I S AG R E E
                      ( 238)

                                                   NEITHER
                                                      (143)

QUESTION:

How often have you been able to take part in
community events or celebrations?

  NEVER                RARELY               SOMETIMES                   OFTEN
   (6)                  (72)                  (291)                     (226)

                                                     Summary Report - 2019 | A Seat At The Table   14
Growth
QUESTION:
Were you aware that each of the following is in the
process of creating new plans for future growth?
500
500
300
300
100
100
–
Belgrade – Yes Belgrade – No Bozeman – Yes Bozeman
– No Gallatin County – Gallatin County
Yes No
BELGR ADE BOZEMAN GALLATIN COUNTY
Y E S - 57.75% (339) Y E S - 85. 24% (50 4) Y E S - 6 0. 85% (356)
N O - 42 . 25% (24 8) N O - 14 . 8 6% (8 8) N O - 39.15% (229)
QUESTION:
Our community is changing for the better.
S T R O N G LY D I S AG R E E S T R O N G LY AG R E E
( 25) ( 27)
D I S AG R E E
(131)
AG R E E
( 219)
NEITHER
(191)
Summary Report - 2019 | A Seat At The Table 15Inspired to take action “More conversations are necessary. More events like Seat at the Table where [we] can voice [our] opinions and feel heard.” “Our ‘table’ individually and as a group was inspired to take action and do something to improve their neighborhood like cleaning up around the neighborhood on a regular basis. We talked about doing something as a group to help someone else or improve the community in some small way and not wait for the local government or “someone else” to do it; one idea that came out of this was to inspire all the ‘seats at the table’ groups to commit to doing something positive in their community.”
Positive Impact

               QUESTION:

               How much impact do you believe people like you
               have in making your community a better place?

                        NONE (14)

                    A LIT TLE (101)

                       SOME (272)

                       A LOT (208)

               QUESTION:

               Who do you believe is having the greatest
               positive impact on your community?
               (Choose your top 2)

  NONPROFIT ORGANIZ ATIONS

                    SCHOOLS

     BUSINESSES & EMPLOYE RS
         COMMUNIT Y G ROUPS &
NE IG HBORHOOD ASSOCIATIONS
         LOC AL GOVE RNME NT

          PL ACES OF WORSHIP

 PUBLIC SAFET Y DE PARTME NTS

                      OTHE R
                                   0          50        100        150          200       250         300   350

                                             50       100         150          200       250          300   350

                           B E LG R AD E   BIG SKY   RU R AL   FO U R          OTH E R   BOZ E M AN
                                                               CO R N E R S

                                                                          Summary Report - 2019 | A Seat At The Table   17
Thank you to our
Steering Committee and Donors:
STE E RING COMMIT TE E: A L I S O N H A R M O N , B R I D G E T W I L K I N S O N , C AT H Y CO S TA K I S ,
J E N N I F E R B OY E R , R A N DY C A R P E N T E R , A N D T I F FA N Y M A I E R L E
DONORS: B I L L CO C H R A N , B OZ E M A N A R E A CO M M U N I T Y F O U N DAT I O N , C AT H Y CO S TA K I S ,
FU T U R E W E S T, G A L L AT I N CO U N T Y, J E N N I F E R B OY E R , J I M M A D D E N ,
L E A D E R S H I P M O N TA N A , M O N TA N A S TAT E U N I V E R S I T Y, T H E C I T Y O F B E LG R A D E ,
T H E C I T Y O F B OZ E M A N , A N D T OW N S E N D CO L L E C T I V E
Summary Report - 2019 | A Seat At The Table 18So why does this matter?
Why would we invest all of this time and energy into doing this simple
initiative? Because it works. There are community foundations large and
small all around the US that have hosted similar initiatives with community
partners that have yielded powerful results and outcomes.
Our community is growing and changing. We all know this. At times we all
feel this tension of growth. This act of coming together has never been
more important. There is no single business, city or county entity,
nonprofit or neighborhood that can address our community challenges
and opportunities alone.
What does success look like
for A Seat at the Table?
Success for this initiative would be more engaged community members
that feel a sense of ownership over our future. Success would be all of us
leveraging this community member feedback that businesses, nonprofits
and city and county leaders can all use to make more informed decisions
about our work. Success would be inspired action that stems from these
conversations. Success would be moving these ideas generated at these
tables to our neighborhoods by all of us pitching in.
Summary Report - 2019 | A Seat At The Table 19You can also read