United States (USA) Country Report - B2CDirect - Strategic Business Analyst Unit - Your Cross-Border Solutions Expert - GOB2C
←
→
Page content transcription
If your browser does not render page correctly, please read the page content below

Your Cross-Border
                    Solutions Expert

United States (USA) Country Report
                       eCommerce & Cross-Border

  B2CDirect – Strategic Business Analyst Unit
  Innovation Driven 3rd Party Logistics and Cross-Border eCommerce Facilitator / 2018
EUR 10M+                 200.000+                     78+
                           Exports Value Managed by       Total Count of          Total of Countries
                              B2CDirect Solutions        Parcels Delivered        Parcels Delivered

MEET WITH                                              29                                1M+ (TRY)
                         40             26%                                  20
B2CDirect               Team           Women          Average          R&D Team            Total R&D
                       Members        Employees         Age            Members            Investment

        Specifically Founded to Serve and Drive Innovation for The Needs of Developing
     Worldwide Cross-Border eCommerce & B2C Parcel Delivery Businesses. Proven Track
      Record in Logistics and eCommerce with 20+ Years of Total Experience and Practices

       Key
     Partners
     & Clients
Foreword
Borderless, Limitless, Connected

Embrace the new Global eCommerce. We’re more
connected than ever been, businesses are borderless,
consumers are limitless and things are just one click away.

According to the Accenture’s The New Delivery Paradigm
report, Global eCommerce growth will be over 25% while
Domestic growth expected to be only 20%.

Get ready!
Global eCommerce is the biggest disruptive happening and
changing the industry dynamics and consumer behaviors.

This report is designed to assess the challenges and the
opportunities for businesses which actively seek to expand
their footprint worldwide, and what they need to do to
succeed.
B2CDirect / Global eCommerce Intelligence Report / 2018

Topics mentioned in the presentation;
1.) USA Market Overview
2.) USA Some Brief Facts
3.) Population, Internet Users & Online Shoppers
4.) GDP & GDP Per Capita
5.) E-commerce & Cross Border E-commerce Statistics
6.) Popular E-commerce Sites & Social Media Platforms
7.) Top Online Retail Categories ( Domestic & Cross Border)
8.) Payment Methods For Online Shopping
9.) Customer Behaviors In Cross Border Online Shopping
10.) Opportunities & Threats
B2CDirect / Global eCommerce Intelligence Report / 2018

                    USA MARKET OVERVIEW

➢ America is the land of opportunity and a superpower in the world of online sales. It
  has the world’s largest economy and it’s a global leader when it comes to cross-
  border ecommerce exports and imports. It’s the birthplace of ecommerce giants,
  such as eBay and Amazon.
➢ Amazon is the dominant retail ecommerce platform in the U.S. and one of the
  country’s top five digital properties overall.
➢ The U.S. is comprised of savvy, internationally-minded consumers who are well-
  acquainted with online shopping. U.S. millennials (18-34 year olds) and females are
  most likely to buy digitally.
➢ Customer satisfaction and confidence levels are relatively high in the U.S., but so are
  customer expectations. To a large extent, the U.S. is similar to European
  marketplaces and European consumer behaviour.
➢ According to a Pew Research Center survey (2016), about 8 in 10 Americans are
  online shoppers. 79% have made an online purchase of some type. To compare,
  when Pew first asked about online shopping in 2000, only 22% of Americans had
  made a purchase online.
B2CDirect / Global eCommerce Intelligence Report / 2018

                 USA MARKET OVERVIEW

➢ Roughly 1 in 10 U.S. adults have shared their opinions about products or
  companies on social media.
➢ A majority of US online shoppers are very open to purchasing goods and
  services from international merchants, with 42% having done so, according to
  research carried out by Ipsos for Bronto Software in December 2016.
➢ Email marketing is still a key tool in marketing to the US consumer. Ensure the
  offer is valid and that priority is given to relevance
➢ The vast majority of U.S. consumers are more likely to make a purchase when
  free shipping is included. More than half of consumers, in turn, are more
  willing to buy products when there’s a possibility of free returns and
  exchanges.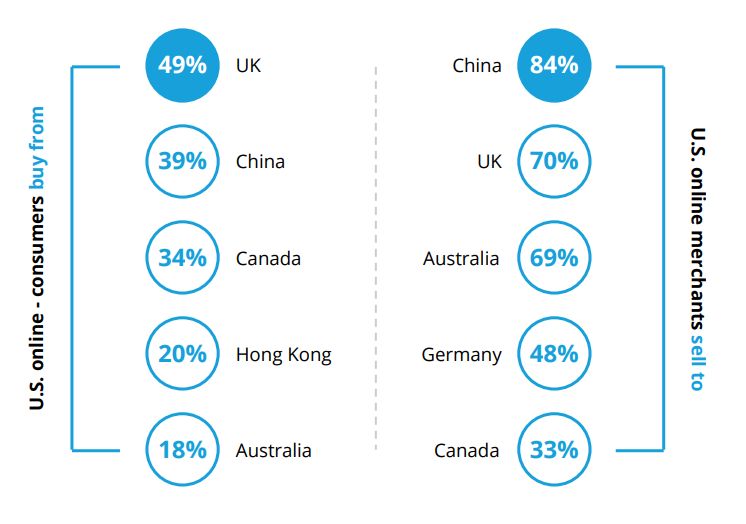
B2CDirect / Global eCommerce Intelligence Report / 2018

                         USA SOME BRIEF FACTS

   Top 3 import destinations                                     Top preferred online payment methods

 CHINA                                                 14%

    UK                                     10%

CANADA                         7%

   Top 3 export destinations

CANADA                                                 16%

MEXICO                                           14%

  CHINA                             9.3%
B2CDirect / Global eCommerce Intelligence Report / 2018

POPULATION, INTERNET USERS & ONLINE SHOPPERS

313,6       316             318,3          320,7         323,1       325,5                            GDP       GDP Per Capita
                                                                                        Year
    249,7         267,1          279,1          283,7        286,9           287                ( Trilyon USD )    ( USD )

                                                                                        2012        16,16           51,4
                                                                                        2013        16,69          52,74
                                                                                        2014        17,43          54,67
                                                                                        2015        18,12          56,44
                                                                                        2016        18,62          57,61
                                                                                        2017        19,36           59,5

 2012        2013              2014          2015            2016      2017
                          Population     Online Population
                          (Million)      (Million)
B2CDirect / Global eCommerce Intelligence Report / 2018

POPULATION, INTERNET USERS & ONLINE SHOPPERS
  Number Of Online Shoppers In Usa                      Number Of Mobile Shoppers In The United States
            (In Millions)                                      From 2013 To 2018 (In Millions)

                                   223.7       230                                                   198.8
                                                                                             188.4
                 204   210.2 216.9                                                   177.4
  191    197.6                                                               166.2
                                                                     145.9
                                                             122.9

  2015   2016 2017(f) 2018(f) 2019(f) 2020(f) 2021(f)        2013    2014    2015    2016    2017     2018
B2CDirect / Global eCommerce Intelligence Report / 2018

     E-COMMERCE & CROSS BORDER E-COMMERCE STATS

              E-commerce Activities In Past 30 Days

Made an online purchase via a mobile                                   Number of people                 E-commerce
              device
                                          33%                           purchasing via                  penetration
                                                                         e-commerce

Made an online purchase via a laptop                                197.6
            or dekstop
                                                57%                                                   61%
                                                                    Million

Purchased a product or service online             67%
                                                                            Total value of                Average annual
                                                                        national e-commerce            e-commerce revenue
                                                                           market in 2016                 per user ın 2016
         Visited an online retail store                 79%
                                                                      $ 322.2                          $ 1,630
     Searched online for a product or                                 Billion
             service to buy
                                                      75%
B2CDirect / Global eCommerce Intelligence Report / 2018
E-COMMERCE & CROSS BORDER E-COMMERCE STATS
Ecommerce Sales Average Spending Per E-Shopper
2012 – 2017(f) (Dollars, Billions) 2014-2017(f), USD
2.209
$438 2.098
$399 1.888
1.752
$339
$298
$260
$230
2012 2013 2014 2015 2016 2017(f) 2014 2015 2016 2017(f)B2CDirect / Global eCommerce Intelligence Report / 2018
E-COMMERCE & CROSS BORDER E-COMMERCE STATS
The U.S. is one of the largest cross-border
B2C ecommerce markets when it comes to
both exports and imports. The most
intensive B2C ecommerce trade between
the U.S. and the UK is the result of the
common linguistic background. A popular
destination for online shopping is also China.
More than a half of online sellers in the
States sell to international online shoppers,
often focusing on those based in Europe.B2CDirect / Global eCommerce Intelligence Report / 2018
POPULAR E-COMMERCE SITES & SOCIAL MEDIA
Top 10 US Retail Websites Most Popular Mobile Shopping Apps By Reach
By Unique Monthly Visitors July 2017
Amazon 41.5%
Walmart 18.8%
Groupon 15.5%
eBay 13.8%
shopkick 12.30%
Checkout 51 10.8%
Most Popular Online Stores letgo 7.4%
By Net E-commerce Sales, 2016 Wish 7.4%
Walgreens 6.5%
Net E-commerce Sales
Online Store OfferUp
(million USD) 4.5%
Amazon.com $46372.14 Kroger 4.5%
Walmart.com $11432.69
Target 4%
Target.com $3253.82B2CDirect / Global eCommerce Intelligence Report / 2018
POPULAR E-COMMERCE SITES & SOCIAL MEDIA
Most Active Social Media Platforms Number Of Social Media Users In Millions
2017 2014-2020
72% 72% 202.8
199.4
195.3
190.7
185.6
39% 38% 180
35%
29% 173.6
27%
18%
FACEBOOK YOUTUBE TWITTER INSTAGRAM PINTEREST GOOGLE+ LINKEDIN TUMBLR
2014 2015 2016(f) 2017(f) 2018(f) 2019(f) 2020(f)B2CDirect / Global eCommerce Intelligence Report / 2018
TOP ONLINE RETAIL CATEGORIES (DOMESTIC & CROSS BORDER)
Leading Product Categories Bought Online Among Internet
Users In The USA By Gender
57%
Clothing or shoes
39%
46%
Beauty/personal care products
22%
30%
Food items According to Statista, leading product
37%
22%
categories purchased online among
Nonfood household care products users in the U.S. include (as of June
21%
17% 2016, for both males and females):
Consumer electronics ➢ Clothing or shoes
25%
23% ➢ Food items
Petcare products
15% ➢ Beauty / personal care products.
10%
Babycare products
7%
73%
Any of these
63%
27%
None of these
37%
Female MaleB2CDirect / Global eCommerce Intelligence Report / 2018
TOP ONLINE RETAIL CATEGORIES (CROSS BORDER)
What Do Americans Like To Purchase From Abroad?
The top 10 categories on
the basis of thousands of
international transactions
on eBay (the data comes
from the first half of 2017).B2CDirect / Global eCommerce Intelligence Report / 2018
PAYMENT METHODS FOR ONLINE SHOPPING
Top Online Payment Methods
In Percentage Of Total Online Purchases ➢ The US payments market is dominated by cards.
Together, credit, debit, prepaid and charge cards
represent around 72% of all online payments in
4% 4%
the US.
5% ➢ Visa is the card payments market leader with just
7% over 50%, followed by MasterCard (~25%) and
38% American Express (~15%).
15% ➢ Still, eWallets are on the rise, riding on the back of
growing mobile commerce. PayPal is still the most
popular eWallet, but is threatened by new digital
27%
wallets, such as Apple Pay, Google Wallet and
Android Pay.
Credit Cards
Debit Cards
eWallet (Paypal, Google Wallet, Apple Pay)
Bank Transfers
Pre-paid
Cash on Delivery
OthersB2CDirect / Global eCommerce Intelligence Report / 2018
CUSTOMER BEHAVIORS IN CROSS BORDER ONLINE
SHOPPING
REASONS FOR NOT BUYING ABROAD MOTIVATIONS FOR BUYING ABROAD
Reasons why US e-shoppers are hesitant Reasons why US e-shoppers buy cross-border
to buy cross-border
Not trusting foreign sites 23% Trustworthiness 11%
Broader range of products 12%
Assuming delivery takes longer 24%
Better quality 13%
Assuming returning is
25%
difficult/costly
Better conditions 21%
Never occured 28%
Better availability 29%
Own country meet my needs 38% Appealing offer 30%B2CDirect / Global eCommerce Intelligence Report / 2018
OPPORTUNITIES & THREATS
➢ First, America speaks English: the world’s second most popular
language and the most popular language online. This gives you
access to millions of buyers from the U.S. and beyond.
➢ The second benefit of selling your product in the U.S. has to do
with the size and maturity of the market. This translates into
access to a very, very large number of online shoppers. Further
benefits include online savvy consumers, well-developed
infrastructure and an advanced payment culture.
➢ Third, technology adoption is quick among the U.S. population,
which gives online sellers a large number of marketing and
communication opportunities, e.g. via social media or apps.
➢ Finally, consider the strength of the U.S. as a country and the
notion of the U.S. ecommerce superpower. Many foreign
businesses simply can’t help but target and keep the U.S. in their
country portfolio. The market’s sales potential and its leading
position seem to outweigh the initial burden of barriers to entry.
➢ The US population is relatively young. In general, younger people
shop online more often.B2CDirect / Global eCommerce Intelligence Report / 2018
OPPORTUNITIES & THREATS
➢ First, after entering the U.S. market, which is pretty challenging in itself,
you must face the challenges of strong domestic competition, changing
demographics, rapidly transforming technology and high consumer
expectations.
➢ Second, taxes in the U.S. are an exceptionally complex topic with many
different state and local sales taxes. Some online retailers don’t show the
tax owed until the buyer reaches the checkout page. This move,
however, may be very risky as a lot of consumers may, seeing
unexpected extra charges, abandon the shopping cart.
➢ Third, when it comes to the U.S. infrastructure, challenges relate to the
country size, the variety of landscape and the uneven concentration of
population. Logistics challenges may especially affect smaller and mid-
sized merchants. They may not have appropriate resources or may not
be able to compete without becoming part of a larger distribution
organization.
➢ Fourth, let’s consider the payments ecosystem and security, e.g. credit
card authorizations. It’s vital to be able to detect scammers and
fraudulent cards. To lower the risk, sellers can require AVS (Address
Verification System) on all transactions. This move, however, can make it
impossible for buyers to purchase goods from outside of the U.S. if their
regions are automatically rejected.
➢ The e-commerce revenue growth rate is steadily declining and
stabilizing.Your Cross-Border
Solutions Expert
Thank You
Contact Our Experts For More Information;
sales@b2cdirect.comYou can also read