Insights from modelling global shocks for the UK food system - University of Edinburgh - IFSTAL
←
→
Page content transcription
If your browser does not render page correctly, please read the page content below
Insights from modelling
global shocks for the UK
            food system
Peter Alexander, Almut Arneth, Roslyn Henry, Magnus
Merkle, Sam Rabin, Mark Rounsevell, Frances Warren

                         Peter.Alexander@ed.ac.uk
                            University of Edinburgh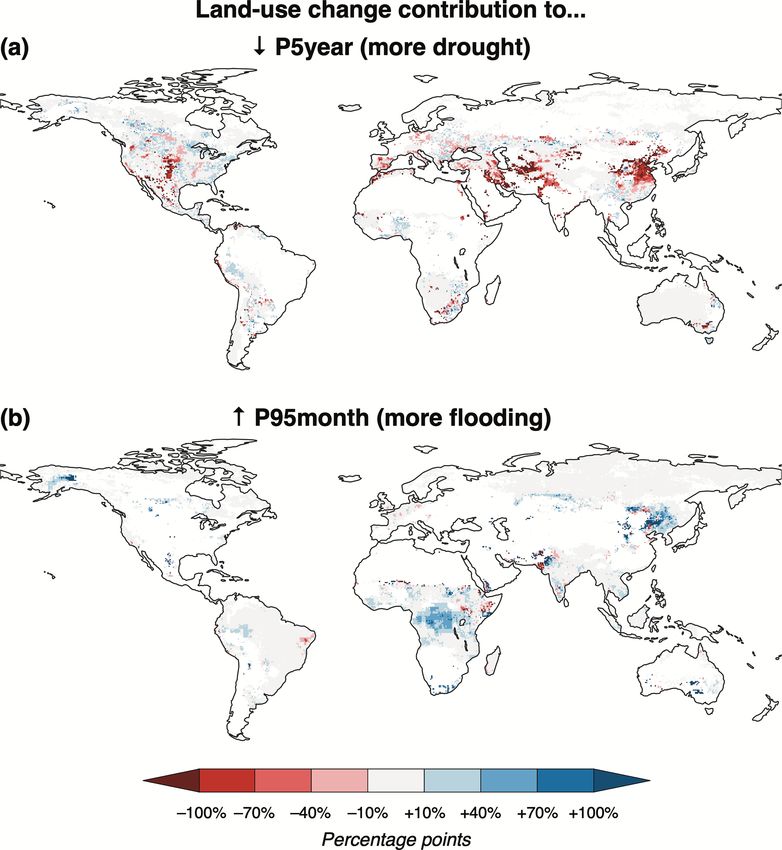
Project aims and objectives

             • Explore vulnerability & resilience of UK food
               system in a global context
                • to better understand the relationships to
                  potential global shocks and trends
                • take a food systems approach that integrates
                  biological systems, human behaviours, and the
                  environment
                • to identify actions that increase UK resilience

                                                                    2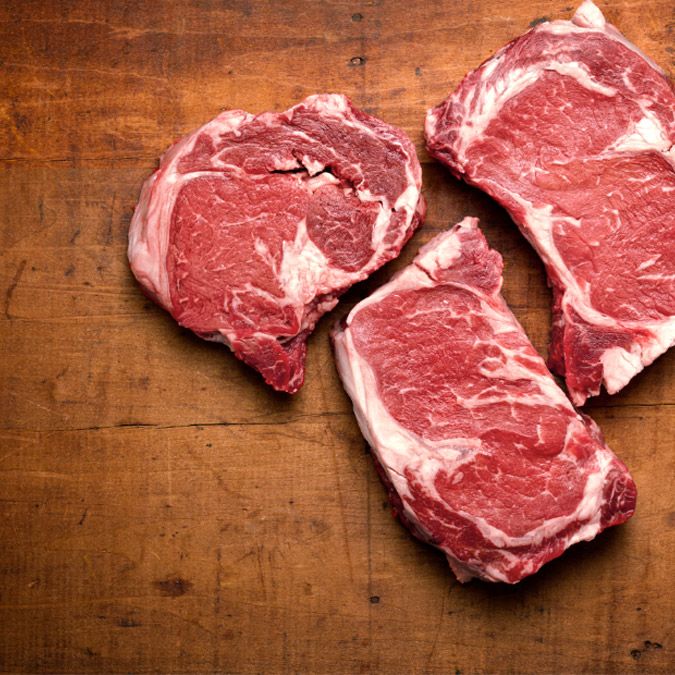
Conceptual approach

       1. Define potential            2. Measures             3. Identify & evaluate
       trends & shocks to the         resilience of UK food   actions to increase
       global food system             system                  UK resilience

            For each a shock or combinations of shocks

                             Outcomes for the UK
           Model of              • agricultural commodity
            global                 import/exports
             food                • UK production, land use
            system                 & intensity
                                 • Food prices

                                                                                       3
Scenario development examples

                                Hamilton, H. et al.
                                Exploring global food
                                system shocks,
                                scenarios and
                                outcomes. Futures
                                123, (2020).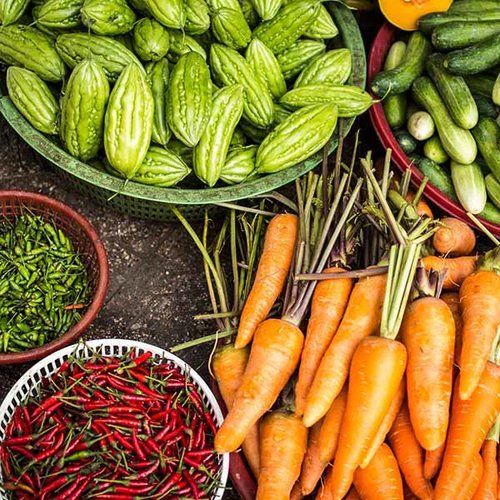
Land System Modular Model (LandSyMM)

Input scenarios, e.g.,                           Modelled outcomes, e.g.,
vClimate change                                  •     Food prices & trade
vPopulation & GDP                                •     Land use
vPolicies, e.g. tariffs and subsides             •     Agriculture intensity
vDietary preferences                             •     Ecosystem inidactors
vShocks                                          •     Diet & nutritional health

       LPJ-GUESS                   PLUM              MAIDADS              IMOGEN
      Process based            Land use change   Food demand             Climate and
        vegetation               and dynamic        system             greenhouse gas
          system               economic system                       forcing (in progress)
Model implementation example:
Land use and commodity production representation
Yield potential maps for each crop, fertilizer rate Used to create yield response to
and irrigation/rainfed. intensity for each crop and grid cell
a)
b)
Irrigation
815
6
Yie
Yield
10
++
Fertilisation
ld (t/h
4
(t/ha)
5
a)
2
10
00
9 500
60
8
400 1000
1000
IrIrriri50
Yield (t/ha)
7
6
ggaatio40300 800
800
5
tio n 600 /haa) )
4
n rra30 200 600 gh
atete ( 400 ratete(k(gk /
3
2
(liltit20 400
rere/ /m100 erra
200 Feertritl ieli r
1
0
m2210 200
)) 00 00 F
Spring
Maize, wheat, East
California Anglia,
Central UKUS
Valley,
Alexander, P. et al. Adaptation of global land
(52ºN, 0.5ºE)
(37ºN, 120ºW)
use and management intensity to changes in
climate and atmospheric carbon dioxide.
Glob. Chang. Biol. 24, 2791–2809 (2018). For each crop, year and climate scenario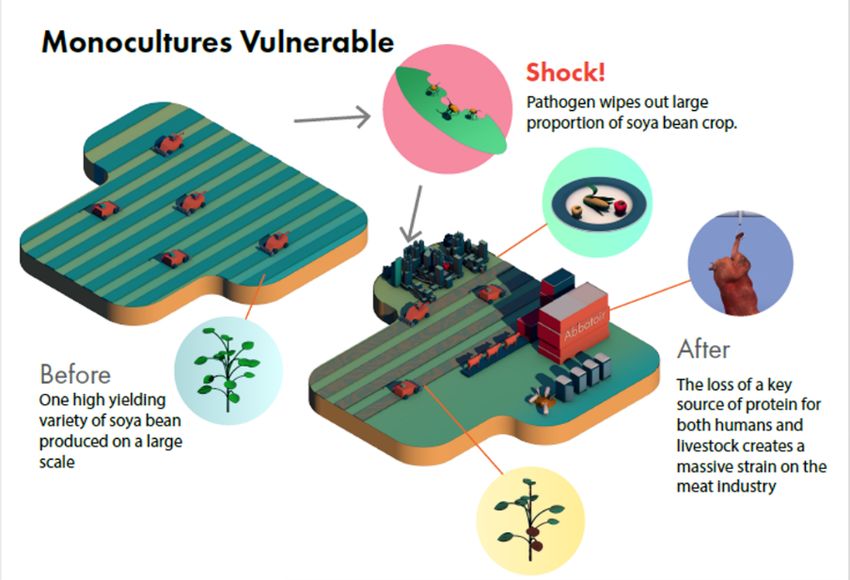
Projected agricultural expansion at 2100

      Mitigation challenges
      High population growth; Slow tech.
      improvement; Resource-heavy lifestyles

                                               Adaptation
                                               challenges
                                               High inequality;
Source: O’Neill et al. (2014)
                                               Barriers to trade

Socioeconomic                                  Climate
    Shared                  probabilistic    Representative
 Socioeconomic              mapping to       Concentration
Pathways (SSPs)                             Pathways (RCPs)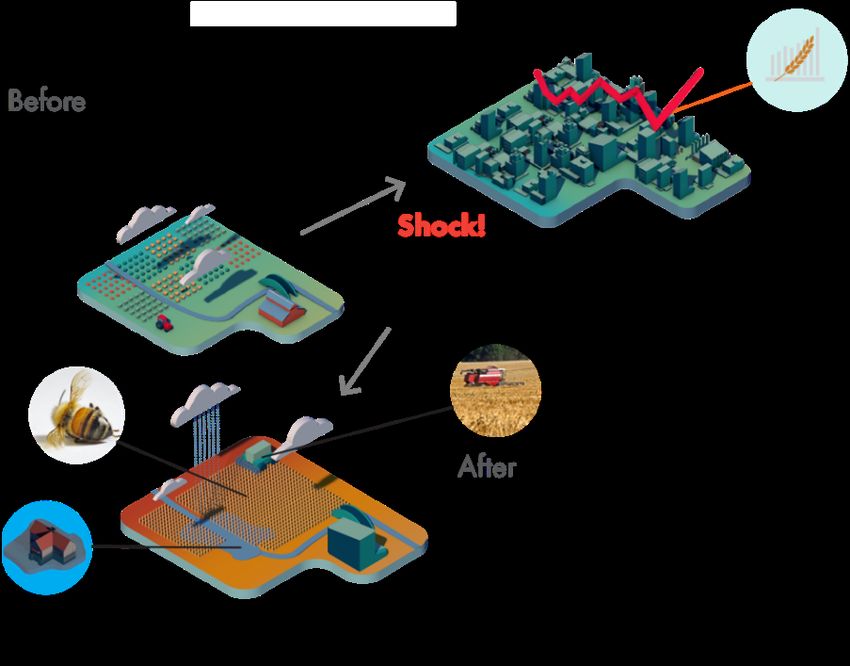
Change in ecosystem service indicators, 2001-2010 to 2091-2100
Ecosystem service
Beneficial
SSP1-45
+11% (+42 GtC)
SSP3-60
+6% (+22 GtC)
Veg. C (+) SSP4-60
indicators
+15% (+57 GtC)
SSP5-85
+23% (+89 GtC)
+2% (+31 GtC)
+1% (+18 GtC)
Total C (+) +3% (+56 GtC)
S. S. Rabin et al.: Impacts of future agricultural change on ecosystem service indicators 369 +4% (+78 GtC)
fertilizer information from IMAGE and MAgPIE. Strong in- -5% (-0.013 )
creases in fertilizer in those models resulted in strongly in- -6% (-0.017 )
Jan. albedo (+)
creased yields, but nitrogen limitation is alleviated at much -6% (-0.017 )
lower levels in LPJ-GUESS. IMAGE and MAgPIE fertiliza- -11% (-0.030 )
tion rates thus often exceeded what plants in LPJ-GUESS
could actually take up, resulting in high amounts of N loss. -8% (-0.076 )
Coupling LPJ-GUESS with PLUM
Jan. albedo, provides
borfor+tundra (+)for a more inter-
-12% (-0.108 )
-12% (-0.108 )
nally consistent estimate of future N losses, while still repro- -15% (-0.139 )
ducing historical fertilizer application well (Alexander et al.,
2018).
Indicator
+1% (+0.1 Mkm 2 )
One interesting pattern is that climate and management -13% (-1.7 Mkm 2 )
changes can have similar
Area: effects on N losses.
Biodiv. hotspots (+) SSP3-60 has -7% (-1.0 Mkm 2 )
global fertilizer application more than double by the end of -6% (-0.7 Mkm 2 )
the century, while SSP5-85 fertilizer application at end of Detrimental
the run is slightly lower than in 2011 (Fig. 2). This is re- +2% (+1 TgN)
flected in the N losses for the sXlum experiments, which in- +28% (+21 TgN)
crease 25 % by the 2090s with SSP3 but only 7 % with SSP5. +11% (+8 TgN)
However, in the full runs (sXlum_rYYclico2), SSP3- +22% (+16 TgN)
60’s N losses increase only about 27 % more than SSP5-85’s Neutral/varying
-3% (-1988 km 3 )
(Fig. 4). This is because the latter experiences higher average
-5% (-2936 km 3 )
global temperatures (increasing gaseousET losses)
( ) and a greater -5% (-3080 km 3 )
increase in runoff (increasing dissolved losses), due to the -9% (-5716 km 3 )
extreme RCP8.5 climate change scenario; in the constant-
Figure 6. Contribution of land use change in SSP5-85 to (a) LU (rYYclico2) experiments, N losses with RCP6.0 and +15% (+5528 km 3 )
decreasing P5year (drought) and (b) increasing P95month (flood- RCP8.5 increase by 15 % and 24 %, respectively. In either +21% (+7816 km 3 )
ing) between 1971–2000 and 2071–2100. White areas either did case – but especially under SSP3-60Runoff
– these( increases
)
in fer- +20% (+7377 km 3 )
not have decreasing P5year or increasing P95month , respectively,
tilizer usage and concomitant nitrogen pollution would exac- +31% (+11654 km 3 )
or were excluded due to low baseline runoff (after Asadieh and
erbate humanity’s already unsustainable impacts on nutrient
Krakauer, 2017). The contribution is calculated as the difference be-
cycling (Rockström et al., 2009).
Rabin, S. full
S. run
et and
al. constant-LU
Impactsrun of(i.e.,
future agricultural
-9% (-49 TgC)
tween the sXlum_rYYclico2 -24% (-133 TgC)
– rYYclico2). BVOC emis. ( )
change on ecosystem service indicators. Earth -20% (-108 TgC)
-24% (-129 TgC)
Syst. Dyn. 11, 357–376 (2020). 3.2.4 BVOCs
(2012, their Fig. S2), IPSL-CM5A-MR in RCP8.5 simu- -30 -20 -10 0 10 20 30 40 50
lates a much larger precipitation increase around the Equa- Global combined BVOC emissions over 2001–2010 totaled Change ± across-year st. dev. (%)
tor, where we see the largest increase in runoff (Fig. S17a). ⇠ 546 TgC yr 1 (⇠ 503 and ⇠ 43 TgC yr 1 for isoprene and
Finally, LPJ-GUESS is not a full hydrological model: e.g., it monoterpenes, respectively), which compares well with es-
does not include river routing. Land surface and hydrologi- timates from LPJ-GUESS using different land use scenarios
cal models that include river routing, such as those included (Arneth et al., 2008; Hantson et al., 2017; Szogs et al., 2017)
in the Asadieh and Krakauer (2017) ensemble, are needed to and the Model of Emissions of Gases and Aerosols from
fully explore how changing precipitation, transpiration, and Nature (MEGAN) model (Sindelarova et al., 2014). Emis-
sions decline in all scenarios: by the most in SSP3-60 and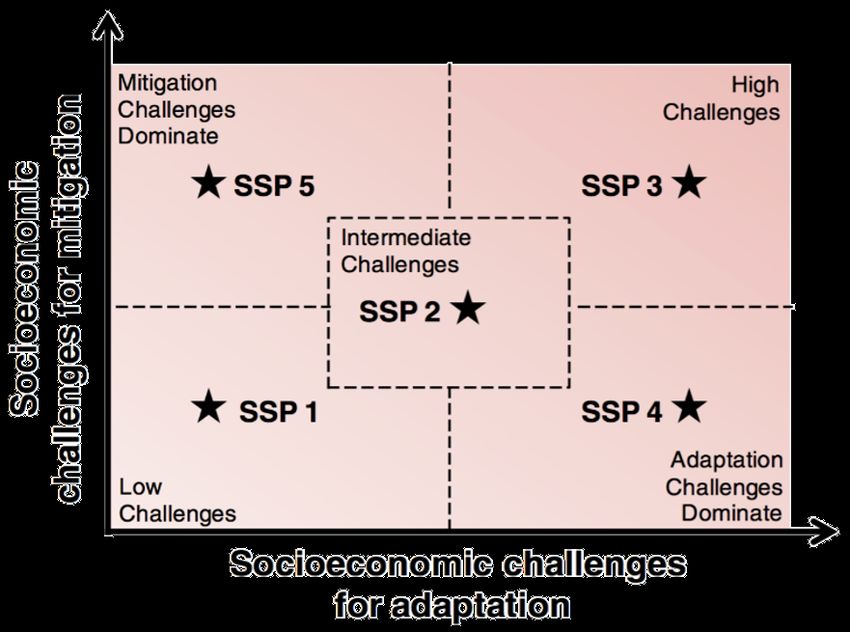
Dietary transitions for safeguarding biodiversity

   Comparing regions with high
   biodiversity under pressure
   from agricultural expansion.
   The left column (a,c,e) is the
   business-as-usual (BAU)
   scenario and the right column
   (b,d,f) is the diet low in animal
   products (LOW-AP) scenario
   for the different types of
   species richness

Henry, R. C. et al. The role of global dietary
transitions for safeguarding biodiversity. Glob.
Environ. Chang. 58, 101956 (2019).

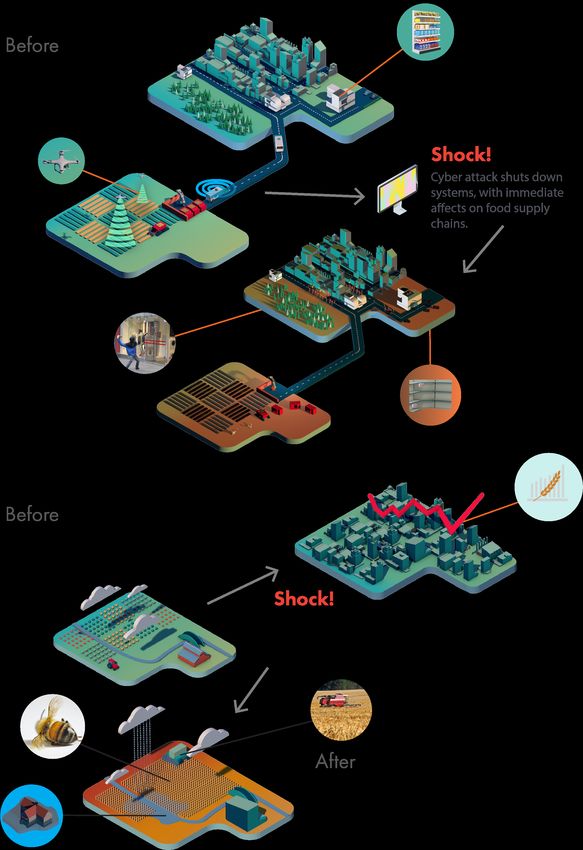
How can the UK food system be managed to reduce the
impact of global shocks?
  • Potential changes to policy considered…
     a. Raise trade barriers on food imports?
     b. Increase subsidies to agricultural production?
  • Resilience of the food system should consider…
     i. Food security (households)
     ii. Viability of agricultural sector
     iii. Environmental impact of the production

  1. What impact do different policy option have on UK food system?
  2. Are some policy options better than others in mitigating the impact of global shocks
  for food security?
  3. What are the implications for viability of production section & environmental
  sustainability?
Methods – Scenarios tested • Simulation run with and Policy regime Subsidy Rate Trade Barrier without shocks to 2060 (% of unit cost (% of tariff- • Historical patterns of global per ha) free price) production shocks used to Business as usual (BAU) 6% 12% randomly generate shocks to global production system Higher UK subsidy 12% 12% • Three policy scenarios used to explore outcomes for UK Higher UK import tariffs 6% 23% food system under shocks.
Household Food Security

  • Across all policy regimes scenarios, the
    impact of modelling global shocks is to
    increase price volatility

  • But, neither policy options dramatically
    impacts price volatility

  • Consumer food spending reduces with
    higher subsidies (~4% overall) compared to
    BAU.

  • But, conversely, consumer costs increase
    under trade barriers
Mean % of
Agricultural viability demand met
from
domestic
production
• Self-sufficiency is improved by both (2020-2060)
protectionist policies and subsidies (by
around 10%)
Average
• Higher trade barriers & subsidies improve profit margin
profit margins, particularly for ruminants (2020-2060)
• Years of negative profits are reduced by
protectionist policies, especially for
oilcrops, pulses, starchy roots, and wheat. Years with
positive
profits
(2020-2060)Environmental Footprint Both subsides and trade barriers create an intensification of production and expansion of UK cropland. Trade barriers scenario having a greater effect than subsides scenario. Total agricultural area remains unchanged, but shift from pasture to cropland.
Trade-offs for managing food
system resilience
                          Higher trade barriers
                          - Good for viability of agricultural
                            production sectors
                               - increased profitability and lower price
                                 volatility.
                          - But…
                          - Environmental impacts
                          - Raises food prices for consumers

                          Higher subsidies
                          - Good for consumer prices
                          - Good for viability of agricultural
                            sectors
How does market power affect food system resilience? • Power imbalances are assumed to be detrimental to food security and to economic welfare • We consider how previous shocks have been mitigated or amplified by the consolidation of market power • Impact of market power on food system resilience found to be mixed Low functional diversity levels, inflexible Financial capacity, robust logistics and contracts and homogenous processes cooperation can enable firms to better may increase supply chain vulnerability mitigate shock impacts Example: Outbreak of E coli O157:H7 in Example: European vegetable shortage Spinach from California in 2006 due to in 2017, powerful UK retailers diverted concentrated production and processing to US lettuce at higher cost
Final comments
            • Project work and analysis still going on…
                 • including on the impacts of other shocks, including
                   post-COVID recovery scenarios.

            • Global food system is complex, but this can make
              the system (at least for consumers) more resilient
              to shocks
                 • Complexity or long supply chains are not in themselves
                   a source of vulnerability as some suggest
                 • Disruptions to international trade is a notable
                   exception
                 • Globalisation concentrates impacts poorest
Thank you. Questions? Agnolucci, P. et al. Impacts of rising temperatures and farm management practices on global yields of 18 crops. Nat. Food 1, 562–571 (2020). Alexander, P. et al. Adaptation of global land use and management intensity to changes in climate and atmospheric carbon dioxide. Glob. Chang. Biol. 24, 2791–2809 (2018). Hamilton, H. et al. Exploring global food system shocks, scenarios and outcomes. Futures 123, (2020). Henry, R. C. et al. The role of global dietary transitions for safeguarding biodiversity. Glob. Environ. Chang. 58, 101956 (2019). Moran, D., Cossar, F., Merkle, M. & Alexander, P. UK food system resilience tested by COVID-19. Nat. food 1, 242 (2020). Rabin, S. S. et al. Impacts of future agricultural change on ecosystem service indicators. Earth Syst. Dyn. 11, 357–376 (2020).
You can also read