The Real-Time system for MHD activity control in the FTU tokamak
←
→
Page content transcription
If your browser does not render page correctly, please read the page content below
The Real-Time system for MHD activity control in the FTU
tokamak
C. Sozzi1 , E. Alessi1, L. Boncagni2, C. Galperti1, C. Marchetto1, S. Nowak1, W. Bin1, A. Botrugno2,
A. Bruschi1, S. Cirant1, G. D’Antona3, O. D’Arcangelo1, M. Davoudi3, D. Farina1, R. Ferrero1, L.
Figini1, S. Garavaglia1, G. Granucci1, A. Grosso2, F. Iannone2, E. Lazzaro1, A. Moro1, A. Nardone1,
V. Mellera1, D. Minelli1, M. Panella2, V. Piergotti2, P. Platania1, G.Ramponi1, A. Simonetto1, B. Tilia2,
E. Vitale2, O. Tudisco2
1
  Istituto di Fisica del Plasma CNR, Euratom Association, 20125 Milano, Italy
2
  Associazione EURATOM-ENEA, C.R. Frascati, Italy
3
  Politecnico di Milano, Dipartimento di Energia, Milano, Italy

           Abstract. The Real-Time system for the control of the magnetohydrodynamics
           instabilities in FTU tokamak is presented. It is based on both a-priori information
           derived from statistical treatment of a database and Real-Time elaboration of live
           diagnostics data. The analysis codes are executed in different time threads based on
           multi-processors machines. The actuator is the 2x0.4MW 140 GHz ECRH system
           equipped with the new fast quasi-optical steerable launcher.

1 Introduction
A new Real-Time (RT) data acquisition and elaboration system is being implemented in FTU
tokamak (major radius R=0.935 m, minor radius, a=0.31 m, max toroidal field 8 T, max plasma
current 1.6 MA, typical flat top pulse duration 1.5 s) [1] to perform experiments of RT control of
magnetohydrodinamic activity through a newly installed fast steerable two beams EC launcher [2].
The main goal of the system is the detection and control of m/n = 3/2 and 2/1 (neoclassical) tearing
modes, (N)TM, and the control of the period of sawteeth activity in order to prevent the seeding of
NTMs. However, the system architecture proposed and being implemented allows a range of
applications, virtually extensible to all cases in which the steering of the ECH beams and their timely
switching on/off linked with a suitable diagnostic signal or combination of signals could be
desirable.
      This paper is organized as follows. In section 2 the requirements for the design of the control
system are exposed. The architecture of the RTC system and the functions performed by its
components are illustrated in section 3. A brief description of the suite of numerical tools
implemented, of their specific role in the system and of how they are used for MHD control is given
in section 4 along with some experimental example. Conclusions follow in section 5.

2 Guiding criteria, constraints and requirements
In order to operate at high magnetic field FTU is equipped with a cryogenic toroidal field coil system
[3]. The steel wall is also at cryogenic temperature (77 K). The outer cryostat imply severe
constraints in the port geometry that reflects also on the auxiliary systems (including the ECRH
antennae) and diagnostics characteristics, installation and maintenance [4, 5].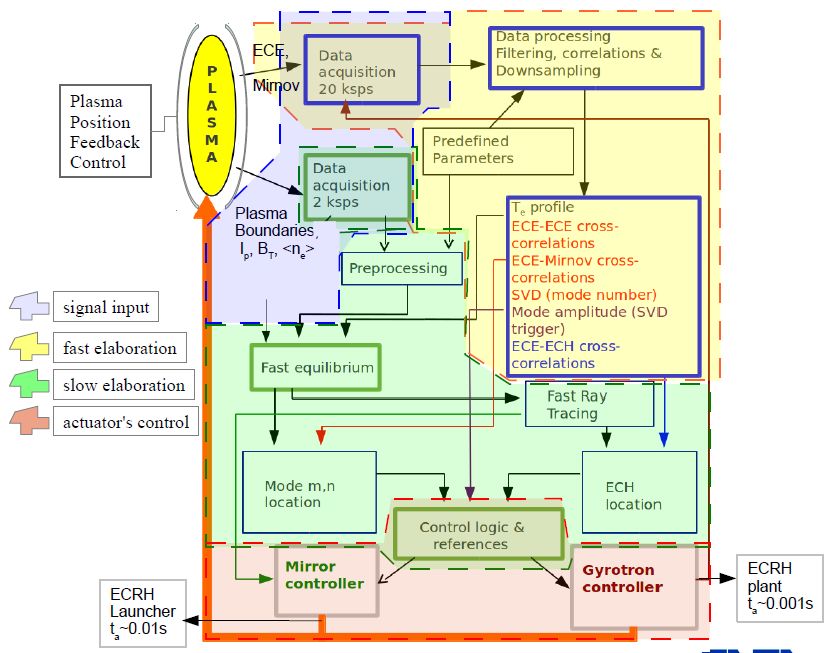
EPJ Web of Conferences
For such reason one of the driving criterion in the development of the control system has been
the optimal use of the existing hardware including plasma diagnostics, adopting solutions able to
compensate their limitations complementing the diagnostic data with other available information [6,
7]. The architecture of the system allows taking advantage of available apriori information about the
expected location of the instability. Such feature allows to optimize the response of the system and to
supply a reliable status for the actuator even if the flow of diagnostic data is not regular. Detection,
foreseeing and control of the action are performed on different hardware platforms working in
separate time threads [8]. Finally, a modular implementation strategy has been chosen for both
hardware and software. This allows to test step by step the new components.
The RT control system designed for FTU uses raw signals from the existing diagnostics, mainly
electron temperature oscillations from a 12channels ECE (Electron Cyclotron Emission) grating
polychromator [9], 16 signals from the Mirnov coils system providing the fluctuation of the poloidal
magnetic field [4] and 2 signals ECH microwave power monitors from directional couplers along the
transmission line [10] (see scheme in figure.1). Other RT signals (plasma boundaries, plasma current
Ip, toroidal magnetic field Bt and line integrated density) are obtained via the FTU plasma control
system [11].
Fig. 1. Architecture of the Real Time Control system for MHD instabilities
ECE signals used alone or in combination with the magnetic signals are essentials in the
presented architecture in order to detect the radial location of the MHD instabilities. At the magnetic
field typical of ECRH operation (Bt=5.3T at R=0.965m) the spacing between channel is about 3 cm,
with radial resolution of 2 cm. The typical size of FTU magnetic island is 23 cm [12], rotating at 1EC17 Workshop
10 kHz frequency. Smallest islands can produce temperature oscillations below the detectable
threshold of ECE.
The new launcher is fed by 2 out of the 4 x 0.4 MW x 0.5 s 140 GHz gyrotron sources
available. Switching from the previously installed launcher to the new one is performed through a
pair of quasi optical switches manually actioned in shottoshot time intervals. The two beams
launching points are symmetrical with respect to equatorial plane. Small size, low inertia steering
mirrors allows angular speed Δθ/Δt=100°/s (about 1° or 1cm/10ms at plasma axis) and a full poloidal
(upper: α=:-15°,+50°; lower α=:+15°,-50°) or toroidal scan (β=:±40°) in 400 ms with nearly
independent movements along the two axis. The launcher is also equipped with a zooming system
which allows variation of the beams size (wmin=19.0 mm, wmax=26.0 mm at the plasma axis) [13].
3 Architecture of the control system
The software platform chosen to implement the control system is the MARTe (Multithreaded
Application RealTime executor) framework environment under RTAI Linux operating system. It
runs on cPCI (and/or VME) industrial standard PCs hardware for both data acquisition and data
elaboration using embedded motherboards equipped with quad core I7 processors.
The real time analysis tools and modules of the control logic are developed and tested in high
level language such Matlab®, IDL®, F90 and then translated in C++ MARTe GAMs (Generic
Application Module) maintaining their modularity. GAMs are easily managed & combined to
modify the control algorithm even in a shottoshot time scale [14].
The raw data from diagnostics are elaborated using the algorithms developed in order to detect
the presence of the MHD activity, to track its radial position, to characterize its poloidal and/or
toroidal mode number and to timely switch on/off the EC power aiming the beams towards the
island. This set of signals undergoes a twostage elaboration through the control chain. The flow of
data is highlighted by the color code in figure 1. The blue area represents the data input. Fast
diagnostic data (ECE, Mirnov, and ECH) are acquired with 20 KHz sampling rate. Plasma current,
toroidal field, lineaveraged central density and magnetics for the last closed magnetic surface
reconstruction are acquired at 2 KHz sampling rate. After filtering and preprocessing, fast data feed
the crosscorrelation and the Single Value Decomposition algorithms, running in the fast time thread
(yellow area). The output of the fast elaboration is transferred to the slow time thread (green area),
together with data from the slow acquisition. The slow thread run the equilibrium reconstruction, the
ray tracing and the main controller algorithms which provides the references signals for the mirror
controller and for the gyrotrons power supply. Simple controller logics have been implemented and
tested on offline data [8].
4 Location of the instabilities: a-priori-based and measurement-based
The readjustment of the injection angle is the slower process in the control chain. Its overall time
response can be considerably reduced introducing a tracking feature able to follow the probable
location of the magnetic instability and reducing in this way the angular distance to be covered when
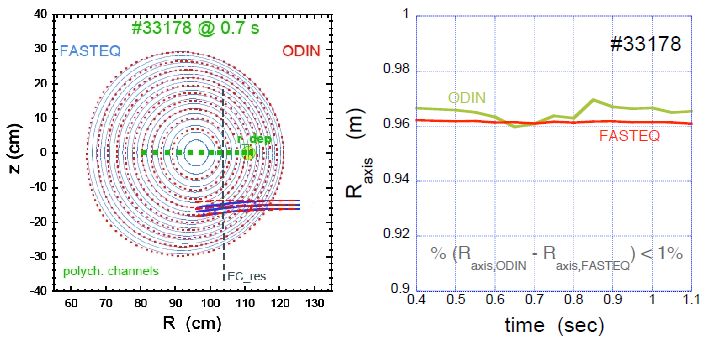
the instability is actually detected. Such a function is performed by the fast equilibrium
reconstruction FASTEQ based on a procedure of best fit of a large database (> 200) of FTU
equilibria computed solving the GradShafranov equation for a wide range of plasma parameters:
350 kA ≤ Ip ≤ 850 kA, 4 T ≤ Bt ≤ 7 T, 4 1019 m3 ≤ ne ≤ 16 1019 m3, 1 ≤ Te ≤ 8 keV [15]. The map of
poloidal flux surfaces is then obtained from RT signals of plasma boundaries (provided by magnetic
measurements) and by an approximation of the plasma magnetic axis obtained by the thermal
barycentre of the Te profile with suitable symmetrization provided by the interpolation of the
polychromator channels:EPJ Web of Conferences
Rax= ∫dR R Te / ∫ dR Te (1)
The dependence of the minor radius ρ on ψn is best fitted as ρ=ψn 0.7.
The magnetic surfaces are parametrized as follows using the normalized poloidal flux ρ and
0EC17 Workshop
(Singlular Value Decomposition) is applied on the signals of toroidal and poloidal sets of Mirnov
coils and is based on the phase difference among the different coils [18].
[eV]
Fig. 3. Map of the amplitude (in eV) of the cross-correlation coefficients between Mirnov coil (ch. 13) and
ECE channels vs time for FTU shot 34742. Black circles indicate mode detection via change of sign of
cross-correlation with amplitude beyond a given threshold (19.8 eV). Colour lines mark RT-computed
rational q surfaces. The black dashed line indicated the thermal barycentre of plasma (~magnetic axis).
Fig. 4. Top: frequency (red line) and average of PC. Bottom: amplitude of one the Mirnov coil (red)
and behaviour of a trigger signal generated by the SVD algorithm when falls below
threshold.EPJ Web of Conferences
Its implementation for RT control has been originally motivated for m,n mode radial localization
in combination with the equilibrium reconstruction [19]. Although this application is not
straightforward, SVD is proving rather effective in the early detection of mhd activity as figure 4
shows. Both the behaviour of the dominant Principal Component (PC, representing the mode in
which the time series of the Mirnov signals oscillate longer in the given data packet) and its
frequency are sensitive in respect of the amplitude of the instability as detected by one single coil. In
fact when the instability buildsup quickly the average vanishes and the frequency reaches the
typical range of the tearing instabilities in FTU.
5 Conclusions
The architecture of the RealTime system for NTM control on FTU has been finalized and most
of the key components have been developed. The algorithms of elaboration of the diagnostics data,
the apriori algorithms for prealignment of the beams and simple controller logics have been
implemented and tested on offline data. In the first operations performed on a plasma several
elements of the control chain have been tested.
Acknowledgments
This work was supported by EURATOM and carried out within the framework of the European
Fusion Development Agreement. The views and opinions expressed herein do not necessarily reflect
those of the European Commission.
References
1. C. Gormezano et al. Fus. Sci. Techn. 45, 3, 297302 and 303322 (2004)
2. A. Bruschi et al., Fus. Sci. Tech. 55, 1, 94107 (2009)
3. A. Pizzuto et al., Fus. Sci. Techn. 45, 3, 422436 (2004)
4. O. Tudisco et al. Fus. Sci. Techn. 45, 3, 402421 (2004)
5. M. Aquilini et al. Fus. Sci. Techn. 45, 3, 459482 (2004)
6. G. D'Antona, S.Cirant, M.Davoudi, IEEE Trans. on Nuclear Science, 58, 4, 15031510 (2011)
7. S.Cirant et al., Fus. Scie. Tech., (53), 1 174183 (2008)
8. C. Galperti et al., this conference.
9. O. Tudisco et al., Rev. Sci. Instrum., 67, 9, 31083116 (1996)
10. A. Simonetto et al., Fus.Eng.Des., 53, 1, 301308, (2001)
11. Y. Sadeghi et al., IEEE Trans. on Plasma Science, 38, 3, 352358 (2010)
12. P. Buratti et al., Fus. Sci. Techn. 45, 3, 350369 (2004)
13. A. Moro et al., this conference.
14. L. Boncagni et al., Fus. Eng. Des., 86, 68, 1061–1066 (2011)
15. S. Nowak et al., Proc. 38th EPS Conf. Contr. Fusion and Plasma Phys., Strasbourg, France, P4
085 (2011)
16. S. Nowak and A. Orefice, Phys. Plasmas 1 1242 (1994)
17. E. Alessi, et al. this conference. See also: E. Alessi et al., Proc, of 2nd Intnl. Conf. on Frontiers
in Diagnostic Technologies, (2011), submitted for publication, Elsevier
18. C. Nardone, Plasma Phys. Contr. Fus. 34, 14471465 (1992)
19. C. Marchetto et al, Proc. 37 th EPS Conf. Contr. Fusion and Plasma Phys., Dublin, ECA 34A, P5
117 (2010)You can also read