Energetic transition: towards electricity without CO2 - Kenergia
←
→
Page content transcription
If your browser does not render page correctly, please read the page content below
34th International Conference on Efficiency, Cost, Optimization, Simulation and Environmental Impact of Energy System

                                             Giovanni Simoni
                                              CEO Kenergia

             Energetic transition: towards electricity without CO2

                                                    30th June 2021

30/06/2021                                         Kenergia srl - All rights reserved                                      1
Kenergia Srl

Rain Water     Storage Solution                                      Solar Breeder
                                                 Grid Parity 2 Srl
Recovery Srl     Provider Srl                                        Marocco Sarl

 30/06/2021               Kenergia srl - All rights reserved                   2
INDEX

1. THE ORIGINS OF PV

2. THE DEVELOPMENT OF PV

3. THE CLIMATE CHANGES

4. THE PV TO OPTIMISE THE LAND USE EFFICIENCY: AGRIVOLTAICS

5. THE PROBLEMS OF “PV PERMITTING” IN ITALY

6. CONCLUSION

  30/06/2021                          Kenergia srl - All rights reserved   3
1. THE ORIGINS OF PV

PV is now the most important technology
for the green revolution of the electricity
         production in the world.

                It took 40 years to
                achieve this goal!

   30/06/2021                      Kenergia srl - All rights reserved   4
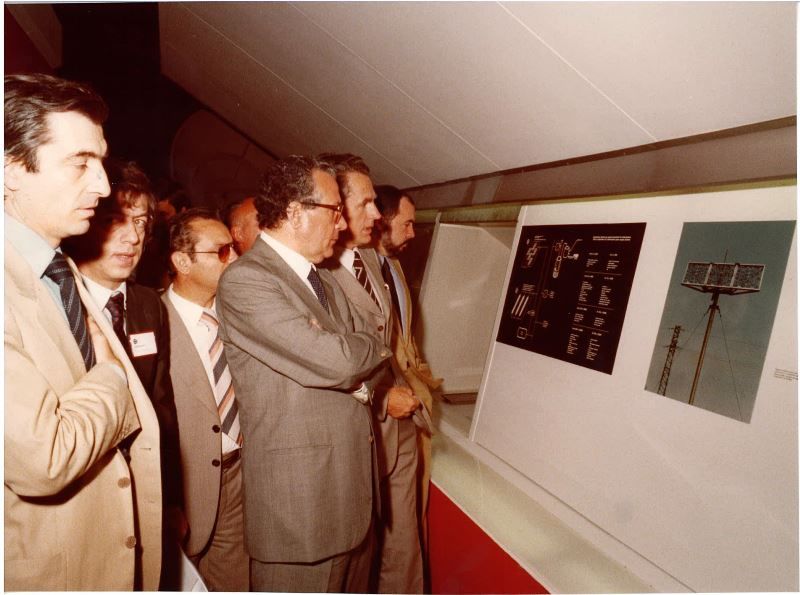
1. THE ORIGINS OF PV

                                                                         In Italy, the first commercial PV cells entered the «market» in
                                                                         1980-1981.

                                                                         Pragma SpA (an ENI company) was the first PV factory in
                                                                         Europe.

                                                                                                       PV factory    Number of PV factory
                                                                           In 1987                     production:       workers:
                                                                                                       1 MW/year            100

                                                                                                        PV factory   Number of PV factory
                                                                           In 2021                     production:       workers:
                                                                                                      3000 MW/year          100
                      «Fiera di Genova» in 1980.

                                            Productivity increased by 3000 times!
Source: Kenergia - http://www.kenergia.it/storia-fotovoltaico/
         30/06/2021                                              Kenergia srl - All rights reserved                                    5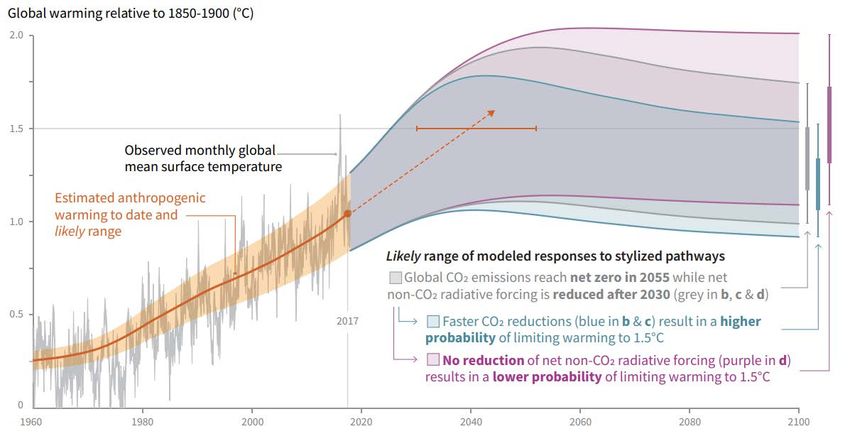
1. THE ORIGINS OF PV

In 1981 commercial PV module efficiency was
                                                                                                                                               [2]
8÷10% while the price was 12$/Wp (for a
minimum production at least of 26kWp). The                                                                                                 2018
record lab cell efficiency was > 22%[1].

Today, the average PV module efficiency is
about 20% (the same value of lab cell
efficiency in 1981).

Sources: [1] Ing. Simoni – Conferenza Nazionale sull’Energia 1987 – «Prospettive di sviluppo per il settore fotovoltaico, proposta per un programma
decennale».
         [2] Fraunhofer ISE – «Photovoltaics report» 2020.
         30/06/2021                                           Kenergia srl - All rights reserved                                           6
1. THE ORIGINS OF PV

                                                                           [3]                    Thanks to the simplification of the PV
                                                                                                  module industrial production process,
                                                                                                  material usage for silicon cells has
                                                                                                  been reduced significantly during the
                                                                                                  last 13 years from around 16 g/Wp to
                                                                                                  less than 4 g/Wp due to increased
                                                                                                  efficiencies, thinner wafers and wires
                                                                                                  as well as larger ingots.

                                                                                                  This played a central role in the
                                                                                                  decrease PV solar cells price,
                                                                                                  together with other factors as
                                                                                                  “economy of scale” and increase of
                                                                                                  the efficiency.

Sources: [3] Fraunhofer ISE – «Photovoltaics report» 2020.

       30/06/2021                                            Kenergia srl - All rights reserved                                     7
2. THE DEVELOPMENT OF PV
                           [4]
                                                                                                While the cost of solar module has
                                                                                                declined significantly over the years, in
                                                                                                2005 the cost of PV electricity was at
                                                                                                least 10 times higher than the market
                                                                                                price.
                                                                                                The Italian Governement adopted an
                                                                                                aggressive incentives policy (initially
                                                                                                more than $550/MWh!). This lead to a
                                                                                                world wide installation record in the
                                                                                                2011 of 9,5GW!

                                                                                                 EU Directive 2001/77/EC
                                                                                                    («RES Directive»)
Source: [4] BloombergNEF – «Global Solar Investment Report State of solar markets and role of concessional finance in ISA member countries” 2020.
        30/06/2021                                         Kenergia srl - All rights reserved                                         8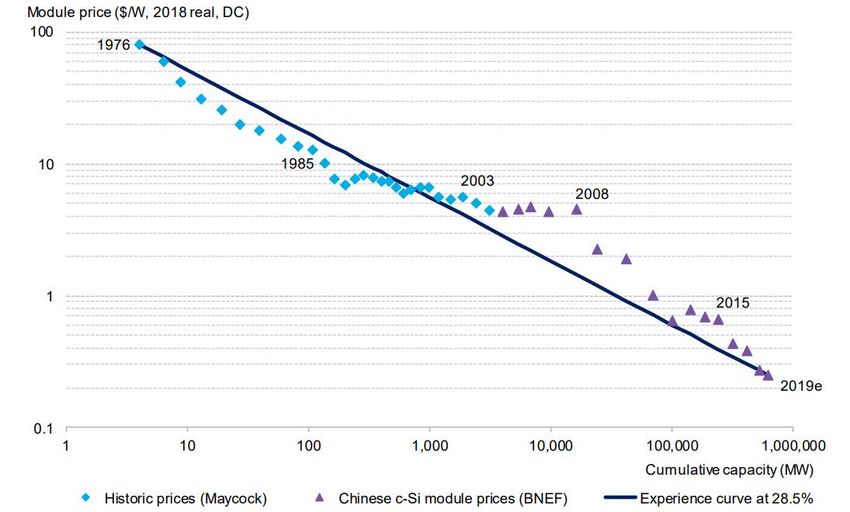
2. THE DEVELOPMENT OF PV
        COMPARISON BETWEEN INCENTIVES AND GAS SAVINGS IN
   B€                   “SCENARIO +2” [5]                                                                 Scenario +2 was chosen as the "base scenario"
                                                  2033: cumulative savings >                              that resulting from the SEN, in the most
                                                     PV total incentives
                                                                                            2013          cautious assumption for the increment of the
                            2022: equilibrium annual                                                      gas price.
                                  costs/savings
                                                                                                          The graph represents a synthesis of results of
                                                                                                          the comparison between the real cost of the
                                                                                                          incentives paid in the bill and the actual savings
                                                                                                          obtained in terms of natural gas imports.

                                                                   2050: Net result
                                                                     + € 89 bilion                        • In 2022 the annual savings in fossil fuel
                                                                                                            imports exceed the annual cost of
              Net investment                                  Return on investment
                                                                                                            incentives.
              Net economic return                             Difference between annual savings/costs
              Real annual cost                                Real annual cost saving
                                                                                    • In 2033 the cumulative savings exceeds the
Source: [5] Ing. Giovanni Simoni – QualEnergia - «Il sole che fa bene al Paese» 2013. total PV incentives.
        30/06/2021                                                         Kenergia srl - All rights reserved                                        9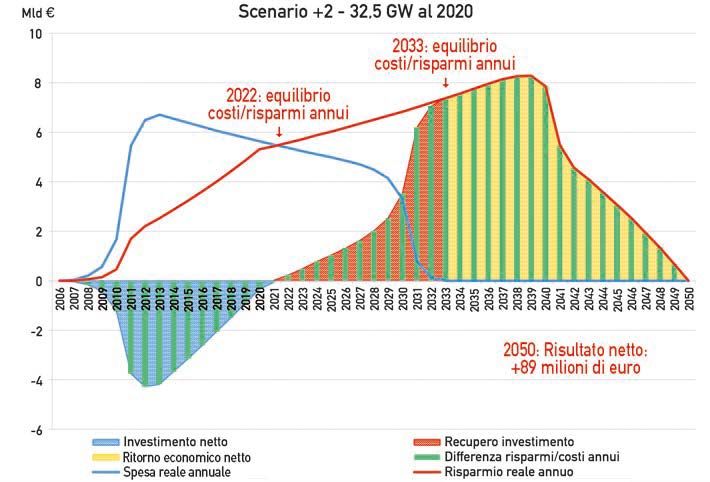
2. THE DEVELOPMENT OF PV

                                                                                                        PV
  PV POWER EVOLUTION AND PV
                                                                                                         P installed
    PLANTS NUMBER IN ITALY [6]                                                                     YEAR
                                                                                                            [MW]
                                                                                                   2019      757
                                                                                                   2018      426
                                                                                                   2017      399          «Conto Energia»
                                                                                                   2016      382       I Conto Energia D.M. 28th
                                                                                                   2015      307       july 2005 and D.M. 6th
                                                                                                                       february 2006;
                                                                                                   2014      409       II Conto Energia D.M. 19th
                                                                                                   2013     1.400      february 2007;
                                                                                                   2012     3.654      III Conto Energia D.M. 6th
                                                                                                                       august 2010;
                                                                                                   2011     9.539
                                                                                                                       IV Conto Energia D.M. 5th
                                                                                                   2010     2.328      may 2011;
                                                                                                   2009      781       V Conto Energia D.M. 5th
                                                                                                   2008      344       july 2012.

Source: [6] Gestore dei Servizi Energetici (GSE) – «Rapporto statistico solare fotovoltaico 2020».
         30/06/2021                                           Kenergia srl - All rights reserved                                      10
2. THE DEVELOPMENT OF PV
LOW RENEWABLE COSTS ALLOW TO POWER PAST
COAL [7]
2021 Renewable electricity costs have fallen sharply over
the past decade, driven by improving technologies,
economies of scale, increasingly competitive supply
chains and growing developer experience.
Since 2010, utility-scale solar PV power has
shown the sharpest cost decline at 82%.
Source: [7] International Renewable Energy Agency IRENA 2021 - https://www.irena.org/newsroom/articles/2021/Jun/Low-Renewable-Costs-Allow-To-Power-Past-Coal
2021. 30/06/2021 Kenergia srl - All rights reserved 113. THE CLIMATE CHANGES
GREENHOUSE GLOBAL GAS EMISSIONS
2021
Total: 33.0 Gt CO2
Global energy-related CO2 emissions by sector [8] Global energy-related CO2 emissions, 1990-2021 [9]
Source: [8] International Energy Agency (IEA), Global energy-related CO2 emissions by Source: [9] International Energy Agency (IEA), Global energy-related CO2 emissions,
sector, Paris https://www.iea.org/data-and-statistics/charts/global-energy-related-co2- 1990-2021, Paris https://www.iea.org/data-and-statistics/charts/global-energy-related-co2-
emissions-by-sector emissions-1990-2021
30/06/2021 Kenergia srl - All rights reserved 123. THE CLIMATE CHANGES
[10] Human activities
are estimated to
have caused
approximately
1.0°C of global
warming above
pre-industrial
levels, with a likely
range of 0.8°C to
a) It Represents the ΔT of global warming in the hypothesis both to reach 1.2°C.
CO2 global emissions net-zero in 2055 and to begin the decrease of other Global warming is
greenhouse gas emissions (non- CO2) in 2030.
likely to reach
b) best-case scenario: it represents ΔT of global warming in hypotesis to
reach CO2 global emissions net-zero in 2040, limiting global warming to
1.5°C between
1,5°C. 2030 and 2052 if it
c) worst-case scenario: it represents ΔT of global warming in hypotesis to continues to
not begin the decrease of greenhouse gas emissions (non- CO2) in 2030. increase at the
current rate.
Estimated anthropogenic global warming is currently increasing at 0.2°C per decade due to past and
ongoing emissions.
Source: [10] International Panel on Climate Change (IPCC) – «Global Warming of 1,5°C» 2018.
30/06/2021 Kenergia srl - All rights reserved 13[11] 3. THE CLIMATE CHANGES
GLOBAL CONTEST: THE 2050 NET-ZERO STRATEGY
Many countries have already fixed at 2050 the
date to net-zero the use of fossil fuels as
primary sources for the production of energy
both in electrical and thermal form.
The EU aims to be climate-neutral by 2050 –
an economy with net-zero greenhouse gas
emissions. This objective is at the heart of
the European Green Deal and in line with the
EU’s commitment to global climate action
under the Paris Agreement.
Source: [11] International Energy Agency (IEA) – «Net-zero by 2050» 2021.
30/06/2021 Kenergia srl - All rights reserved 143. THE CLIMATE CHANGES
Ever‐cheaper renewable energy
[12]
technologies give electricity the edge in
the race to zero.
Our pathway calls for scaling up solar
and wind rapidly this decade, reaching
annual additions of:
+ 630 GW PV
By 2030
+ 390 GW WIND
By 2030
Source: [12] International Energy Agency (IEA) – «Net-zero by 2050» 2021.
30/06/2021 Kenergia srl - All rights reserved 153. THE CLIMATE CHANGES
EUROPEAN CONTEST: THE GREEN NEW DEAL
As part of the European Green Deal, the Commission proposed in September 2020 to raise the 2030 greenhouse
gas emission reduction target, including emissions and removals, to at least 55% compared to 1990.
Key targets for 2030 [13]:
At least 40% cuts
in greenhouse gas
emissions (from 1990 levels)
At least 32% share
for renewable energy
At least 32.5% improvement
in energy efficiency
Source: [13] European Commission website - https://ec.europa.eu/clima/policies/strategies/2030_en
30/06/2021 Kenergia srl - All rights reserved 163. THE CLIMATE CHANGES
[14]
EUROPEAN CONTEST: GREENHOUSE GAS
EMISSIONS BY AGGREGATED SECTOR
Source: [14] European Environment Agency – https://www.eea.europa.eu/data-and-maps/daviz/ghg-emissions-by-aggregated-sector-5#tab-dashboard-02
30/06/2021 Kenergia srl - All rights reserved 173. THE CLIMATE CHANGES
ITALIAN CONTEST: GREENHOUSE GAS EMISSIONS [15]
Green Deal
Per sector
Primary balance
Electrical sector
Waste
Agriculture Transport Heating and transport sector
and Breeding
Chemical Processes
Heating
Other sectors
Electrical Energy
Total emissions
73% of emissions are producted by the energy
sector.
Source: [15] Elettricità Futura – «Audizione Commissione X – Attività produttive, commercio e turismo» 2021
30/06/2021 Kenergia srl - All rights reserved 183. THE CLIMATE CHANGES
ITALIAN CONTEST: PNIEC TARGETS [16]
To achieve Green Deal targets Italy will have to: Evolution of renewable capacity by 2030
• Update the PNIEC (Piano Nazionale Integrato per Bio and Geothermal Innovative RES
Energy (PNRR)
l’Energia e il Clima) according to European Green Deal
targets.
Bio and Geothermal
Energy
• To install new 65 GW of renewable energy by 2030
(70GW including PNRR), increasing highly the rate of Hydro
annual installations.
Hydro PV PV
• To fix new regional targets of renewable energy
Wind
development (burden sharing).
Wind
• Regional permitting managers will have to be more
responsible to achive new targets.
Preliminary balance 2020
Source: [16] Elettricità Futura – «Audizione Commissione X – Attività produttive, commercio e turismo» 2021.
30/06/2021 Kenergia srl - All rights reserved 193. THE CLIMATE CHANGES
ITALIAN CONTEST: ELECTRICAL PENETRATION [16]
Comparison between the percentages of the penetration Electrical demand (annual variation, left axis, %)
of the electric carrier in 2017 between the various EU-28 Index 2005=100 and share of final consuption (avarage
countries. [17] 3 years, right axis) [18]
Sources: [17] Elettricità Futura – «Vettore Elettrico: lo scenario attuale e le prospettive future» 2019.
[18] Agenzia Nazionale per le nuove tecnologie, l’energia e lo sviluppo economico sostenibile (ENEA) – «Analisi trimestrale del sistema
energetico italiano 01/2021».
30/06/2021 Kenergia srl - All rights reserved 203. THE CLIMATE CHANGES
ITALIAN CONTEST: GREEN NEW DEAL TARGETS [19]
With the current trend the «2030 targets» will be reached in 2085
+ 7 GW/year
are the annual installation of renewable
plants to reach the 2030 Green Deal
target.
+ 0,8 GW/year
Is renewable capacity of 2020 of which 120
MW PV utility scale (-50% of 2019) and 85
MW wind (-80% of 2019).
INITIAL TREND
Source: [19] Elettricità Futura – «Audizione Commissione X –
Attività produttive, commercio e turismo» 2021.
30/06/2021 Kenergia srl - All rights reserved 214. THE PV TO OPTIMISE THE LAND USE EFFICIENCY: AGRIVOLTAICS
ITALIAN CONTEST: PV LAND USE
During the years the ratio between
PV land use and power installed
[ha/MW] decreased thanks to the
increase in the PV module ratio
between power and area [W/m2]:
In 2008 P= 250 W 2 m2
Today P= 500 W 2 m2
Target of Total PV
new PV land for
1,43 50.000
+35 GW power on PV Land the target
ha/MW ha
the of new 35
ground GW
[20]
Source: [20] Elettricità Futura – «Audizione Commissione X – Attività produttive, commercio e turismo» 2021.
30/06/2021 Kenergia srl - All rights reserved 224. THE PV TO OPTIMISE THE LAND USE EFFICIENCY: AGRIVOLTAICS
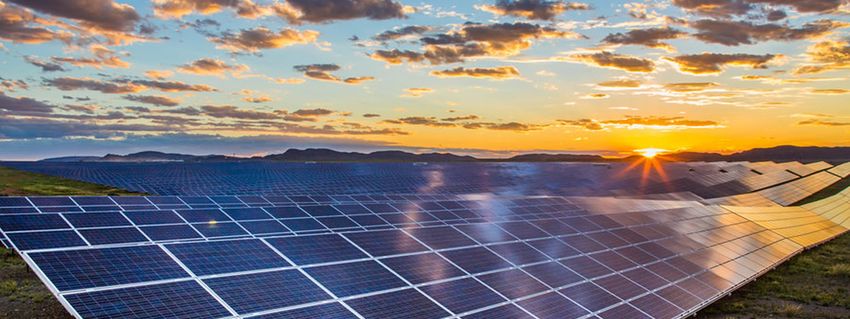
To reach the 2030 target in Italy we need to built 35GW of PV on land (PVL). A global investment of around €25
billions in less than 10 years! A large part of PVL should use agricoltural land: the so called Agrivoltaics (AGV).
The AGV plant, to be accepted by local Authorities, must consider a strong priority to agricoltural production..
AGV can [21]:
1. Contribute to a responsible use of natural resources such as land and water;
2. Promote sustainable agricultural practices;
3. Increase the EU’s agriculture resilience to climate change and other shocks and stresses;
4. Enable sustainable development in rural areas through higher yields and new business opportunities.
Source: [21] SolarPower Europe – «Agrisolar Best Practise Guidelines» Version 1.0, 2021.
30/06/2021 Kenergia srl - All rights reserved 234. THE PV TO OPTIMISE THE LAND USE EFFICIENCY: AGRIVOLTAICS
“TANARO GREEN PROJECT” (TGP)
Kenergia is developing a multi-terrirorial AGV project in
Italy (Piemonte), in partnership with local authorities,
such as «Coesione del Bacino del Tanaro».
Macro-objectives of TGP project:
• From 2021 to 2026 AGV will be developed;
• 1000 ha of agricultural land will be involved;
• + 15÷20% of agricultural production will be
increase;
• 400 MW of AGV plants will be developed and
installed;
• A new storage capacity will be evaluate;
• Rain Water Recovery system (RWR) will be tested.
30/06/2021 Kenergia srl - All rights reserved 245. THE PROBLEMS OF “PV PERMITTING” IN ITALY
PV “Autorizzazioni Uniche” requested in Italy PV “Autorizzazioni Uniche” issued in Italy
20 GW of PV “Autorizzazioni Uniche” requested in Italy in 1,4 GW of PV “Autorizzazioni Uniche” issued in Italy from
the last 3 years [22] 2016 to 2020 [22]
Source: [22] Energy & Strategy Group, Politecnico di Milano School of Management – «Renewable energy Report 2021».
30/06/2021 Kenergia srl - All rights reserved 256. CONCLUSION
- In Italy, like in many other countries, PVL and AGV are playing the basic role in the energy transition.
- A correct combinations of agricoltural production and electricity generation on the same land is a basic
condition to reach the 2030 enviromental target.
- This is not an easy task for the different conditions to be satisfied:
a) no soil food consumption;
b) acceptance by farmers to work on the same land with electrical operators;
c) financial and economic agreements;
d) Landscape integration of the PVL.
- Kenergia is investing in this needed new approach to the projects, and we are very confident on our
Hybrid Methodology that will demonstrate the economic convenience for all the involved stakeholders.
30/06/2021 Kenergia srl - All rights reserved 26Contact
Giovanni Simoni
g.simoni@kenergia.com
www.kenergia.com
30/06/2021 Kenergia srl - All rights reserved 27You can also read