1.5 C domestic emissions pathways and key sectoral implications - July 2021
←
→
Page content transcription
If your browser does not render page correctly, please read the page content below

1.5°C domestic emissions pathways and key
sectoral implications
July 2021
Welcome

• Please be aware that this webinar is being recorded

• You are muted upon entry and video is disabled

• If you encounter technical issues please submit your
  questions in the Q&A chat – our team will get back to you

• Questions:
     • Please submit your questions and comments along the
       webinar in the Q&A chat section – our speakers will address
       them after the presentations.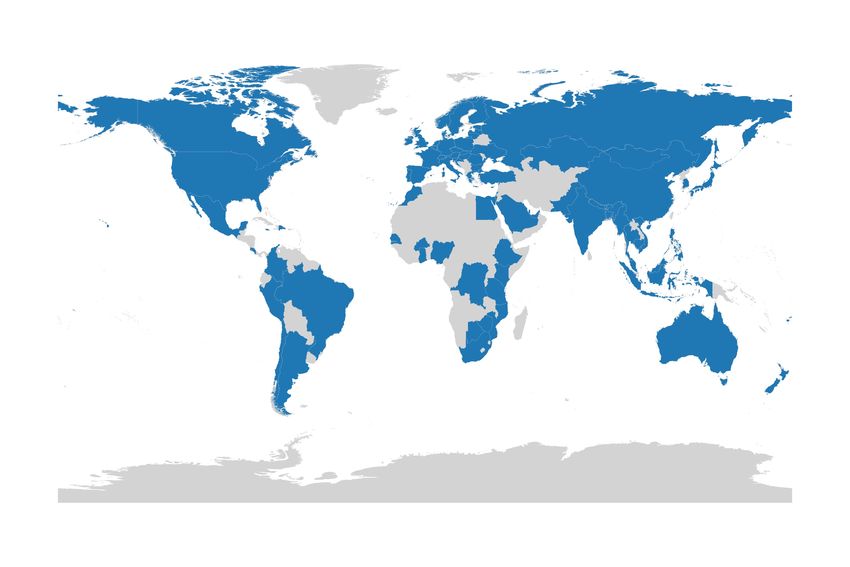
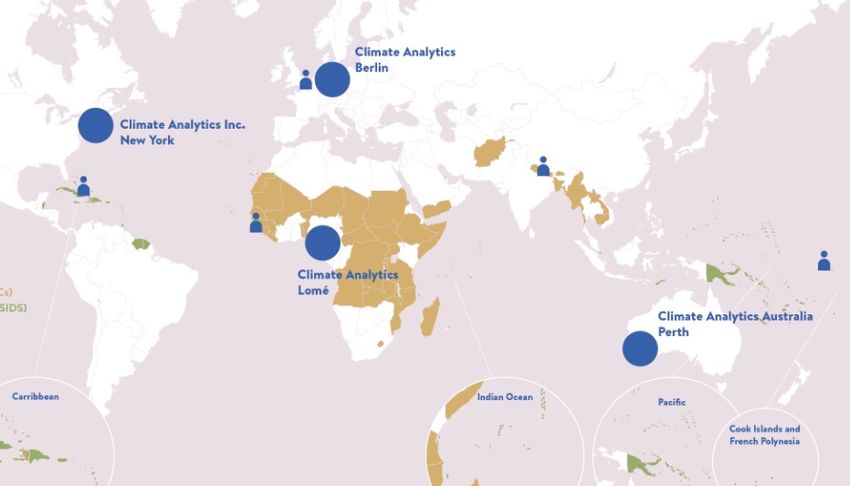
Who we are

Climate Analytics is a non-profit
climate science and policy
institute based in Berlin, Germany
with offices in New York, USA,
Lomé, Togo and Perth, Australia.
Agenda

  • About the 1.5°C national pathways project

  • Regional overview: Asia Pacific

  • Case studies: Bangladesh, Japan, Pakistan, Singapore
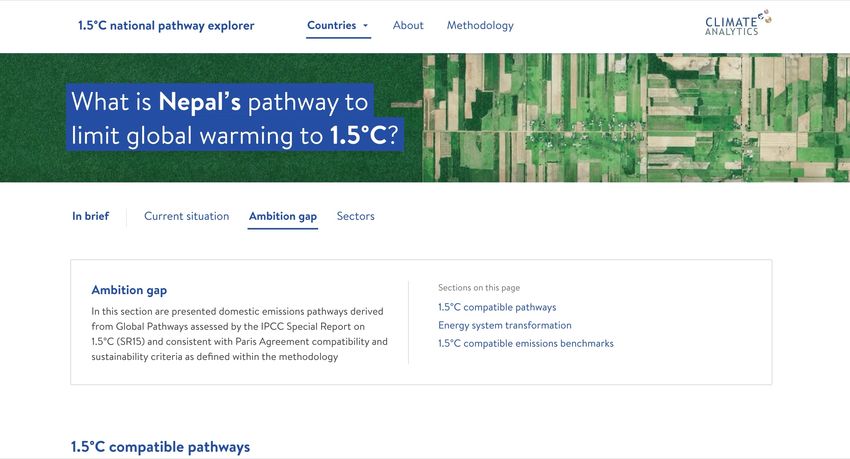
About the project: 1.5°C national pathways
Key gaps

• Global Paris Agreement compatible pathways have been published,
  however, national pathways are not available for many countries

• Current NDCs and policies are insufficient to limit warming to 1.5°C

Goals

• Provide key resources to stakeholders:
     • Support for NDC and LTS development
     • Provide national benchmarks which can support the
       development of sectoral policies
What do we look at?
• Global models assessed by the IPCC SR1.5 and other lines
  of evidence
• Regional to national level

• Global cost-effective pathways:
    • Technical and economic feasibility

• We analyse:
   • Economy-wide emission pathways: GHG and CO2
      emissions, excluding LULUCF
   • Sectoral decarbonisation pathways: power
        • Fuel shares
        • Carbon intensity
        • Fossil fuel phase out dates
The 1.5°C national pathway explorer
Asia Pacific is a key region

• Japan 3rd emitting country in the region, after China and India.
  10th is Pakistan (Source: PRIMAP 2021)

• 27 countries in the Asia Pacific account for about 76% of
  current global coal generation capacity

• The region accounts for almost the entire (94%) global pipeline
  of new coal plants

• Public finance for coal expansion in Southeast Asia

• The main recipients of this support are countries in South and
  Southeast Asia: Bangladesh, Indonesia, Pakistan, and Viet Nam
Asia Pacific: key benchmarks and policies
Key Paris compatible benchmarks                     Key policy recommendations
• Non-OECD Asia:                                    1. Adopt best practice policies – phase out fossil fuel subsidies,
   • Reduce coal generation by 63% below 2010       carbon pricing, renewable energy support, encourage shift in
      levels by 2030                                investment through green recovery
   • Phase out coal by 2037
                                                    2. Ratcheting up NDC targets and adopt Long-Term
   • Complete a global coal phase out before 2040   Strategies in line with the Paris Agreement
• In Southeast Asia :
     • 50-85% share of renewable energy by 2030     3. Avoid more stranded assets – moratorium for new coal and
                                                    phase out plans for coal before 2040
       in South and Southeast Asia by 2030
     • 100% renewable electricity generation by     4. Financial support and capacity building informed by Paris
       2050.                                        Agreement benchmarks

                                                    5. Regional and international cooperation

                                                    6. Transboundary grid transmission and integration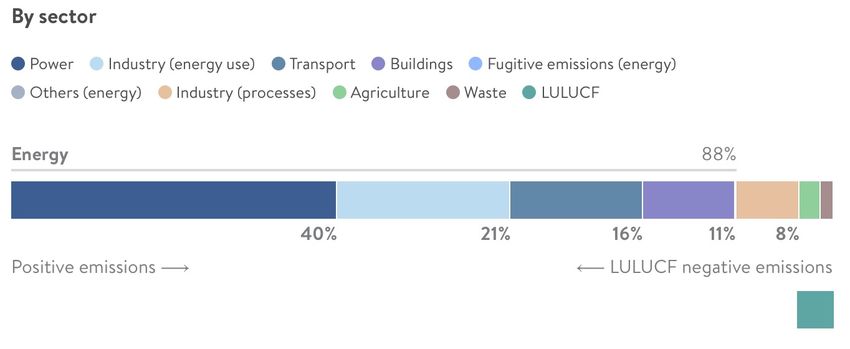
1.5°C scenarios see drastic reductions in
coal and gas generation
                                                                   Coal power generation must:
                                                                   • Peak by 2020 and,
                                                                   • Rapidly decrease to 80% below 2010 levels by
                                                                     2030 and,
                                                                   • Be phased out by 2040 at the latest

                                                                   Unabated gas lags only slightly behind:
                                                                   • Peak by 2020 and,
                                                                   • Rapidly decrease to 80% below 2010 levels in
                                                                     2040s and,
                                                                   • Be phased out in 2050s
  Unabated coal and gas in power generation in 1.5°C low and no-
  overshoot scenarios (SR1.5, interquartile range)
Recent regional updates The good: • G7 committed to phase out coal by 2030 and end investments in unabated coal immediately. • Bangladesh scrapped 9 coal power plants as finance dries up. • IEA (2021) calls for an end to new fossil fuel developments in 2021. • Australian court ruled that the federal environmental minister has a duty of care to young people when considering approving new coal mines. • Australia (QLD) coal plant exploded and batteries stepped in. • Asian Development Bank (ADB) plans to end financing of new coal power generation. The bad: • Russia spending US$10b on railroad upgrades to boost coal exports.
IEA Report: Net Zero by 2050
Climate pledges fall far short of reaching global net zero by 2050.

• Key messages:
• End to new fossil fuel developments in 2021
• No final investment decisions for unabated coal plants
• No sales of fossil fuel combustion cars by 2035
• Net zero GHGs for the global electricity sector by 2040

The IEA claims that its pathway is consistent with keeping below 1.5C with
no overshoot. We assess this claim and find that (depending on our
assumptions about non CO2 greenhouse gases), the scenario would be
either a low/high overshoot pathway.
                                                                             https://www.iea.org/reports/net-zero-by-2050
IRENA Report: New renewable energy
beating most operational coal
• 2010 to 2020 saw RE generation becoming the economic choice for
new capacity.
• New solar and wind projects are increasingly undercutting even the
cheapest and least sustainable of existing coal-fired power plants.
• 800 GW of existing coal-fired capacity has operating costs higher
than new utility-scale solar PV and onshore wind, including USD
0.005/kWh for integration costs.
• Replacing these coal-fired plants would cut annual system costs by
USD 32 billion per year and reduce annual CO2 emissions by around
3 Gigatonnes of CO2.
www.irena.org/publications/2021/Jun/
Renewable-Power-Costs-in-2020Progress is being made but more and
faster is needed
www.climateactiontracker.orgBangladesh: snapshot
• Bangladesh GHG emissions dominated by
energy and agriculture
• Emission from agriculture- mainly from rice
cultivation and enteric fermentation
• 55% of primary energy mix and around 75% of Sources : Primap-Hist 2019 and IEA CO2 Fuel 2019
power mix from natural gas
• Bangladesh scraps 90% of coal expansion plans
due to increase in import costs
• High share of traditional biomass in primary
energy mix
• Renewables playing a small role in power mix
Sources : IEA WEB 2019Bangladesh: 1.5°C emissions trajectory • Conditional NDC target is 15% below BAU level (2011) by 2030 (sectors covered: power, transport and industry) • Conditional NDC of Bangladesh translates in 115% above 2011 levels (excluding LULUCF) • Bangladesh’s 1.5°C domestic emissions pathway show emissions reductions of 8-30% below 2011 levels • With international support, Bangladesh will be able to implement mitigation action that will close the gap between its fair share level and domestic emissions level. • No update in NDC targets in interim NDC submitted in 2020
Bangladesh: power sector transformation
• 1.5°C compatible pathways:
     • Increase share of renewable energy (accounting for 2% in
       2017) to 24-36% by 2030
     • Phase out of natural gas by 2040
     • Full decarbonisation by around 2040

• Risk: Stranded assets in fossil-based generation

• Opportunities:
   • Bangladesh’s ambition to be developed country by 2040
   • Less dependency on energy import and improved energy
     security
   • Electrification of end-use sectors, leapfrogging in cooking
   • Diversified and climate resilient electricity generation
   • Reduction of agricultural emissions
Japan: snapshot
• Energy sector accounts for 88% of emissions,
with power alone accounting for 40%.
• Oil makes up the largest share of TPES,
primarily used in transport and industry.
• Historically, nuclear, gas, and coal each made
up around a quarter of power supply.
Sources : Primap-Hist 2019 and IEA CO2 Fuel 2019
• Following Fukushima accident in 2011, gas
share in power increased to 40%, coal to
34%.
• Japan is the world’s largest importer of LNG.
As of 2017, imported LNG makes up 23% of
TPES. Imports have declined in recent years
however.Japan: 1.5°C emissions trajectory
• Current NDC (excl. LULUCF): 23% reduction
below 2013 by 2030
• Proposed NDC: 46% reduction below 2013 by
2030
• 1.5°C cost-effective pathways (excl. LULUCF):
• GHG emissions 60-73% below 2013 by 2030
• GHG emissions 95-100% below 2013 by
2050
• PM announcement in October 2020: Net zero
GHG and carbon neutrality by 2050
• To reach net-zero GHG by 2050, Japan will need to
balance remaining emissions with sinks of around –
29MtCO2e by 2050
• Japan will need to go further than its domestic
target, and provide substantial support for emission
reductions to developing countries.Japan: power sector transformation
• Japan has historically relied on energy efficiency and nuclear power
to meet increasing demand and ensure security of supply
• 1.5°C compatible pathways :
• RE contributing 51-84% of power generation by 2030
• At least 60% RE by 2030 to avoid reliance on nuclear energy
• Zero emissions power by around 2040
• Coal phase out by 2030
• Gas phase out by 2038-2040
• Decarbonised power: what are the opportunities?
• Energy efficiency measures
• Solar PV on buildings and offshore wind, paired with
geothermal and hydropower, are technologies most readily
availablePakistan: snapshot
• Energy sector accounts for 47% of emissions,
mostly CO2.
• Agriculture accounts for 42% of emissions,
mostly CH4.
• Pakistan benefits from a diversified energy
mix but fossil fuels
Sources : Primap-Hist 2019 and IEA CO2 Fuel 2019
• make up around 60% of primary energy
• >60% of electricity generation.
• In recent years, country has met growing
energy demand mostly through new coal fired
plants and gas imports.
• Pakistan plans to meet growing energy
demand by expanding coal capacity : risk of
stranded assets
Sources : 1.5° National Pathway Explorer, IRENA 2021, Global coal plant tracker 2021 Sources : ADBInstitute 2019 Sources : IEA WEB 2019Pakistan: 1.5°C emissions trajectory
• Estimate Pakistan NDC to 206-225% above
2015 levels excl. LULUCF
• 1.5°C compatible pathway show that Pakistan
reduce emissions
• 30-48% below 2015 levels by 2030,
• 66-71% below 2015 levels by 2050.
• Towards net zero, remaining emissions will need
to be balanced by negative emissionsPakistan: power sector transformation
• Pakistan targets to increase
• share of RE (excl. large hydro) by 30%
• large scale hydro by another 30% by 2030.
• 1.5°C compatible pathways:
• RE contributing 48-85% of power generation by 2030,
• Zero emissions power by around 2036-2038
• Decarbonised power: what are the opportunities
• New green industries for job creation (e.g. electric vehicle
industry)
• Cheaper electricity, ease burden of circular debt
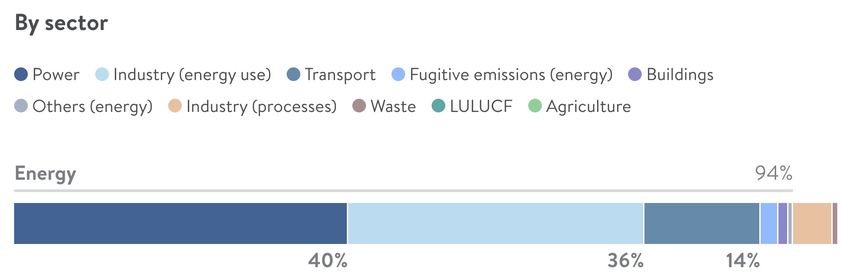
• Decouple emissions from economic developmentSingapore: snapshot
• Energy sector accounts for majority (94%) of emissions,
• mostly from electricity (40%)
• energy use from the industry sector (36%)
• Singapore does not produce oil or gas, but serves as a
major oil refining and petrochemical hub.
Sources : Primap-Hist 2019 and IEA CO2 Fuel 2019
• Fossil fuel dominates Singapore energy system :
• 96% of power mix from natural gas.
• 80% of primary energy from oil, remainder mostly
gas
• Low Emissions Development Strategy focuses on natural
gas in the short term
• stranded assets risk (LNG terminal)
• job losses and economic disruption
• Gas dependent on international markets = energy and
economic insecurity. Sources : IEA WEB 2019Singapore: 1.5°C emissions trajectory
• In March 2020, Singapore updated its NDC
• by changing its intensity target to an absolute
target of 65 MtCO2e/yr by 2030
• CAT estimate 24% increase above 2015 levels
• Target of net zero emissions
• in the second half of the century
• halving its GHG emissions to 32 MtCO2e/yr by
2050.1 Estimate of 38% below 2015 levels.
• A 1.5°C pathway would require Singapore to reduce
GHG emissions
• by 52-61% below 2015 levels by 2030
• by 98% below 2015 levels by 2050
• Decarbonising the energy sector will drive down CO2
levels, particularly energy combustion
132 MtCO2e calculated in AR4 values by Climate Action Tracker. Policy cites 33 MtCO2e/yr in AR5 GWP values.Singapore: power sector transformation
• 1.5°C compatible pathways require SGP
• to accelerate RE uptake from 2% of the current power
mix to
• 8-13% in 2030
• 95-97% in 2050
• Reach a zero emissions power by 2040
• SGP’s high reliance on natural gas would need to be phased
out in the 2040s
Policy measures that could support energy transformation
include:
• accelerating shift in transport sector to electric mobility
• upgrading and electrifying the building and industry sectors,
improving material efficiency,
• significant scaling up of RE including exploring options for
imports, and use or export of zero emission fuels e.g. green
hydrogenQ&A https://1p5ndc-pathways.climateanalytics.org/
You can also read