RENEWABLE ENERGY IN ESKOM - European Parliamentarians with Africa Wendy Poulton General Manager - Sustainability and Innovation
←
→
Page content transcription
If your browser does not render page correctly, please read the page content below
SUPPORT
  RENEWABLE ENERGY IN
        ESKOM
  European Parliamentarians with Africa

                   Wendy Poulton

General Manager – Sustainability and Innovation

   SUPPORT, LEAD, INNOVATE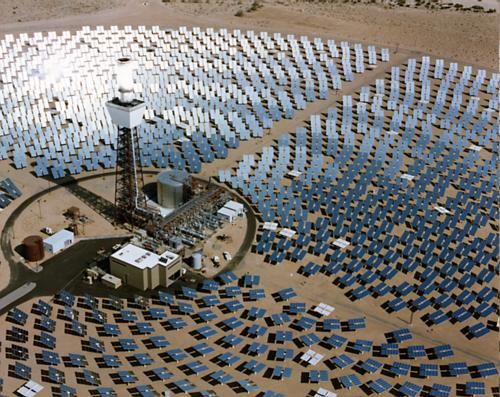
Presentation outline
• Current share of           Imported
  renewable                  hydro          Coal
                                                      Imported
  power                                               hydro
                                                                 Imported
  generation in                  Solar                           Gas
  Eskom
                      Imported
                      Gas
• Possibilities for
  renewable
  power
  generation in SA
                                                                 Biomass
  – opportunities
  and challenges
                          Wind
• Future plans on
  renewable                              Wave &    Uranium
                                         Current
  energy in Eskom
                                                                    2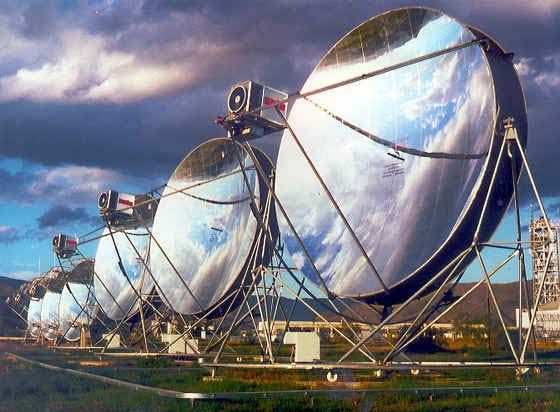
Current share of renewable
power generation in Eskom
Current share of renewable power generation in Eskom

 By energy*

  By power
  generation*

                 *Reference: Eskom 2009/2010 annual report
                                                             4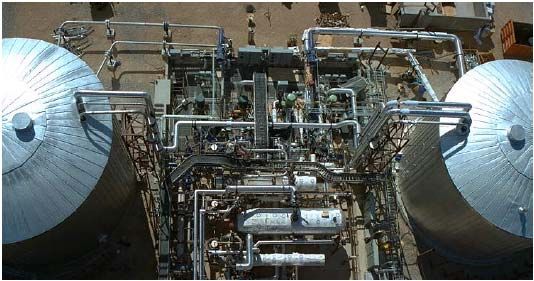
Possibilities for renewable power
  generation in South Africa –
 opportunities and challenges

Possibilities for renewable power generation in SA

      ENERGY TYPE                                   ESTIMATED TOTAL ENERGY POTENTIAL

      Wind Energy                                                                                3 GW

      Hydropower                                                                              7154 MW

      Solar Energy                                                                             64.6GW

      Wave Energy                                                                            56800 MW

      Ocean Currents                                                                          2000 MW

      Solid Waste                                                                      40.5PJ per annum

      Sewage Derived Methane                                                           1.13PJ per annum

                                                                            Bagasse: 210 GWh per annum
      Biomass                                                      Fuelwood & Pulp: 12167 GWh per annum
                                                                            Manure: 5612 GWh per annum

 Source: DME, 2003 Whitepaper on Renewable Energy

                                                                                                          6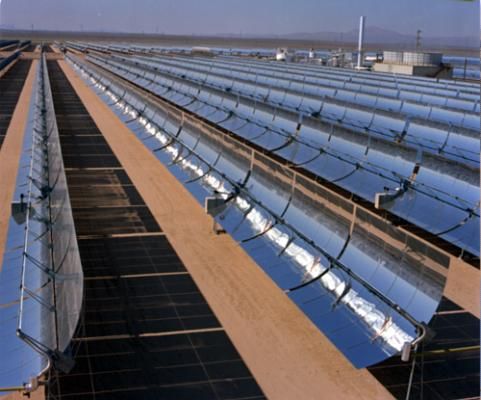
Technology Status and Application
RENEWABLE ENERGY OPTIONS
                         Near or early commercial
Commercial               (Proven)                      Pre-commercial        Research
                                                                             Ocean
Wind                     CSP - Tower                   Ocean wave            Current
                                                                             Solar
CSP - Trough             CPV                                                 Chimney
Hydro                                          Biomass co-firing
                            >20 MW per site PROVEN OPTIONS - SA RELEVANT
Biomass - Wood              Commercial             Pre-commercial (proven)
                            Wind                   CSP - Tower
Biomass - Bagasse           CSP - Trough           CPV
                            Biomass - Bagasse
Biomass - Landfill gas      Biomass - Wood waste
                            Biomass - MSW                                          Strategic fit:
Biomass - MSW               PV                                                     Baseload?
Biomass - Other                                                                    Mid-merit?
                                                                                   Peaking?
PV

Tidal
                                                                                                7
Resource Availability - Wind Energy Resource

                                  National Resource
                                  • The wind resource can be
                                    described as moderate with the
                                    East and West Coast regions
                                    having an avg. resource of app.
*                                   4 to 6m/s per annum @ a
                                    height of 10m or 6 to 8 m/s @
                                    50m.

                                  • The wind is extremely seasonal
                                    and varied, resulting in
                                    relatively low avg. capacity
                                    factors between 15 and 25%,
                                    though higher capacity factor
                                    sites exist.

    * Ref. NASA
                                                                 8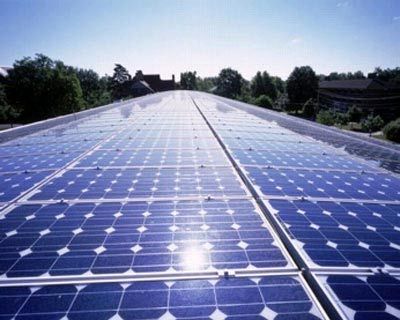
Wind Solving the intermittency issues
• Wind-generated power is a variable         • Technological solutions to mitigate
  resource, and the amount of                  large scale wind energy type
  electricity produced at any given            intermittency exist such as increased
  point in time by a given plant will          interconnection (into the National Grid).
  depend on wind speeds (among                 As more turbines are connected over
  other factors).                              larger and larger areas, the average
                                               power output becomes less variable.
• If wind speed is too low (less than
  about 2.5m/s) then the wind turbines       • In the case of wind power, operational
  will not be able to generate
  electricity, and if it is too high (more     reserve, by existing base load stations,
  than about 25m/s) the turbines will          is the additional generating reserve
  have to be shut down to avoid                needed to ensure that differences
  damage.                                      between forecast and actual volumes
                                               of wind generation and demand can be
• While the output from a single               met.
  turbine can vary greatly and rapidly
  as local wind speeds vary                  • Battery storage is expensive but other
                                               storage options are considered
• Capacity Factor: Wind power
  typically has a capacity factor of 20-
  40%.

• Dispatchability: Low
                                                                                        9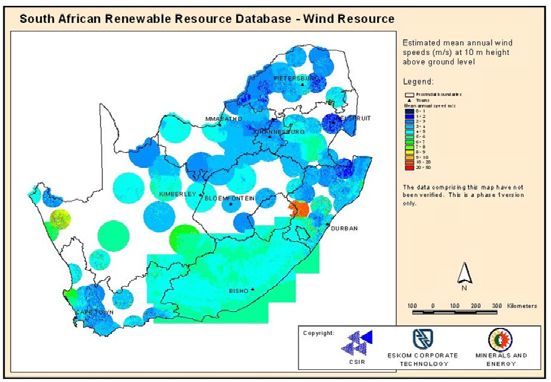
Resource Availability - Ocean Energy
    Resource
                                  • RSA - Good wave potential along certain coastal
                                    areas, comparable to international high-resource
                                    areas.

                                  • The highest wave power potential, kW/m, occurs
                                    off-shore.

                                  • The highest wave power generation occurs
                                    during the austral winter months, i.e. June, July
                              *     and August

                                  • The largest wave power yield (between 20 and 35
                                    kW/m) is concentrated along the South and
                                    South East/ West coast.

                                  • Significant energy source in the form of the
                                    Agulhas current.

                                  • Initial findings indicate a significant resource
                                    capable of delivering capacities in the GW range

                                  • Ocean currents measured ranged from 1-2 m/s2.
* Ref. Ocean Power Delivery       • Limited tidal resource.                             10
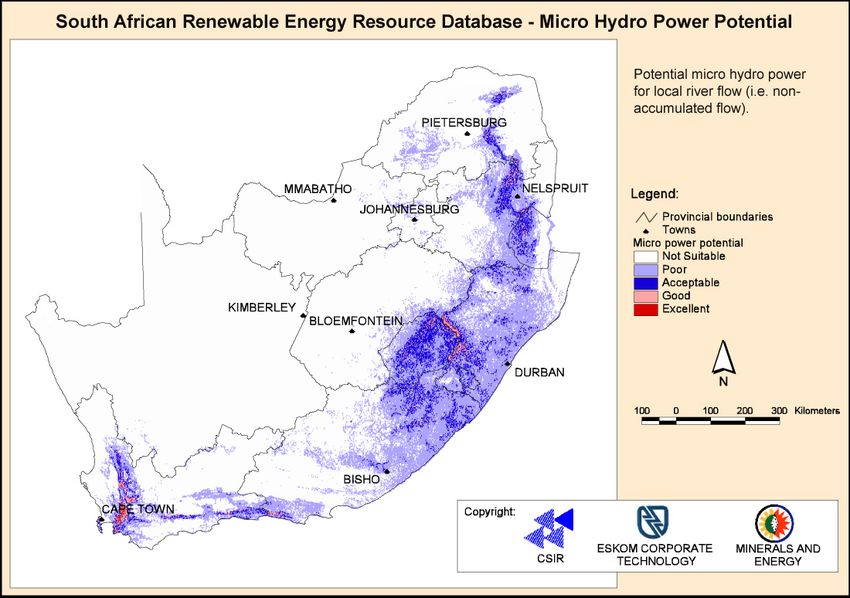
Micro-Hydro Resource*
Installed Capacity
(small/mini/micro and pico
hydropower) 33.92MW
Potential for development*
Firmly established 69MW,
additional long-term 94MW
Main opportunities exist for mini
and micro systems (Strategic Drivers for Solar Power
• Solar energy a significant South Africa’s Solar Irradiation
resource in South Africa levels is amongst the best in the world
• Solar power could potentially
have a significant impact on
a supply-side base load
generation
• The potential supply of
dispatchable power in future
is in the GW range
South Africa experiences
• Energy storage an option some of the highest levels
of solar radiation in the
• Positive impacts on local world.
The average daily solar radiation in South Africa
industry and GDP growth varies between
4.5 and 6.5 kWh/m2 (16 and 23
• Local green job and skills MJ/m2), with excellent
base areas such as Upington
- 8.17 kWh/m2/day. 12Solar technology options
Image - NREL
Image - PSA
Image - eSolar
Image - NREL Image - Ausra
13Technology Basics
• CSP technologies use large
sun-tracking mirrors to
concentrate the solar
radiation and to heat a
working fluid.
• The working fluid is then
used to generate steam,
which powers a turbine and
generates electricity.
14SOLAR Solving the intermittency challenge
• Solar power is generated by using the energy in the sun either directly
(PV panels, SWH) or indirectly (CSP- heats salts or water to turn a
turbine)
• Solar power is a very predicable intermittent energy source: whilst the
sun’s energy is not available all the time, we can predict it to a very
good degree of accuracy
• Solar power output varies throughout the day and through the seasons,
and is affected by cloud cover
• The extent to which the intermittency of solar-generated electricity is an
issue will depend to some extent on the degree to which the
generation profile of solar corresponds to demand
15Future plans on renewable
energy in EskomIPP’s and REFIT
• Introduction of private sector generation has multiple benefits:
• Diversification of supply and nature of energy production
• Introduction of new skills and capital
• Reduction of funding burden on Government
• Benchmarking of performance and pricing
• Reduction of borrowing requirement of Eskom
• Eskom is committed to facilitate the entry of independent power
producers and will collaborate with Government, NERSA and
developers of projects to ensure this happens.
• Government is working on the enabling environment for IPPs using
the Inter-ministerial Committee on Energy process.
• Eskom has already signed agreements with some IPPs in the last 6
months and will continue to do so within the framework of the
Integrated Resources Plan and the tariff determination for MYPD2. 17Eskom’s 6 point plan on climate change
• Diversification of the generation
mix to lower carbon emitting
technologies
• Energy efficiency measures to
reduce demand and greenhouse
gas and other emissions
• Innovation through research, Recuperator
Compressor
Turbine
Generator
demonstration and development
Gearbox
Reactor
Intercooler
• Investment through carbon CCS
market mechanisms CBCS
• Adaptation to the negative
impacts of climate change
• Progress through advocacy,
partnerships and collaboration
18Eskom’s Renewable Energy Focus
• Big Four renewable energy resources considered
• Biomass (Co-Firing),
• Solar (CSP),
• Wind,
• Ocean (Waves and Current)
• Eskom’s programme seeks to find multi-MW options for grid
supply
• Off-grid or stand-alone renewables is not currently part of
Eskom’s implementation, the exception is solar water heaters in
the DSM portfolio
• Research into off-grid or stand alone options in support of
national objectives
• Regional Options also considered
• Grid connection studies underway
19Renewable Energy Research
Includes:
• Cofiring of Biomass in coal
stations
• Municipal Solid Waste
• Continued support for solar
water heaters
• Commission 100MW Solar
• Research into off-grid or
stand alone options
• Site specific wind and solar
resource assessments Ocean Current
• Potential for the retrofit of
solar hybrid to coal stations
20Concentrating Solar Power
Central Receiver
• Application
Grid connected supply- Eskom impact
High
• Power Range
Plant sizes of 100MW
• Footprint
100MW would require app 4km2
• Status
EIA complete
Partial funding through the CTF
Technology review underway
21Commercial Wind
• Application
Grid connected supply. Eskom impact –
Medium/High
• Power Range
Plant size - 100MW
• Footprint
100MW would require app 20km2
• Status
EIA complete
Partial funding through the CTF
Commercial stage
22Biomass study
The initial uptake of biomass co-firing in Eskom is based on:
• Minimising Risks on plant availability
• Ease of Implementation
• Minimising initial Capital Cost
• Utilising fuels that meet local sustainability criteria (including social, economic and
environment)
The option that best fits these requirements is expected to be co-milling or separate
milling and co-injection of wood chips or pellets with coal
• Of the biomass fuels available wood based biomass have the largest growth expectation,
with the main advantages being their high availability, heat content and transportability
• It is the biomass of choice for most European Utilities
• Technical risks tend to be lower than other biomass fuel sources
• Up to 5-10% wood pellet biomass can be co-combusted without significant
modifications to the existing plant
• Biomass storage, pre-processing and handling are generally the largest costs associated
with conversion into co-firing in a coal plant
23Solar water heating
• Eskom has been active in the area of solar water heating for many years.
• Activities in the 90s were focussed on assessments of different systems and
attempts to develop lower cost SA-based units.
• Subsequent work was aimed at understanding the requirements from the
systems and the behavioural impact on the consumer – as such several
pilot installations were made.
• The focus changed slightly as the SWH systems were not an attractive
option to the residential consumer, given the low cost of electricity. As such,
the use of SWH systems from a commercial and industrial perspective was
considered.
• Current efforts are aimed at increasing the uptake significantly. Efforts are
focussed not only on significantly increase the number of systems installed,
but also see the accreditation of suppliers and registration of installer
significantly enhanced; a key factors in enabling higher market penetration.
24Funding for Renewable Energy in Eskom
• 100 MW Wind and
CSP plants partly
funded through the
CTF
• Eskom renewable
energy projects
included in our tariff
application
• CDM credits evaluated
on all projects
25Conclusions
• South Africa has significant renewable energy
potential
• A number of projects are underway in Eskom
• Research focused on areas of future potential –
resource and technology assessments as well as
storage options
• Local content and important consideration
• Percentage of renewable energy in the mix to
increase
26Thank you
You can also read


