Macht Macht Märkte? 30. Freiburger Winterkolloquium Forst und Holz 29. Januar, 2010 - Freiburger Winterkolloquium Forst ...
←
→
Page content transcription
If your browser does not render page correctly, please read the page content below

Macht Macht Märkte?
    30. Freiburger Winterkolloquium Forst und Holz
                                  29. Januar, 2010

1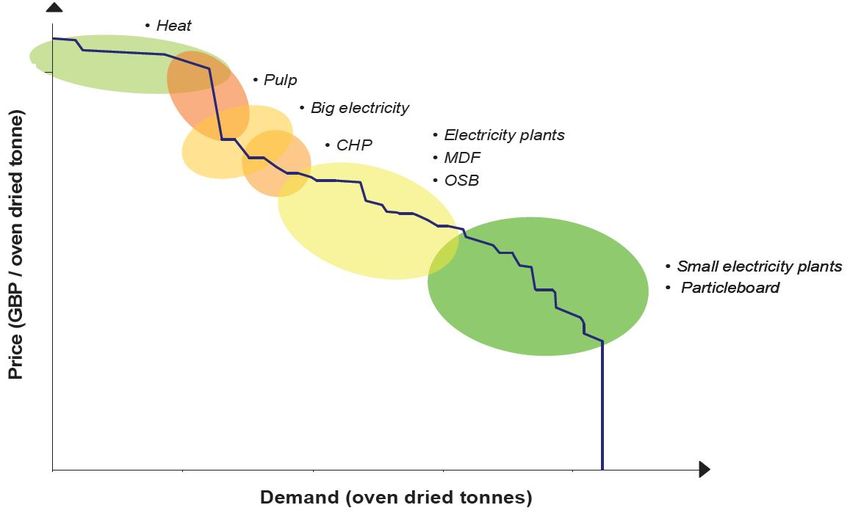
All rights reserved. No part of this document may be reproduced in any form or by
                any means without permission in writing from Pöyry.

                               Copyright © Pöyry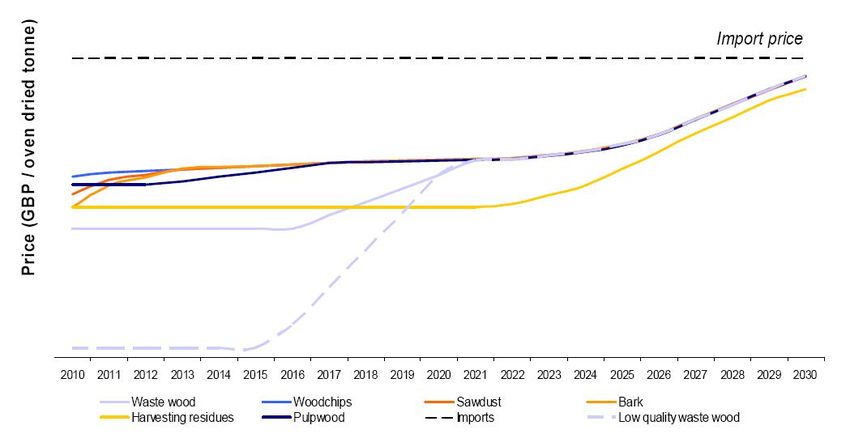
Contents

    1) The POYRY Group

    2) Global biomass consumers and their market power

    3) Bioenergy as a new market power?

    4) Case study: The UK biomass market

    5) Where is all this biomass supposed to come from?

    6) Consequences for wood markets and traditional players

    7) Is this the end?

3
The POYRY Group

                                                            Net sales €821.7m in 2008
                                                                 Personnel 7924

            Energy                     Forest Industry               Transportation                 Water &           Construction Services
                                                                                                   Environment
    •   Renewables, Waste to       •   Investment studies,       •   Rail transportation     •   Water supply/waste   •   Project management
        Energy                         Design, Engineering           systems                     water                •   Architectural design
    •   Energy markets, policies   •   Management consulting         Road, tunneling and     •   Organic waste        •   Structural engineering
    •   Sector/producer            •   Performance Improvement   •   bridge projects             management           •   Building technology
        strategies                 •   Bioenergy, Renewables         New service offerings   •   Flood protection     •   Construction supervision
    •   Plant design and           •    Recycling, Value from
        operations                      waste, sustainability

4
Global biomass consumers and their market power

5
Wood Consumption by Industries
More than half of the wood currently used on a global level, is used in energy
production in one way or the other. The pulp industry is by far the largest
consumer of small dimension roundwood and woodchips in most regions.
                                                             Wood Harvest
                                                              1.57 billion odt                                 Data for 2007
                                                             (1.70 billion odt)                                ( ) = projection for 2020

                                                   51%                                         49%
                                         Fuelwood                                   Industrial Wood
                                        0.80 billion odt                             0.77 billion odt
                                       (0.82 billion odt)                           (0.88 billion odt)

                                                         61%                                    31%                                    8%

                                          Saw and Veneer Logs                     Pulpwood (round and chips)               Other Industrial Wood
                                            0.47 billion odt                          0.24 billion odt                        0.06 billion odt

    Heat and Power                 Sawnwood                 Wood-based Panels                                Pulp
     0.96 billion odt            394 million odt             164 million odt                             259 million odt
          62%

                                                                   63 million odt
            83 million odt
                                         Residues 197 million odt
                                                                                                Paper and Paperboard              Recycled Fibre
                                                                     51 million odt
          78 million odt

    Energy Use               Mechanical Forest Products Industries                                       Pulp and Paper Industries

6
Regionalised Wood Consumption Pattern
In the Nordics and in the Americas most of the small dimension roundwood and
sawmill woodchips have historically been used for pulp production, while in
Western and Eastern Europe the wood-based panel industry has a relatively larger
share.
100%
Share of small dimension roundwood
and woodchip consumption
80%
60%
40%
20%
0%
Nordics Western Eastern North America Latin America
Europe Europe
Pulp & Paper Wood-based Panels
7Correlation of pulp and panel prices and wood prices
Historical price correlation Historical price correlation
US Southeast Germany
200 200
180 180
160 160
140 140
In d e x e d (1 9 9 1 = 1 0 0 , re a l)
In d ex e d (1 99 1 = 1 0 0, re al)
Softwood
120 120
100 100
Softwood
80 80
60
NBSK pulp
60 Particle board
40 40
20 20
0 0
1991 1992 1993 1994 1995 1996 1997 1998 1999 2000 2001 2002 2003 2004 2005 2006 2007 2008 1991 1992 1993 1994 1995 1996 1997 1998 1999 2000 2001 2002 2003 2004 2005 2006 2007 2008
Historically, Germany has the highest biomass
The pulp industry is the biggest end-user of prices in Europe. The biomass price is largely
pulpwood and woodchips in US Southeast and in driven by the wood panel industry - particleboard
Canada. and MDF and an already well developed bioenergy
market.
Historically, biomass prices have fluctuated
around the wood paying capability of the pulp
mills, tracking the price development of Northern
Bleached Softwood Kraft (NBSK) pulp
8Bioenergy as a new market power? 9
Bioenergy as a new Market Power?
EU Member States have created a range of support measures and market based
instruments for promoting renewable energy production. Currently, the 27 Member
States operate 27 different national support schemes. Most of them are different
forms of feed-in tariffs and premiums or quota obligations.

     Feed-in-tariff and premiums

     Quota obligations
                                      Feed-in tariff and premiums
     Tax incentives /                 Government controlled feed-in tariffs are granted to operators
     Investment grants                of eligible domestic renewable electricity plants for the
                                      electricity they feed into the grid. Premiums are paid to the
                                      producer on top of the electricity market price. The feed-in
                                      tariffs normally are granted for 10-20 years and provide a
                                      strong long term degree of certainty which lowers the market
                                      risk faced by investors.

                                      Quota obligations
                                      Governments impose an obligation on consumers, suppliers or
                                      producers to source a certain percentage of their electricity
                                      from renewable energy.

                                      Fiscal incentives
                                      Producers of renewable electricity are exempted from certain
                                      taxes (e.g. carbon taxes).

10
Bioenergy as a new Market Power?
Even if both the theoretical harvest and residue potential were fully utilised, the
current EU target for renewable energy, maintaining the current share of wood-
based biomass within the renewable energy sources, is impossible to achieve on a
sustainable basis from the EU forest resources.
Wood Demand Development and
Supply Potential in the EU The EU aims at achieving 20% renewable
Million m3
energy share of total energy consumption by
Actual Forecast
1,200
EU target 2020
2020. Assuming the current share of wood-
1,050
based biomass within renewable energy
sources the target means a combined
900
industrial and energy use of wood of over
750 1,200 million m³ in 2020. This is not possible to
600
achieve on a sustainable basis from the EU
Residue Potential
forest resources.
450
300 Industrial and Market adjustment will take place through:
energy use
150 – the level of achievement of the EU target
0
– the share of wood in renewable energy
increased use of harvest residues and low
1993
1994
1995
1996
1997
1998
1999
2000
2001
2002
2003
2004
2005
2006
2010
2015
2020
–
quality wood
Softw ood logs Softw ood pulpw ood
– high-yield bio-energy plantations
Hardw ood logs Hardw ood pulpw ood – import of biomass into the EU
Other Industrial roundw ood Fuelw ood
Total Potential
11Case study: The UK biomass market 12
Case Study UK: Bioenergy Players
If most of the large-scale projects planned in the UK are successfully completed,
an additional 3GW of biomass-based energy capacity will be created by 2016. This
is likely to create a demand for in excess of 25 million gmt of biomass.
RWE Forth Energy
(Grangemouth)
(Stallingborough)
Operational facilities 65MW 100MW
Anglesey Drax
Planned facilities Aluminium Forth Energy (Immingham)
(Holyhead) (Rosyth) Drax 300MW
Planned facilities (S36/local consent granted) 300MW (Selby)
100MW
300MW
Express Power
UPM (Tilbury)
(Shotton) Prenergy 60MW Helius Drax
20MW (Port Talbot) (Bristol) (Hull)
350MW Forth Energy 100MW 300MW
Sembcorp (Leith) Ayrshire Power
Drax 100MW (Hunterston)
(Wilton)
(Selby Co-firing) Forth Energy 240MW
30MW
500MW (Dundee)
UPM MGT Power 100MW MGT Power
E.ON
(Caledonian) (Teesside) (Tyneside)
(Lockerbie)
26MW 300MW E.ON 300MW
44MW
(Bristol)
Welsh Power (Newport) 49MW 150MW
2014
2016
2008
2009
2010
2013
2015
2006
2007
2011
2012
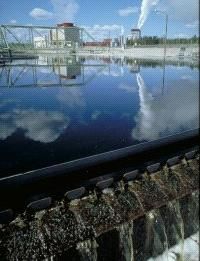
13Case Study UK: Supply Surplus Development Waste wood and harvesting residues are the only biomass assortments in the UK, which still offer a good supply surplus. Bioenergy players will mainly target these assortments and most of the current surplus will be consumed by 2022. 14
Case Study UK: Aggregated Demand Curve 2020
Particleboard mills and small electricity plants have the lowest wood paying
capability and are hence facing the highest risk for potential market exits.

15
Case Study UK: Bioenergy Price Forecast
The forecasted UK demand development will result in significantly rising domestic
biomass prices, capped by the average price for imported biomass.

16
Case Study UK: Bioenergy Players
The scale of the planned biomass-based energy capacity in the UK is such that the
majority of the biomass will need to be imported. Therefore most of the large-scale
projects will strategically be located at deep-water ports.

          Forth Energy                                            Forth Energy
          Grangemouth                                               Dundee

          Forth Energy                                            Forth Energy
            Rosyth                                                    Leith

         Ayrshire Power
                                                                   MGT Power
          Hunterston
                                                                    Tyneside

          Drax
          Selby                                                    MGT Power
                                                                    Teesside

     Anglesey Aluminium
          Holyhead                                                    Drax
                                                                      Hull
             Helius
             Bristol
                                                                      Drax
                                                                   Immingham
          Welsh Power
           Newport
                                                                       RWE
                                                                 Stallingborough
            Prenergy
           Port Talbot
                                                                    Express
             E.ON                                                    Power
             Bristol                                                Tilbury

17
Where is all this biomass supposed to come from? 18
Global Biomass Resources
North America and Russia have the potential to become major biomass supply
regions. Continuing plantation developments in Latin America also offer interesting
opportunities as biomass source. Sub-Saharan Africa creates strong interest from
plantation developers and could be a key strategic biomass source in the future.
                                                       Increasing wood supply       Only marginal potential to
     Slightly decreasing wood supply as harvesting                                  increase harvest level in Europe.     Russia holds significant unutilised
                                                       based on maturing
     quotas in Eastern-Canada are reduced to prevent                                Increasing pressure from bio-         harvest potential. However a
                                                       softwood plantations.
     unsustainable harvesting.                                                      energy on wood resources              significant part of unutilized
                                                                                                                          harvest potential is currently
     Temporarily                                                                                                          inaccessible. Export duties are
     increasing and                                                                                                       hampering the trade in logs.
     significant harvest
     potential due to pine
     beetle infestations in
     B.C.. Decreasing
                                                                                                                                     Asia-Pacific will continue
     harvest potential in
                                                                                                                                     to be the world's largest
     the long term.
                                                                                                                                     wood deficit area.

          Stable or slightly
          decreasing
          long term wood
          supply potential.                                                                                                          Controversial
                                                                                                                                     substitution of natural
          Latin America holds the world's                                                                                            forest with plantations.
          largest hardwood stock, however
                                                         Increasing forest                       Good potential to
          mostly inaccessible natural tropical
          forests.                                       plantations but                         establish new
                                                         potential conflict                      plantations but
          Substantially increasing removals
                                                         with natural                            require investments
          based on fast-growing plantations.                                  Potential to                                Increasing removals
                                                         forests may                             and time
          However increasing competition for                                  expand                                      based on existing and
                                                         restrict wood
          available land.                                                     plantation area                             new plantations,
                                                         supply.
                                                                              is very limited.

                       Favourable biomass supply                     Stable biomass supply                              Biomass deficit

19
Current and Future Woodchip Trade Flows The global export trade of woodchips is still mainly driven by the pulp industry and reached 19.4 million odt in 2008. The Pacific Rim trade accounts for 77% of this volume with Australia, South Africa, Chile and Vietnam being the major suppliers to Asia. The Atlantic trade is much smaller but is expected to grow significantly in order to meet biomass demand in Europe. 20
Wood Pellet Trade Flows (2008)
Global wood pellet production reached almost 11 million tons in 2008. The most
established international trade flow has been between Canada and Europe, although
potentially large flows from the US Southeast also began in 2008. More recently
wood pellet producers in South Africa and Australia have started to supply the
European market.

                                     INTRA-
                                   EUROPEAN
                                     TRADE

                                                                 Emerging
                                                                trade flows

                              - Million odt of wood pellets -

21
Consequences for wood markets and traditional players 22
Consequences for Wood Markets and Current Players

     The biomass demand for energy generation will continue to grow on a European
     and global level.
     The development of potentially large future bioenergy markets (e.g. US, Canada,
     China, etc.) depends on political key decisions and financial incentive schemes.
     The international biomass trade will grow, offering good opportunities for forest
     owners, plantation developments and trading organisations.
     Competition for key biomass assortments will increase and some biomass
     markets will show rising biomass prices, forcing players to exit the market.
     An increased utilisation of harvesting residues and recycled wood can provide a
     certain relief for biomass markets.
     A rising biomass demand offers good opportunities for forest owners to diversify
     their off-taker portfolio. However, traditional biomass users should and will always
     be part of this off-taker portfolio.
     Traditional forest industry players should not forget that they are in a very
     favourable position to participate in the bioenergy business sector, be it as partner
     for bioenergy developers or be it as single entities.

23
Is this the end? 24
The Strategic Choice – ‘Return on Site’
The wood, biomass and recovered paper/wood streams (in a new context of bioenergy
and waste management) open the way to strategies based on best utilisation of the
company’s infrastructure (= ‘return on site’).

                                                     Nordic, C-Europe, Southern Strategies - Return on site
                                     Bioenergy,
                                  Waste Management
                                    New Products              Company

                                                        Managed growth using
                                                        key drivers: bioenergy,               ?
                                                        waste management,
                                                        new products through
                                                        biomass resource, and
                                                        waste streams.            Managed portfolio
                                                                                  redirecting wood and
                                                                                  biomass flow
                                                                                                           Company
Strategy Concept. The strategy process is
based on increasing the 'return on site' -
increasing the return we get, measured on the
current infrastructure we have - fully utilising                                                   Wood Products, Paper
these sites and infrastructure. New processing
                                                                           Strategic Questions
facilities   (e.g.   power    plants,    biowaste                          Life cycle of the site (current business) in terms of best
management, composite products etc) can be                                 return on site.
invited on-site (and not necessarily funded by the                           Paper demand
panel or paper industry).                                                    Wood/fibre paying capability

25
Contact Details
Hannes Lechner
Head of Bioenergy UK
Pöyry Forest Industry Consulting Ltd.
Century House, Station Road
Cheam, SM3 8SW
London
United Kingdom
Tel: +44 208 770 3200
Fax: +44 208 770 2115
hannes.lechner@poyry.com
26You can also read