Case Study Disruption and Stranded Assets in the Energy Sector - The Risks and Opportunities of Climate Change
←
→
Page content transcription
If your browser does not render page correctly, please read the page content below
The Risks and Opportunities
of Climate Change

Case Study
Disruption and
Stranded Assets
in the Energy
Sector
The starting point for assessing the economic competitiveness of              Even when assessed narrowly through an LCOE lens, the energy
different utility-scale power generating and energy storage                   sector provides a compelling case study for the risks and
technologies is normally their levelised cost of energy (LCOE).               opportunities associated with low carbon transition. Particularly,
LCOE reflects the life cycle costs of different technologies as               since 2016 when Carbon Tracker found on average new build wind
some technologies have higher capital costs (e.g. solar and wind)             and solar PV were cheaper than new build coal and gas globally.
while others have higher operating costs (including fuel) (e.g. coal
and gas). However, LCOE only tells part of the story as this case
study will explore.

Comparison of LCOE results across all scenarios

Source: Carbon Tracker: 2016 The end of the load for coal and gas.

As with all LCOE analysis, understanding                                      As a demonstration of how quickly these costs have moved,
                                                                              Lazard, in its 2018 annual LCOE review found that in some cases
assumptions is important. Carbon Tracker’s                                    new utility scale solar and wind had become cheaper than
analysis challenged conventional                                              existing coal and gas. The cost of storage, which allows for the
assumptions in a number of areas for both                                     intermittency of renewable sources to be managed, is also falling
                                                                              rapidly. These dramatic changes are without Carbon Tracker’s
current and 2020 scenarios including                                          assumptions of a carbon price and differentials in cost of capital
utilisation rates, differentials in costs of                                  and assumes no additional costs for site remediation for coal.
capital and the introduction of carbon
prices (albeit modest ones at US$5 (2016
updated) and $10 (2020 2oC) per tonne).

Chart 3: Levelised cost of energy comparison – unsubsidized analysis

Source: Lazard: Levelized Cost of Energy and Levelized Cost of Storage 2018

                                                                                                                                                   2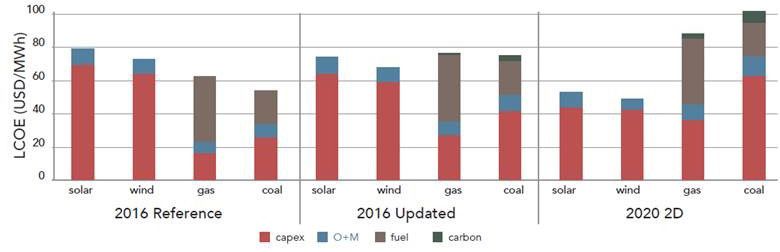
These trends are supported by cost Unlisted Infrastructure Fund, has electrified its fleet with plans
underway for the related Scandlines ferry business to do
declines in electric vehicles and batteries likewise.
and more advanced energy efficiency – IATA (the International Air Transport Association) has set three
technologies, which pose a threat to targets:
incumbent industries and demand for fossil • Improve average fuel efficiency by 1.5% from 2009 to 2020
fuels. Technological disruption driven by • Cap net aviation CO2 emissions from 2020 (carbon-neutral
efforts to reduce carbon emissions is growth)
happening or forecasted across industries. • Reduction in net aviation CO2 emissions of 50% by 2050,
For example: relative to 2005 levels in 2017.
– Increased use of light-emitting diodes (LEDs) will cut power – Five countries have announced their intention to ban sales of
consumption from lighting by 40% from 2013-2030, the U.S. new diesel and petrol cars – by 2030 (India, the Netherlands
Department of Energy forecasts. and Slovenia) and by 2040 (France and the United Kingdom).
– By 2050, wind and solar are expected to generate 48% of Corporates step in – the rise of self-
global energy supply, with hydro, nuclear and other
renewables adding an additional 23%. Coal, oil and gas- generation and direct purchasing
based generation is expected to fall to 29% from 63% in In addition to changing the dynamics of electricity markets,
2018, according to BloombergNEF. renewable energy has become increasingly attractive to
– Solar thermal and geothermal heating for district heating, companies wanting to buy electricity directly from sustainable
residential water heating, residential and industrial space sources.
heating and industrial drying, is being used for 25% of heat Renewables sourced by long-term corporate PPAs (power
demand in LATAM, 19% in Europe, 10% in the US, and growing purchase agreements) allow buyers to lock in cost competitive
at 25% yoy in Asia according to ren21. Coriance, the French renewable energy prices for long periods without exposure to
District heating company owned by our Unlisted Infrastructure commodity price swings. In the US, The American Wind Energy
fund, uses geothermal and biomass-fired boilers as Association tracks PPA purchases with growth in capacity and
renewable energy sources (in addition to traditional gas-fired). number of deals almost exponential since 2008.
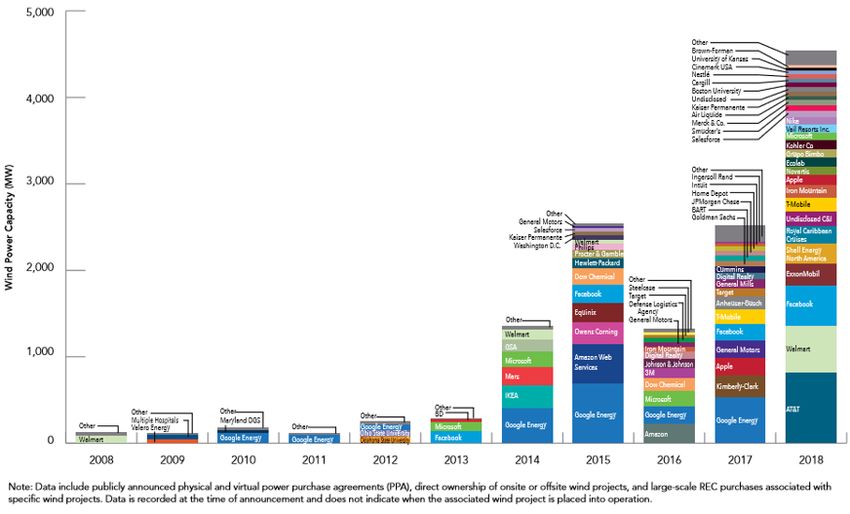
– The UN’s International Maritime Organisation, representing This includes self-generation – for example, commercial and
the global shipping industry, have adopted a climate change industrial rooftop solar, that has the added benefit of avoiding (to a
strategy, with the goal of switching to biofuels or electrifying degree) network / distribution costs.
engines. Forsea, a passenger ferry business owned by our
US Non-utility wind power purchases per year
Source: AWEA, U.S. Wind Industry Annual Market Report
3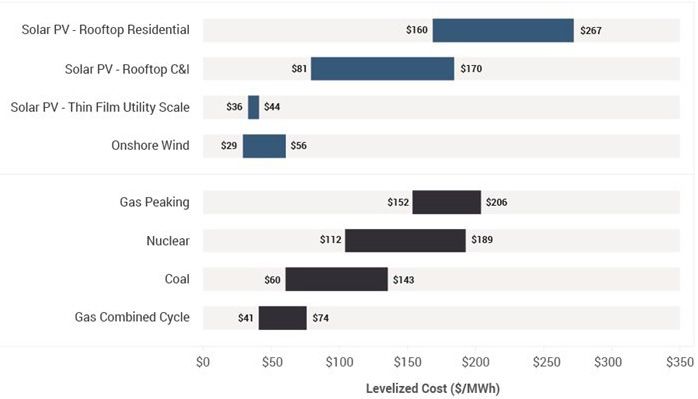
Storage including batteries the next wave                                             Notwithstanding this progress, batteries currently are not a viable
                                                                                      back-up solution. They can help to bridge to other energy sources
of the energy revolution                                                              but do not have the storage capacity to be a firming option in their
Advances in battery technology could help electric grids better                       own right. However, batteries are not the only storage technology
match renewables supply with demand. The largest lithium-ion                          with growing interest in pumped hydro and other storage solutions
battery in the world, the 100MW Tesla-developed Hornsdale                             supplemented by gas peaking plants.
Power Reserve in South Australia began operating on 1 December                        These rapid changes and the growing recognition of the unique
2017 and has been commended by the energy market regulator                            and multiple benefits that battery and other firming technologies
as providing “a range of valuable power system services,                              can provide is likely to further disrupt the energy sector.
including rapid, accurate frequency response and control.”
                                                                                      Asset stranding
In the USA a solicitation for new
                                                                                      These rates of change are striking yet forecasts have continually
developments to replace closing coal plants                                           underestimated the price declines and adoption rates for clean
by Xcel energy in 2017 received a record                                              technology. For example, the IEA’s World Energy Outlook
850 bids with the median price for                                                    forecasts have consistently underestimated actual renewable
                                                                                      energy installations.
renewables including storage being lower
than the operating costs
of existing coal plants.
IEA solar capacity forecast evolution                                                                                            LIEBREICH
                                                                                                                                  Associates
Chart 5: Difference between IEA scenarios and actual renewable energy growth

Global cumulative solar installations                                                Annual solar additions
GW                                                                                   GW per year
2,400                                                                                120

2,000                                                                                100

1,600                                                                                 80

1,200                                                                                 60

   800                                                                                40

   400                                                                                20

IEA
  0
       wind2010capacity
    2000           2020 forecast
                         2030  2040evolution
                                       0
                                         2000                                                         2010          2020
                                                                                                                                 LIEBREICH
                                                                                                                                  Associates
                                                                                                                                2030     2040

       Historical        2002         2004          2006    2008    2009      2010         2011    2012      2013   2014     2015      2016     2017

Note: 2002-2009 Reference, 2010-2017 New Policies Scenario                                                           Source: IEA World Energy Outlook
Global cumulative wind installations                                                 Annual wind additions
17
GW    31 August 2018                                 Smart Energy Day, FondationGW
                                                                                 Theper
                                                                                     Ark  Sion, 2018
                                                                                        year                                           @mliebreich
2,400                                                                                120

2,000                                                                                100

1,600                                                                                 80

1,200                                                                                 60

   800                                                                                40

   400                                                                                20

      0                                                                                0
          2000            2010               2020          2030        2040                2000       2010          2020        2030           2040

       Historical        2002         2004          2006    2008    2009      2010         2011    2012      2013   2014     2015      2016     2017

Note: 2002-2009 Reference, 2010-2017 New Policies Scenario                                                           Source: IEA World Energy Outlook

16 Liebreich
Source: 31 August    2018
             Associates,               Smart Energy Day, Fondation The Ark Sion, 2018
                         IEA World Energy Outlook                                                                           @mliebreich
These technology related changes alone risk companies, governments and investors being caught between expectations and rapidly
changing reality. However, technology is not the only factor driving these changes. In our 2015 Stranded Assets Tool Kit, we found a
number of factors were changing the supply and demand dynamics for fossil based energy. These factors include the human health
impacts of air pollution and related regulations to curb it, the increased costs of extracting lower quality fossil fuel reserves (as the best
and lowest cost sources are depleted, and the related increased risks and costs of exploration for unconventional oil and gas.

                                                                                                                                                          4
Table 1. Drivers of asset stranding for fossil fuel assets
Increasing costs Reducing demand
Increased regulation Increased regulation
Increasing
(carbon pricing, Reducing quality/ Increasin exploration (carbon pricing, Pollution and public
effectiveness
emissions reduction, energy intensity of costs (Deep sea, emissions reduction, health concerns
of renewable
SOx and NOx and source materials Arctic, tar sands) SOx and NOx and driving activism
energy storage
Mercury standards etc) Mercury standards etc)
Source: CFSGAM Stranded Assets Toolkit 2015
In the toolkit we recommended nine tests across three areas Similar tests can be applied to companies in other sectors as
which investment analysts can use to better understand the risks fossil fuel companies are not the only companies with transition
of asset stranding for fossil fuel companies. and stranded assets risks.
Table 2. Nine tests for assessing fossil fuel As this case study shows, while LCOE is a useful tool and tells a
company’s exposure to stranded assets compelling story about energy system transformation (and
disruption), it does not address other significant drivers of change
in supply and demand for high and low carbon energy
technologies. This has caught out traditional forecasting methods
Fossil Fuel Companies and associated losses for investors and companies who rely on
(Coal, Oil and Gas)
them to make decisions.
While the transition risks in the energy sector are unfolding the
Determine Test the company’s Assess the
quickest and are the most obvious, energy is not the only area
the company’s resilience with company’s
baseline position scenario analysis approach where these issues will unfold. The third paper in our series on
climate change explores these issues and finds a number of other
Assess company Using lower Benchmark the sectors equally exposed.
against the commodity prices company against
cost curve or margins good practice
Assess the supply Using higher capital Assess incentives
chain and local requirements and for potentional
regulatory environment cost of capital misalignment
Assess capital Using delayed Set engagement
plans and starts to objectives with
exploration activities planned projects the company
Source: CFSGAM Stranded Assets Toolkit 2015
This material has been prepared and issued by First Sentier Investors (Australia) IM Ltd (ABN 89 114 194 311, AFSL 289017) (Author). The Author forms part of First Sentier Investors, a global asset management business. First
Sentier Investors is ultimately owned by Mitsubishi UFJ Financial Group, Inc (MUFG), a global financial group.
This material is directed at persons who are professional, sophisticated or ‘wholesale clients’ (as defined under the Corporations Act 2001 (Cth) (Corporations Act)) and has not been prepared for and is not intended for
persons who are ‘retail clients’ (as defined under the Corporations Act). This material contains general information only. It is not intended to provide you with financial product advice and does not take into account your
objectives, financial situation or needs. Before making an investment decision you should consider, with a financial advisor, whether this information is appropriate in light of your investment needs, objectives and financial
situation. Any opinions expressed in this material are the opinions of the Author only and are subject to change without notice. Such opinions are not a recommendation to hold, purchase or sell a particular financial product
and may not include all of the information needed to make an investment decision in relation to such a financial product.
To the extent permitted by law, no liability is accepted by MUFG, the Author nor their affiliates for any loss or damage as a result of any reliance on this material. This material contains, or is based upon, information that the
Author believes to be accurate and reliable, however neither the Author, MUFG, nor their respective affiliates offer any warranty that it contains no factual errors. No part of this material may be reproduced or transmitted in any
form or by any means without the prior written consent of the Author.
In Australia, ‘Colonial’, ‘CFS’ and ‘Colonial First State’ are trade marks of Colonial Holding Company Limited and ‘Colonial First State Investments’ is a trade mark of the Bank and all of these trade marks are used by First
Sentier Investors under licence.
Copyright © First Sentier Investors (Australia) Services Pty Limited 2019
All rights reserved.
5You can also read