Arbitrage in Natural Gas Markets? - Yuri Yegorov Seminar on Energy Economics - Cerna
←
→
Page content transcription
If your browser does not render page correctly, please read the page content below
Arbitrage in Natural Gas
       Markets?
             Yuri Yegorov
        University of Vienna
  Seminar on Energy Economics
     Paris, School of Mines
   April 13th, 2016, 16:30- 18:30

      Based on article with J.Dehnavi and
      F.Wirl in Intern. J. Energy & Statistics
Yegorov - Arbitrage LNG 2
Abstract
• Regional liquefied natural gas (LNG) markets are characterized by
  substantial price differences since 2009. These regional differentials in
  prices suggest arbitrage possibilities which are incompatible with market
  equilibrium theory; this creates a puzzle. This paper tries to explain this
  puzzle by investigating potential explanations ranging from transport
  costs, bottlenecks in network (liquefaction, shipping and regasification),
  and restrictions arising from contracts. Only the past and current
  constraints on US liquefaction capacity has some explanatory power. This
  cannot be the entire story because US gas producers can engage in
  intertemporal speculation, i.e., keep their gas in the ground. Further
  explanations are needed. They can be linked to potential US government
  interventions. High and irreversible investment costs and rational
  expectations (i.e., others will exploit this opportunity, too, which will
  move regional prices closer) further add to keeping investments low.
  Summarizing, these factors combined can explain the price differences of
  the past and their persistence, albeit at a lower level, in the future.

                              Yegorov - Arbitrage LNG                       3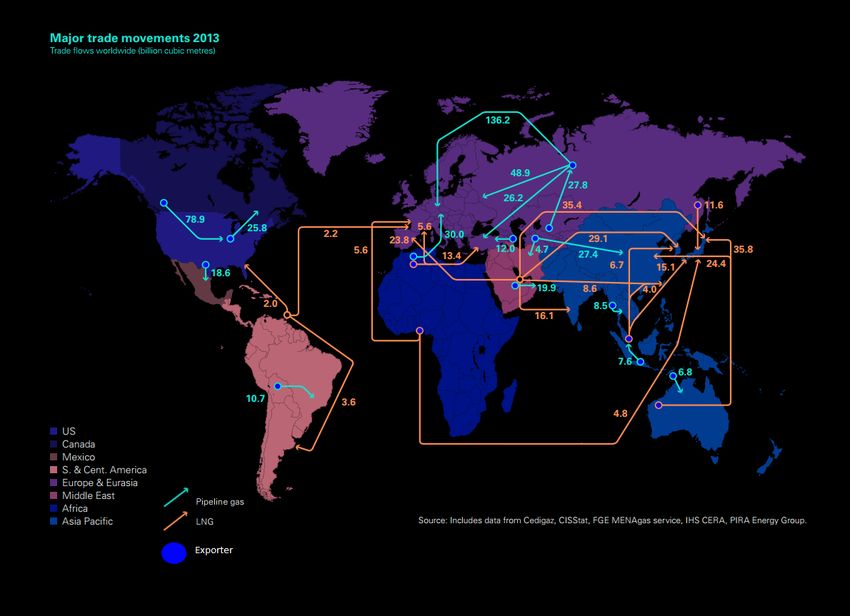
Content
• Natural gas markets are characterized by large spreads
  in liquefied natural gas (LNG) prices across locations, in
  particular the low prices in the United States (Henry
  hub) compared with Europe or Japan.
• Reasons can include
       Constraints: Transport, LNG facilities, contracts
       Investment costs & delays
       Legal
• The objective of this paper is to explain the differences
  between regional natural gas prices and thus the
  puzzle of how markets can allow for such, at least at
  first sight, large arbitrage.

                        Yegorov - Arbitrage LNG                4
Arbitrage Opportunity
• Economic theory says that arbitrage is defined as “the simultaneous
  purchase and sale of the same, or essentially similar, security in two different
  markets for advantageously different prices” (Sharpe and Alexander, 1990).
• Efficient markets are characterized as arbitrage-free, which is a cornerstone
  of neoclassical economics, general equilibrium theory (Arrow and Debreu,
  1954)
• Price difference across locations may persist if there are significant difference
  in production costs and if transport cost (c) across locations is high.
                 |p(A,t)- p(B,t)|< c
• In the case of natural gas, transport costs are much higher than for oil. So we
  can expect some regional price difference. But how high it should be?
• Next figure shows that after 2008 the divergence between regional prices
  has increased. We should analyse potential reasons for that.

                                Yegorov - Arbitrage LNG                        5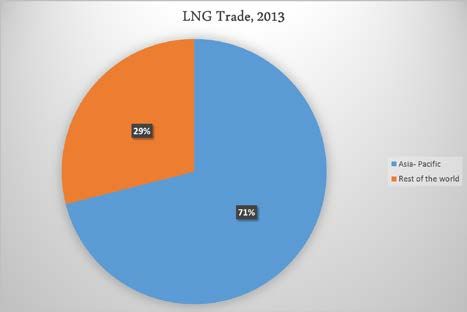
International prices for LNG $/Mmbtu

 LNG prices started to decouple in 2009. In 2012 they differ by factor 5.
 IEA World Energy Outlook predicts substantial price differences beyond 2030
                                    Yegorov - Arbitrage LNG                      6
             Source: BP Statistical Review of World Energy June 2013, page 27.
Explanations of Price Difference
• Freight costs
• Capacity constraints in:
shipping
liquefaction,
re-gasification capacities
• Constraints due to contracts and lack of
demand
• Investments – delays & expectations
• Politics
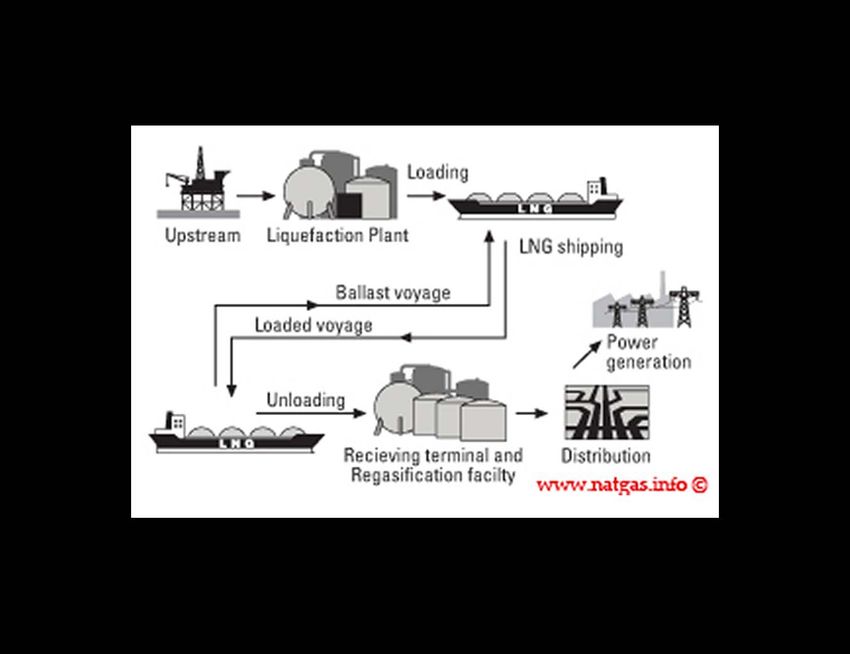
Yegorov - Arbitrage LNG 7LNG Supply Chain and its Costs
Yegorov - Arbitrage LNG 8A Simple LNG Arbitrage
Model
Cargo
LNG Exporter Spot Market (HP)
Diversion
Long Term Spot Market (LP)
Contract
Re-
Exporting
LNG Importer Arbitrageurs
Yegorov - Arbitrage LNG 9Barriers for Arbitrage
There is an arbitrage opportunity which lasts now
for quite some time.
Possible explanations:
1- Transportation Cost.
2- Capacity Constraints.
3- Long term Contracts.
4- Uncertainty and risk aversion of investors.
5- LNG trade is complex in nature, physically and economically.
6- Political uncertainty whether the US government will allow
these exports or not?
Yegorov - Arbitrage LNG 10Short Run Constraints
Along the LNG trade network (liquefaction,
LNG-vessel, re-gasification).
From contracts and related reputation effects
that ensure deliveries to US in spite of low
prices.
11
Yegorov - Arbitrage LNGFreight Costs:
we see that they can explain only up to $2 difference across prices.
Approximate Distance and Transportation Costs between 3 Largest LNG markets
LNG Transportation
Countries Exporting Terminal Importing Terminal Distance (miles)
Cost (US$/mbtu)
Himeji 9424 1.13- 1.88
US- Japan New Orleans
Sodegaura 9141 1.09- 1.82
Isle of Grain 4777 0.573- 0.954
US-UK New Orleans
Dragon 4468 0.53- 0.89
Isle of Grain Himeji 10917 1.308-2.185
Japan- UK Dragon Himeji 10742 1.284-2.148
Dragon Chita 10826 1.296-2.164
Yegorov - Arbitrage LNG 12Freight Costs
after 2008 transport cost cannot explain price difference
14
12
10
8
6
(PJ-PUS)-Cma x
4 PJ-PUS
(PJ-PUS)+Cma x
2
0
1996 1998 2000 2002 2004 2006 2008 2010 2012
-2
-4
-6
Yegorov - Arbitrage LNG 13Constraints?
LNG Importer Countries Status
Regasificati
LNG Exporter Countries Status
• We see that regasification capacity
is not a global bottleneck (capacity
LNG Liquefaction LNG
Country on Country
Import Capacities Export
Capacities
USA
Canada
157.9
10.6
12.23
2
USA
Trinidad &
1.9
20.5
1.64
20.38
847 bcm, import 297 bcm in 2011),
while liquefaction might be (USA).
Tobago
Mexico 19.1 5.77 Peru 6.1 1.82
Argentina 3.2 1.78 Belgium 0 0.57
Brazil
Chile
7.9
6
2.78
3.07
Norway
Russia
5.8
13
4.71
13.4
• The stock of LNG vessels capacity
Dominican
Republic
2.4 0.82 Algeria 27.5 19.31 exceeds the current LNG flow .
• Contracts do not bring constraints.
Puerto Rico 4 0.77 Egypt 16.6 9.71
Belgium 9.5 6.43 Eq. Guinea 5 5.16
France 25.1 13.94 Libya 0.8 0.34
Greece
Italy
5.3
11.9
1.17
9.08
Nigeria
Oman
29.5
14.6
23.9
11.49
Introduction of flexible contracts
Portugal
Spain
5.5
63.3
3.01
27.54
Qatar
UAE
94.1
7.6
75.75
7.9
allows exploiting short term price
Turkey
United Kingdom
12.9
53.9
7.92
18.67
Yemen
Australia
9.1
26.9
5.48
25.36
differences. Since about 37% of US
Kuwait
UAE
7.5
3.2
2.78
0.16
Brunei
Indonesia
9.8
36.8
8.83
31.36 LNG import contracts are f.o.b.,
China
India
13.4
16.8
12.8
12.15
Malaysia
Total
30.9
356.5
30.54
297.63 any US firm owning such a
contract, can re-route it.
Japan 264.2 93.48
South Korea 110 44.44 Source: BP Statistical Review of World Energy,
Taiwan 33.8 14.9 2011; Natural Gas Information, 2011
Total 847.4 297.63
Yegorov - Arbitrage LNG 14World LNG Trade Movement
torial
Austr
Alger
Libya
nesia
Russi
Mala
Equa
Belgi
Qata
Brun
Oma
Egyp
Guin
Peru
Nige
Indo
Yem
UAE
way
LNG
T&T
Imp
ysia
Nor
alia
um
TO
US
ria
en
ea
ei
ia
n
a
r
t
US -- 5.38 0.45 -- 0.76 -- -- 2.07 -- -- 1.18 -- 1.29 -- 1.10 -- -- -- -- 12.33
Canada -- 1.59 0.08 -- 0.08 -- -- -- -- -- -- -- 0.25 -- -- -- -- -- -- 2
Mexico -- -- 0.26 -- -- -- -- 0.16 -- -- 2.23 -- 1.02 -- 0.18 -- -- 1.87 -- 5.72
Argenti -- 1.63 -- -- -- -- -- -- -- -- -- -- 0.15 -- -- -- -- -- -- 1.78
na
Brazil 0.09 0.85 0.16 0.08 -- -- -- -- 0.08 -- 0.89 -- 0.59 0.04 -- -- -- -- -- 2.78
Chile -- 0.52 -- -- -- -- 0.17 0.55 1.50 -- -- -- 0.25 -- 0.08 -- -- -- -- 3.07
Domini
-- 0.82 -- -- -- -- -- -- -- -- -- -- -- -- -- -- -- -- -- 0.82
ca
Puerto
-- 0.77 -- -- -- -- -- -- -- -- -- -- -- -- -- -- -- -- -- 0.77
Rico
Belgiu 0.05 0.08 0.08 -- 0.09 -- -- 0.17 -- -- 0.16 -- 5.80 -- -- -- -- -- -- 6.43
m
France -- 0.35 -- -- 0.51 -- 6.27 0.73 -- -- 3.57 -- 2.43 -- 0.08 -- -- -- -- 13.94
Greece -- 0.08 -- -- -- -- 0.98 0.08 0.03 -- -- -- -- -- -- -- -- -- -- 1.17
Italy -- 0.32 -- -- 5.75 -- 27.56 0.72 0.09 -- -- -- 6.18 -- -- -- -- -- -- 9.08
Portug
-- 0.18 -- -- 0.05 -- -- -- -- -- 2.70 -- 0.08 -- -- -- -- -- -- 3.01
al
Spain 0.12 3.32 0.63 0.08 3.3 -- 12.05 2.62 -- 0.34 7.82 0.17 5.54 -- 0.18 -- -- -- -- 27.54
Turkey -- 0.26 -- 0.08 0.26 -- 3.87 0.27 -- -- 1.26 -- 1.92 -- -- -- -- -- -- 7.92
UK 0.18 1.63 -- -- 0.94 -- 1.25 0.12 -- -- 0.40 -- 13.89 -- 0.26 -- -- -- -- 18.67
Kuwait -- 0.33 -- 0.09 -- 0,09 -- 0.33 0.29 -- 0.08 0.91 -- 0.25 0.09 0.09 -- -- 0.24 2.78
UAE -- -- -- -- -- -- -- -- -- -- -- -- 0.16 -- -- -- -- -- -- 0.16
China -- 0.07 0.08 0.08 -- 0.51 -- 0.08 0.08 -- 0.17 -- 1.61 0.08 0.70 5.21 -- 2.45 1.68 12.80
India -- 0.66 -- -- -- -- -- 0.09 0.17 -- 0.33 -- 10.53 -- 0.37 -- -- -- -- 12.15
Japan 0.85 0.15 -- 0.08 -- 8.23 0.08 0.57 0.72 -- 0.84 3.80 10.15 6.86 0.16 17.66 7.78 17 18.55 93.48
S. 0.35 0.88 0.08 0.08 0.16 3.90 -- 0.98 1.85 -- 1.18 6.11 10.16 0.25 2.27 1.33 1.05 7.42 6.39 44.44
Korea
Taiwan -- 0.51 -- -- 0.07 0.67 -- 0.17 0.35 -- 1.09 0.50 3.75 0.42 -- 1.06 -- 2.62 3.68 14.90
LNG. 1.64 20.38 1.82 0.57 4.71 13.40 19.31 9.71 5.16 0.34 23.90 11.49 75.75 7.90 5.48 25.36 8.83 31.36 30.54 297.63
EXP
Yegorov - Arbitrage LNG 15Contract Restrictions
Many LNG contracts are long term (especially in Asia), but
the share of short term contracts has been rising and reached
18-20% in 2007-2008, Rogers (2010).
f.o.b (flexible) contracts versus d.e.s (not flexible) contracts.
About 37% of US LNG import contracts are f.o.b., so re-
exporting or rerouting is possible.
Negotiation between exporters and importers.
16
Yegorov - Arbitrage LNGRe-Export of Cargoes Contracts (2013)
Re-
exported
Export Country/ Exporter Import Country Number of Cargoes
Volumes
Argentina 13
(Mt)
Japan has the highest price
Belgium
Spain
South Korea
3
2 1.10 but 27 bcm are imported
Brazil
Potugal
1
1 using spot of short term
Spain
Belgium
2
1 contract. Speculators have
France
Brazil
Japan
1
1 0.35 access.
Portugal 1
Thailand 1
Turkey 1
Brazil 1
China 1
Netherlands 0.17
Italy 1
Turkey 1
Argentina 4
Portugal 0.24
Brazil 2
Brazil 13
Argentina 6
Mexico 5
Japan 4
Spain Israel 3 2.13
Italy 3
South Korea 2
Portugal 2
Taiwan 2
Europe 78 3.99
Brazil Argentina 1 0.06
Mexico 1
USA 0.1
Portugal 1
Americas 3 0.16
South Korea Japan 1 0.06
Asia 1 0.06
World 82 4.21
Yegorov - Arbitrage LNG 17Intertemporal Constraints
Investments in particular into US liquefaction capacities
(i) The high fixed cost of liquefaction plants in the USA.
(ii) For how long this arbitrage opportunity exists?
(iii) The national regulations (like an export tax) affect the
future profitability at the individual level.
Yegorov - Arbitrage LNG 18Regasification and Shipping Capacities
LNG Importer Countries Status
Country Regasification Capacities LNG Import
USA 170.8 2.7
Japan 247.5 119
World 1022 325.3
Source: The LNG Industry, GIIGNL, 2013. BP, 2014.
The world re-gasification capacity exceeds the volume of global LNG imports
by factor 3
19
A similar conclusion holds for LNG vessels
Yegorov - Arbitrage LNGConventional vs Nonconventional
Gas Reserves. Impact
1. Reduces competition for LNG suppliers from
the Middle East.
2. Reduces the future share of world gas supply
from Russia, Iran and Venezuela.
3. Reduces U.S. and Chinese dependence on
Middle East natural gas supplies.
Yegorov - Arbitrage LNG 20Intertemporal Speculation
Even if
• the transport costs,
• constraints
• and the investment hurdles
explained the large current differences in regional gas prices, the
puzzle remains.
Why do not gas producers enter as arbitrageurs and delay their
extraction in order to gain from higher future prices? Why do
they instead produce at levels that drive the current gas below
the coal price in the US? And this against the fact, that shale
extraction is much more flexible and even interruptible.
Yegorov - Arbitrage LNG 21Political & Economical uncertainty whether the US
government will allow these exports or not?
“… Shale gas production has come like a valentine for U.S.
manufacturers. Natural gas from shale has injected new life into the U.S.
chemical industry and has begun to bolster energy-intensive
manufacturing sectors such as aluminum, steel, paper, glass and food”.
http://www.huffingtonpost.com/sridhar-kota/frackings-unexpected-envi_b_5907334.html
"Gas exports in U.S. are still in a grey zone. Not forbidden, but not
encouraged”
Chen Wei Dong, Senior Economist with CNOOC Energy Economics Institute.
”As pressure builds on the Obama administration to speed up approvals to
sell U.S. natural gas overseas, the Energy Department on Monday
authorized exports from a proposed Oregon terminal”.
http://fuelfix.com/blog/2014/03/24/obama-administration-grants-approval-to-
sixth-natural-gas-export-project/
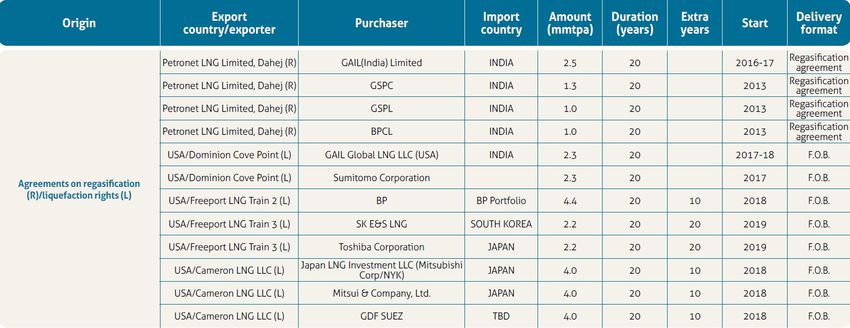
Yegorov - Arbitrage LNG 22Agreements on Liquefaction Rights
23
Yegorov - Arbitrage LNGConclusions
There is an arbitrage opportunity which lasts now for quite some time.
Possible explanation:
1- Transportation Cost;
2- Capacity Constraints; no constraints of capacities along the supply chain
are observable, except for the lack of US liquefaction capacities.
3- Long term Contracts; Contracts are becoming increasingly flexible
4- Uncertainty and risk aversion of investors -
is not a significant explanation as financial intermediaries and the large energy
companies should be ready to shoulder this risk.
5- LNG trade is complex in nature, physically and economically.
6- Political uncertainty whether the US government will allow these
exports or not?
Yegorov - Arbitrage LNG 24Final Remarks
• Standards reasoning - transport costs & various constraints
(capacities, contractual, etc.) - cannot explain the huge price
differences due to the possibility of intertemporal speculation
• Expectations and in particular (political?) uncertainty can
explain why some differences and thus apparent arbitrage can
persist.
• Indeed, the US gas market is regulated; export permission out
of NAFTA countries has to be obtained. There is also an
interest to keep domestic price of natural gas in the USA at
low level, since this creates more jobs. Thus, huge arbitrage
volumes that would bring US gas price to EU level might be
prevented by regulators and politicians. Thus, investment in
costly liquefaction plants is risky.
Yegorov - Arbitrage LNG 25Will the arbitrage opportunity remain?
Regional prices will gradually converge after 2020:
China shale gas reserves will gradually come in line.
Australia FLNG huge project is targeting East-Asian market.
Russia is constructing a pipeline to China.
Some gas rich countries (like Iran and Venezuela) are not yet substantial
suppliers. U.S. liquefaction plants preparations are underway to begin
exports in 2018.
It is uncertain how long US gas prices will remain low.
The arbitrage opportunity will probably remain at least until 2030
Yegorov - Arbitrage LNG 26For How Long will the Arbitrage
Opportunity Remain?
Source: World Energy Outlook, 2014
Yegorov - Arbitrage LNG 27Thank you for your attention!
Questions and suggestions are welcome.
My e-mail is:
yury.egorov@univie.ac.at
Yegorov - Arbitrage LNG 28You can also read