LSL New Build Index - LSL Land & New Homes
←
→
Page content transcription
If your browser does not render page correctly, please read the page content below
LSL New Build Index
The market indicator for New Builds                                                                        Feb 2020

In the year to end January 2020 new build prices per m² rose by an average of
2.19% across the UK...
The Market
The latest house price data from the Office for              Looking over the past two decades, house price
Na onal Sta s cs finds that average UK house prices        growth across the UK peaked at 10% around June
are up 2.2% over the year to December 2019, and up         2007 before falling to ‐15% around February 2009. In
from a figure of 1.7% in the year to November (see         the years since August 2016, year on year growth has
also tables 3‐6). England, Scotland and Wales saw a        been steadily declining, heading from the 5% mark
price rise of 2.2% over the year and Northern Ireland      down towards zero. However, over the past few
saw a rise of 2.5%.                                        months the trend line appears to have bo omed out
                                                           and turned upwards and the coming months will
In England, at a regional level, all regions experienced   confirm if this is a move towards a stronger market.
price rises, the first me that this has happened since
February 2018. The data runs off completed sales so         At a regional level it is Yorkshire and the Humber that
it will reflect a pickup in ac vity towards the back       has experienced the strongest house price growth
end of 2019 as opposed to a post‐elec on boost,            with an annual figure of 3.9%, followed by the East
although this effect may now be occurring too.              Midlands at 2.8%. The South West, East and London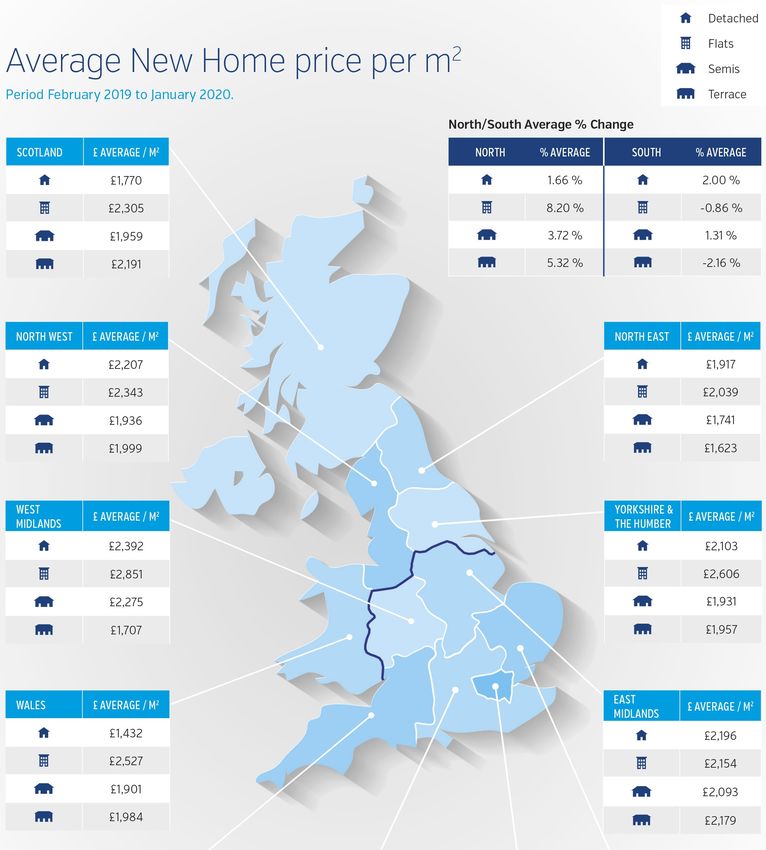
have experienced growth rates between 2% and
2.5%; the North West and North East experienced
growth rates between 1.5% and 2.0% and the South
East and West Midlands have seen growth between
1% and 1.5%.
HMRC produce residen al transac on sta s cs
through the ONS. Simple economics dictates that
supply and demand combine to set price levels and
changes in supply and demand determine whether or
not market prices are rising or falling. So it is worth
no ng whether the posi ve indica ons coming from
the price data are underpinned by transac on data.
Although subject to upda ng, the provisional
seasonally adjusted es mate of UK residen al              expects to see house price infla on gathering pace
property transac ons for January 2020 was 102,810         both in the near and longer terms.
which was 5.2% higher than the January 2019 figure
and 4.1% higher than the December 2019 figure.            The body represen ng the mortgage and other
When looking at month on month residen al                 personal finance sectors across the UK is called UK
transac on data there is a repea ng ‘heartbeat’           Finance and their Mortgage Trends update has just
pa ern as transac on volumes change through the           been released for December 2019. The figures
year (Table 1). The seasonally adjusted figures           support the idea that the market is stabilising and
smooth this out and on this basis transac on              perhaps beginning to rise, as suggested by the above
volumes have been rela vely steady for the last five      data sets. In December 2019 there were 29,490 new
or so years. It does however look as if there may now     First Time Buyer mortgages which was 0.3% more
be a sign of an up ck in ac vity and these indica ons     than the December 2018 figure. There were 29,400
are coming from this and various other sources.           Homemover (not FTB’s) mortgages which was 3.2%
                                                          more than the December 2018 figure.
The latest RICS UK Residen al Market Survey
supports the posi ve data coming from the ONS. It         Hometrack produce a Ci es Index which focuses on
finds that buyer enquiries, agreed sales and new          house price changes at city level. There is a long‐term
instruc on have all risen over the month. The             trend to move back into ci es and this is perhaps
surveyors who responded to the survey are upbeat          reflected in the 3.9% 20 City Index house price
about sales ac vity in the coming year and house          growth that was recorded for December 2019, the
prices are up at the Na onal level, driven by a           highest level in the past two years. Ci es in the North
turnaround in London and the South East. The RICS         and Midlands are registering stronger growth than
                                                          those in the South. No ngham is the best
                                                          performing English City with 5.2% growth whilst
                                                          Manchester, Liverpool and Leicester all have over 4%
                                                          growth. All ci es in the North and Midlands are
                                                          experiencing over 3% growth and most Southern
                                                          ci es are in the 1% to 2% growth band.
                                                          Analysis of sales volume and value data for new build
                                                          homes up to the end of July 2019 suggests that the
                                                          market has topped out at around 9000 transac ons
                                                          per month and may now be dipping slightly. It
                                                          reached a low point of around 5000 transac ons per
                                                          month in 2010 and therea er saw an increasing
                                                          trend for several years. In value terms the trend line
decade, the propor on of the 55 to 64 age group in
                                                        the owner‐occupied sector has fallen from 79% to
                                                        73%. 10% of 55 to 64 year olds now live in the private
                                                        rented sector (up from 7% a decade since) and 17%,
                                                        up from 14%, are now in the social rented sector. So
                                                        as older people move into the rented sector, perhaps
                                                        to free up equity in their homes, more younger
                                                        people are moving into owner occupa on. This is
                                                        good for the housing market as younger people tend
                                                        to move up the housing ladder, so crea ng more
                                                        buyers and sellers whilst older genera ons tend to
                                                        remain in their homes.

shows a peak of over £3 billion per month in sales      Current News
value around 2018, having fallen to a low point of £1
billion per month in 2010.                              The Government has recently issued a consulta on
                                                        document on its proposed ‘First Homes’ scheme
                                                        which is intended to deliver owner occupied housing
The Long View                                           to key workers and First Time Buyers. The
The English Housing Survey has recently published its   consulta on is running around what the scheme will
report on peoples housing circumstances and the         comprise of and how it will be delivered. It appears
condi on and energy efficiency of homes for the           that the scheme will be based on a permanent
period 2018 to 2019.                                    discount being applied to the ini al sale and
                                                        subsequent resales of the proper es that are
Owner occupa on rates, which peaked at 71% in           included. It is not clear what the benefit is over a
2003, have remained steady for the sixth year in a      shared ownership type scheme and an immediate
row at 64% or 15 million households. There had been     concern is how easy it will be to police the true value
a steady growth in owner occupa on from the 1980’s      of the proper es when they are subsequently sold at
to 2003 a er which it declined and then steadied        an enforced discount price. Time will tell how this
around the present figure.                              evolves but it appears as if the house building sector
                                                        will be required to deliver the scheme.
Similarly, the propor on of households in the private
rented sector has remained unchanged for six years      Under a shakeup of the immigra on system to be
whilst the propor on in the social rented sector has    introduced from January 2021, a new points‐based
remained unchanged for a decade. 4.6 million or 19%     system will be introduced to limit business reliance
of households are in the private rented sector whilst   on low paid labour from the EU. The care homes,
4 million or 17% are in the social rented sector.       farming and construc on sectors are amongst those
                                                        likely to be hardest hit by these changes. Those
But when the above figures are examined in more
detail, they reveal that there is a shi in favour of
owner occupa on within the younger end of the
popula on and away from it amongst the older end.
In the decade between 2003‐4 and 2013‐14 the
propor on of owner occupiers in the 25 to 34 age
group fell from 59% to 36%. Since then the
propor on has steadily increased up to this year’s
figure of 41%. A corresponding move out of the
Private Rented sector by this age group has
happened over the same period. But as the 25 to 34
age group move into the owner‐occupied sector the
55 to 64 age group move out of it. Over the past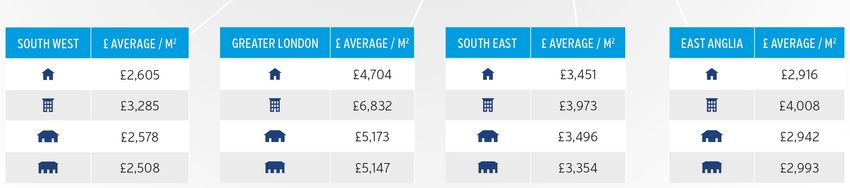
earning between £20,480 and the £25,000 threshold may be able to come in if they are skilled in an area with a
labour shortage. But fear not, the Home Secretary says that there are 8 million economically inac ve people aged
between 16 and 64 who can be trained to do these jobs.

Table 7: The First Time Buyers Affordability Index above looks at the average selling price of a 70 sq m property, which would
typically be 2 beds in each region. The figures are derived from the selling prices of new build terraced houses and flats across
the regions. These average selling prices for a typical 70 sq m property are then compared with the average earnings in each
region to create the average price to earnings ra o.


The business employs circa 450 chartered
Notes                                                                    surveyors and covers the en re UK.
This Index has been prepared by e.surv using                             LSL Land & New Homes is a trading name of LSL
anonymised data based on a propor on of all                              Land & New Homes Ltd, which is a member of
new build valua ons provided for lending                                 the LSL Property Services Group Estate Agency
purposes. Figures represent 12 month rolling                             Division, one of the leading residen al property
averages for each period. The copyright and all                          services groups in the UK. It’s strategy is to
other intellectual property rights in the Index                          create partnerships with developers and builders
belong to e.surv. Reproduc on in whole or part                           to support their objec ves and add value to their
is not permi ed unless an acknowledgement to                             businesses.
e.surv as the source is included. No modifica on
is permi ed without e.surv’s prior wri en       It can provide integrated solu ons for their
consent.                                        benefit drawing on the exper se of companies
                                                who are also under the LSL Group umbrella
Whilst care is taken in the compila on of the   including valua on services (e.surv), rental
Index no representa on or assurances are made por olio services, asset management services
as to its accuracy or completeness. e.surv      and estate agency services fronted by well‐
reserves the right to vary the methodology and known high street estate agency brands like Your
to edit or discon nue the Index in whole or in  Move and Reeds Rains. Services can be tailored
part at any me.                                 to suite individual needs from bespoke site sales
e.surv (www.esurv.co.uk) is the Valua on        and marke ng, agency referral to the disposal of
business of LSL Property Services plc           part exchange, assisted schemes and new build
(www.lslps.co.uk) and is the UK’s largest       stock, land sales and acquisi ons.
residen al valua on prac ce, ac ng for lenders,
developers, Social Housing organisa ons and
other stakeholders in the residen al property
market.

For further informa on or enquiries regarding the underlying data of the
LSL New Build Index, please contact Shaun Peart via email
Shaun.Peart@lslnewhomes.co.uk or by phoning 07789 948411.
For further informa on about the LSL Property Services Group including
LSL Land & New Homes and e.surv, visit www.lslps.co.uk

Disclaimer: The data is provided by LSL Land & New Homes and is based on data provided as described above. While reasonable skill and
care has been taken in the prepara on of the data – the copyright and all other intellectual property rights of which belong to e.surv
limited ‐ neither e.surv Limited nor LSL Land & New Homes can accept liability for the accuracy or completeness of the data provided.

Reproduc on in whole or part is not permi ed unless an acknowledgment to e.surv Limited is included. No modifica on is permi ed
without e.surv Limited’s prior wri en consent.

No warranty of the figures is given and no responsibility or liability of any nature to you or any third party for the whole or any part of its
content is accepted. It is assumed that you will carry out your own due diligence before proceeding with any proposals or making any
You can also read