Deutsche Bank Global Consumer Conference 2021 - Alan Jope & Sanjiv Mehta 7th June 2021
←
→
Page content transcription
If your browser does not render page correctly, please read the page content below

Deutsche Bank Global
Consumer Conference 2021
Alan Jope & Sanjiv Mehta

7th June 2021
Safe Harbour Statement

This presentation may contain forward-looking statements, including ‘forward-looking statements’ within the meaning of the United States Private Securities
Litigation Reform Act of 1995. Words such as ‘will’, ‘aim’, ‘expects’, ‘anticipates’, ‘intends’, ‘looks’, ‘believes’, ‘vision’, or the negative of these terms and other similar
expressions of future performance or results, and their negatives, are intended to identify such forward-looking statements. These forward-looking statements are
based upon current expectations and assumptions regarding anticipated developments and other factors affecting the Unilever Group (the ‘Group’). They are not
historical facts, nor are they guarantees of future performance.

Because these forward-looking statements involve risks and uncertainties, there are important factors that could cause actual results to differ materially from those
expressed or implied by these forward-looking statements. Among other risks and uncertainties, the material or principal factors which could cause actual results to
differ materially are: Unilever’s global brands not meeting consumer preferences; Unilever’s ability to innovate and remain competitive; Unilever’s investment choices
in its portfolio management; the effect of climate change on Unilever’s business; Unilever’s ability to find sustainable solutions to its plastic packaging; significant
changes or deterioration in customer relationships; the recruitment and retention of talented employees; disruptions in our supply chain and distribution; increases or
volatility in the cost of raw materials and commodities; the production of safe and high quality products; secure and reliable IT infrastructure; execution of
acquisitions, divestitures and business transformation projects; economic, social and political risks and natural disasters; financial risks; failure to meet high and
ethical standards; and managing regulatory, tax and legal matters. A number of these risks have increased as a result of the current Covid-19 pandemic.

These forward-looking statements speak only as of the date of this document. Except as required by any applicable law or regulation, the Group expressly disclaims
any obligation or undertaking to release publicly any updates or revisions to any forward-looking statements contained herein to reflect any change in the Group’s
expectations with regard thereto or any change in events, conditions or circumstances on which any such statement is based.

Further details of potential risks and uncertainties affecting the Group are described in the Group’s filings with the London Stock Exchange, Euronext Amsterdam and
the US Securities and Exchange Commission, including in the Unilever Annual Report and Accounts 2020.

                                                                                                                                                                                   2
Agenda

   1     Unilever Overview

   2     Portfolio: Prestige Beauty and Functional Nutrition

   3     Markets: Digitalisation in India

   4     Summary

                                                               3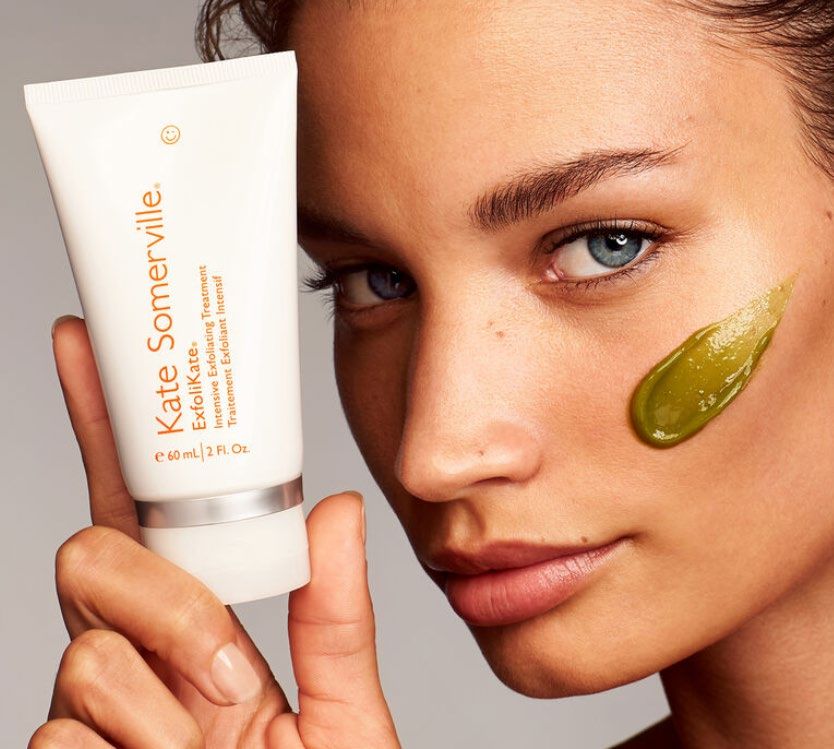
Key facts                                                                              Unilever Overview

                                                                    Top 5 markets:
     €51bn                                  18.5%
                                                                                                  Home
                                                                              USA                 C are
                                                                             India                 21%
            turnover                     underlying operating                Brazil                           Beauty &
                                               margin                        China                          Personal Care
                                                                           Indonesia                            42%
                                                                                                Foods &
                                                                                              Refreshment
                                                                                                  37%

            190                            €7.7bn
            countries                       free cash flow
                                                                                          14 of the top 50 global
                                                                                            consumer brands

                                                                Most effective
                        60%                                      marketer
                sales in emerging                               for 4 consecutive years
                     markets

Note: all figures as of full year 2020
                                                                                                                            4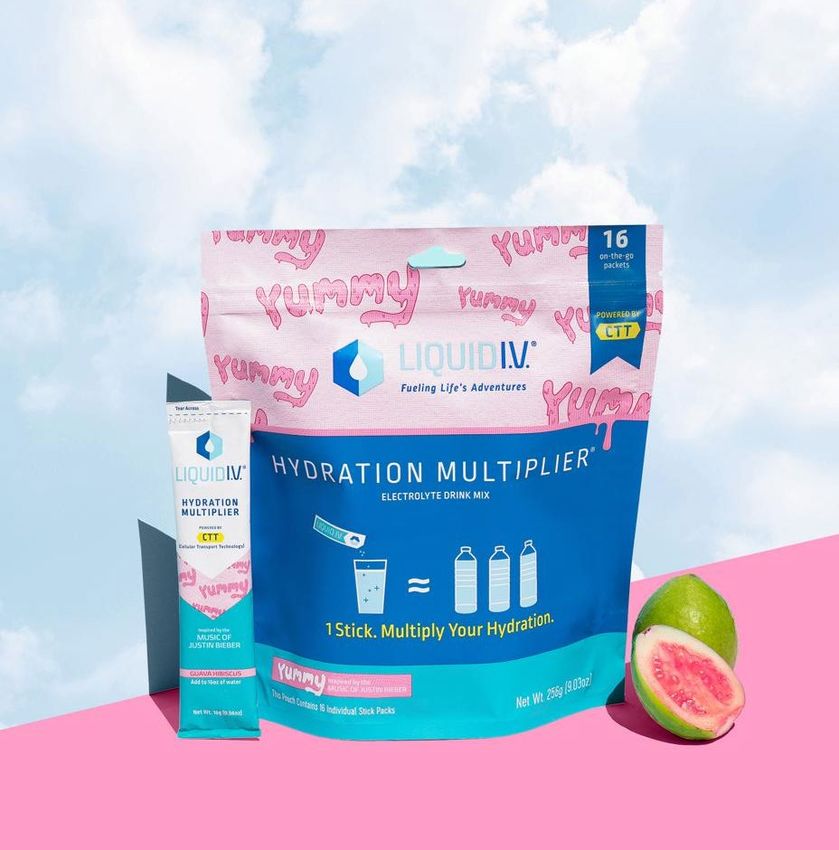
Unilever’s differentiating strengths                                                          Unilever Overview

Powerful portfolio of            Strong presence in                       The global leader in
leading category and             growth markets of                        sustainable business
brand positions                  the future

                                 Leading
  81%             50%            positions                12                 Top                Leader
brands #1 or     of turnover                                               of GlobeScan          in Dow Jones
 #2 in their   from 13 billion   in top 10 future   markets with >€1bn                           Sustainability
                                                                           Sustainability
                Euro brands      growth markets       annual sales                             Index since 2014
  market                                                                 Leaders survey for
                                                                              10 years

                                                                                                                  5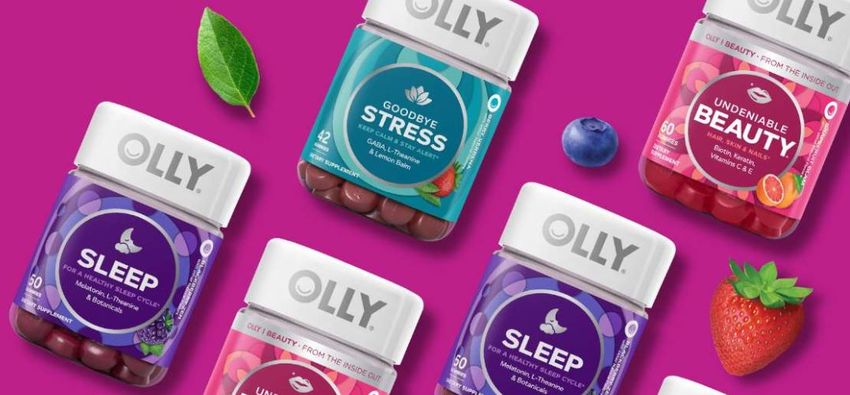
Strong start to the year                                            Unilever Overview

   Operational
                           Competitiveness              Q1 Growth
    excellence

       Penetration
                                                      Underlying Sales Growth

                                 57%                        5.7%
       Innovation

    Design for channel      % Business Winning MAT

     Brand purpose
                                                            4.7%
                                                     Underlying Volume Growth

     Fuel for growth

                                                                                   6
Five strategic choices                                               Unilever Overview

1. Develop our portfolio into high growth spaces

2. Win with our brands as a force for good, powered by purpose & innovation

3. Accelerate in USA, India, China and leverage EM strength

4. Lead in the channels of the future

5. Build a purpose-led, future-fit organisation and growth culture

                             Operational Excellence
                                                                                    7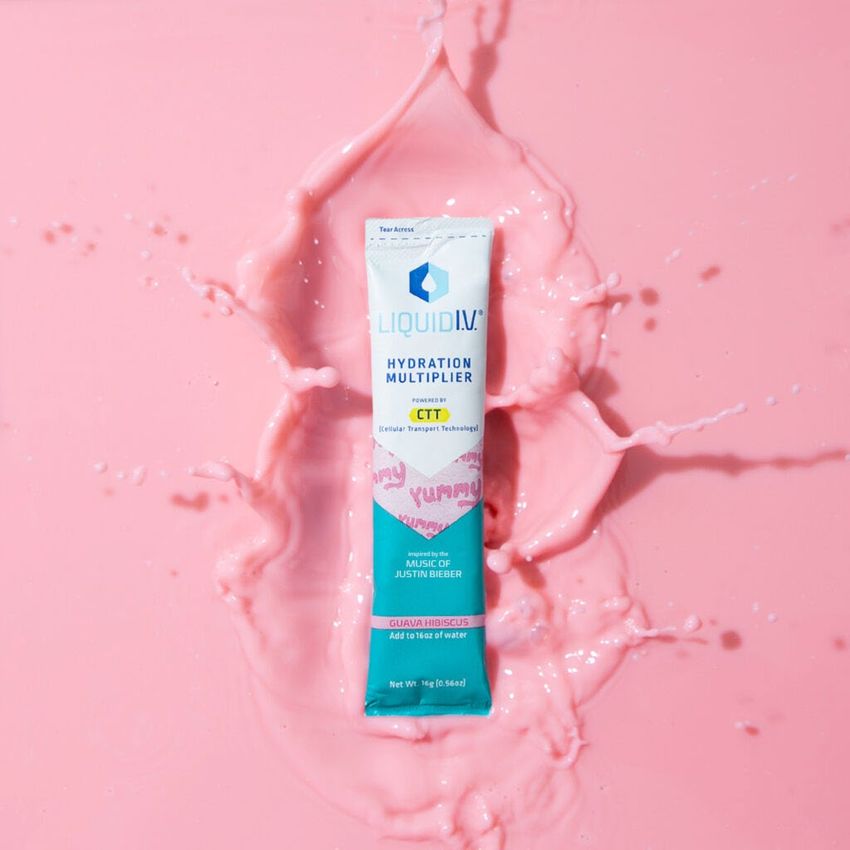
Strategic choices                                                        Portfolio

1. Develop our portfolio into high growth spaces

2. Win with our brands as a force for good, powered by purpose & innovation

3. Accelerate in USA, India, China and leverage EM strength

4. Lead in the channels of the future

5. Build a purpose-led, future-fit organisation and growth culture

                             Operational Excellence
                                                                                     8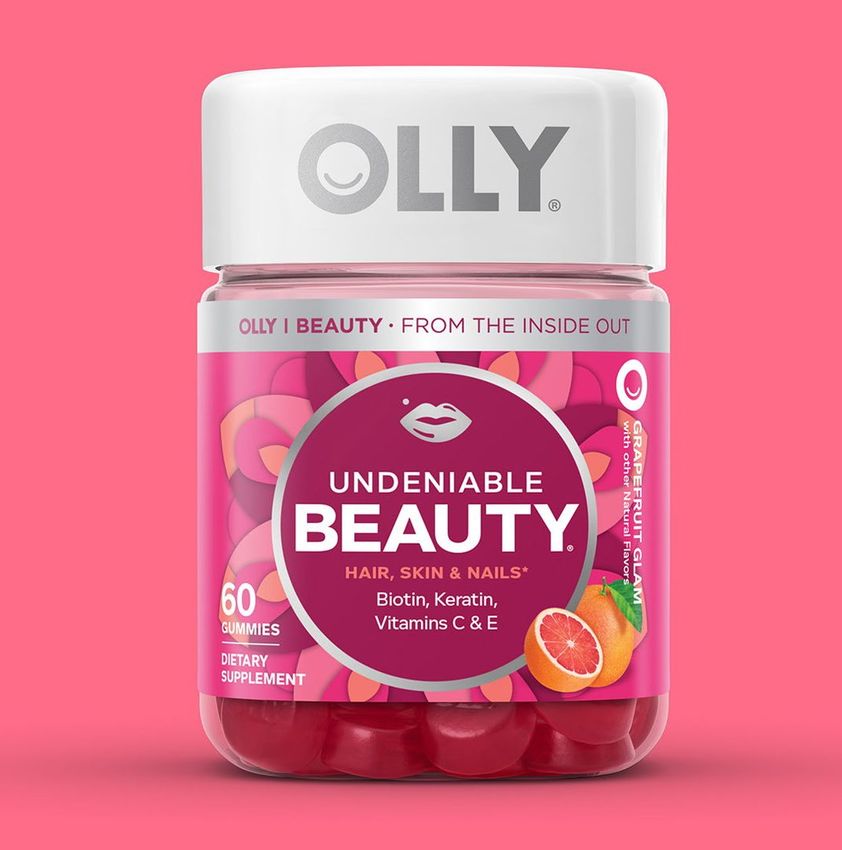
4
    %
               Laundry

           Home & Hygiene

    5
    %
                                                                     Priority focus area

            Skin Cleansing

             Deodorants

               Oral Care

    17%
               Hair Care

               Skin Care
                                 €16bn M&A capital deployed ‘15-20

            Prestige Beauty
    72%
                                                                                           Portfolio evolution into higher growth spaces

          Functional nutrition

          Plant-based foods

            Scratch cooking
    3
    %

              Ice Cream
                                                                                               Portfolio

9
Focus on high growth spaces                                                 Portfolio

           Prestige Beauty                          Functional Nutrition

  $156bn market, growing ~7%                  VMS: $140bn market, growing >7%

   Scale          High growth      Potential in      Route to        Branding &
                                growth countries    leadership   technology sensitive

                                                                                        10
Prestige Beauty: Future fit operating model Portfolio
Geography footprint
€0.7bn
€3bn
+21%
Asia
14%
ambition North
E urope
America
22%
Q1 USG 63%
Category footprint
>50%
O ther
Hair 8%
12%
% eCommerce Skin Care
80%
2015 2016 2017 2018 2019 2020
118 purpose led prestige beauty brands Portfolio
Dermalogica Kate Somerville Murad REN
Living Proof Hourglass Garancia Tatcha
12Prestige Beauty: Framework for growth Portfolio
String of pearls model Growth channels
Purpose led Digital first Impactful innovation
13Functional Nutrition: Building scale Portfolio
€1.1bn
€3bn
ambition +54% #1
Q1 USG selling multivitamin
on Amazon
>80% #1
sales via eCommerce VMS brands in Target
2018 2019 2020 2020
annualised
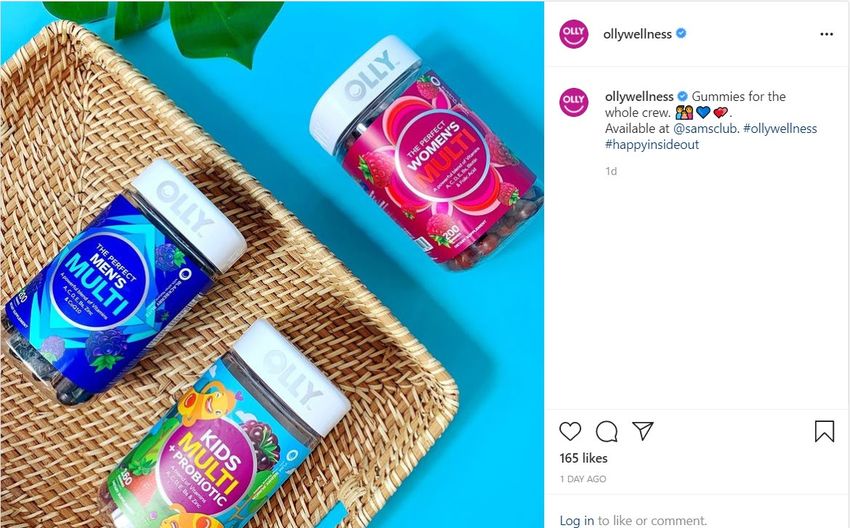
146 acquired Functional Nutrition brands since 2018 Portfolio
Equilibra Olly Horlicks
Liquid I.V. SmartyPants Onnit
15Functional Nutrition: Framework for growth Portfolio
Differentiated model Priority markets
Health & Wellbeing C hannel shift Digital and DTC
16Strategic choices India
1. Develop our portfolio into high growth spaces
2. Win with our brands as a force for good, powered by purpose & innovation
3. Accelerate in USA, India, China and leverage EM strength
4. Lead in the channels of the future
5. Build a purpose-led, future-fit organisation and growth culture
Operational Excellence
17HUL: India’s largest FMCG Company India
€5 bn 25%
9 out of 10
Turnover Operating margin
Households use one or more
5th Largest
+ €3 bn +1000bps
of our brands Indian company by
market capitalisation of
In last decade In last decade
€ 66 bn
c. 90% Brands in
Of our business has category
8m+ Largest
M&A
leadership Stores
in FMCG in India
1 Employer Plastic
of choice +2200bps 136k >1.3 tn litres
Gender balance
Shakti women neutral
Across industries micro
in last decade
enterpreneurs
By 2021 Water conservation
potential createdIndia a land of opportunities India
India is reforming FMCG has huge headroom to grow
Health Food Drinks 24%
Instant Coffee
India X
Face Wash
Ease of doing Body Lotion
business rank Washing Liquids Indonesia 2X
improved Dishwash Liquid
Soup
China 3X
+79 Hair Conditioner
Body Wash 2%
Low category FMCG per capita
penetration consumption
Demographics dividend Income pyramid moving towards a diamond
2016 2025
1.05 bn working class population
North
America
1/3rd are millennials
80% nuclear households by 2030
19Beauty & Personal Care €2.1 bn India
Hair care Straddling price - benefit Portfolio transformation
pyramid
Hair
CAGR 11%
Rs. 432
High end
Relative (€5)
naturals
Market Share
3X Salon care
FY’10-11 FY20-21
Anti-dandruff
Daily damage
care
Mass beauty
Sachet at
Rs.1 Family
(€0.012)
20Home Care €1.7 bn India
Upgrading with new Impactful
Fabric Wash
benefits Innovations
CAGR 11% Profitability
8X
Relative
Market Share
More benefits
FY’10-11 FY20-21 2X
Rising income
21Foods & Refreshment €1.6 bn India
Tea Winning in many Indias’ Market Development
CAGR 12%
Secured market Recognising
leadership in Tea Heterogeneity
FY’10-11 FY20-21
Punjab & Karnataka
Same brand designed for
different preferences
22India’s Digital Evolution India
Average monthly data
Internet penetration Cost of 1 GB data
consumption per user
2015 2021 2015 2021 2015 2021
302 m 761m US$ 4 US$ 10c 0.8 GB 13 GB
23Reimagining HUL: Journey to an Intelligent Enterprise India
Yesterday Tomorrow
Consumer
Ecosystem
Data, Tech
Source Manufacture Dis tribute Sale s
&
Analytics
Operations Customer
Ecosystem Ecosystem
Transforming from linear value chain to non linear and interconnected ecosystems
24Consumer Ecosystem India
Generating Better Agile Innovation Hub
Insights
Interconnected Engagement Engagement & Faster & Better
Systems Feedback Innovation
Navigate the C rafting Effective
shopper to Attributing media to growth
C ommunication
purchase
Deploying
C ommunication
Effectively
Consumer signal to launch in half the time
25Customer Ecosystem India
Demand Generation Demand Capture Demand Fulfilment
eComm, USHOP
Shikhar
Capability (DTC) &
(eB2B ordering)
Digi Payment Data & Analytics Last mile Delivery
MyKirana (B2C)
App based call & Route optimisation,
Ambition to double
Impact contribution
personalised Retailer credit assortment Next day delivery
recommendation recommendation
> 500k Kiranas (traditional grocers) connected; 2 Year plan folded in 6 months
26Operations Ecosystem India
Plan & Source Make Deliver & Service
Artificial Intelligence led commodity and Manufacturing & distribution network Automated storage & picking
demand forecasting transformation
Machine Learning powered intelligent Digitally enabled agile manufacturing Integrated routing & delivery
planning for distributors
Moving towards a Hi-Tech and Intelligent Supply Chain
27Powered by Data, Tech & Analytics India
Consumer Data
Lake
External
Ecosystem
Data
Operations Data Customer Data
Forecasting Lake Lake Basket Data
Data
Fulfilment Store Point of Sale
Operations
Data Sell in Data
Data
Augmenting decision making
28Summary Summary
Good start to the year through continued focus on operational excellence
Clear strategic choices
Portfolio evolution underway and new businesses building well
Driving competitive advantage through digitalisationOur vision Summary
Our vision
is to be the global leader in
sustainable business. We will
demonstrate how our purpose-led,
future-fit business model
drives superior performance,
consistently delivering financial
results in the top third of our industry.Deutsche Bank Global Consumer Conference 2021 Alan Jope & Sanjiv Mehta 7th June 2021
You can also read


