BluIce-EPICS Tabs Overview
←
→
Page content transcription
If your browser does not render page correctly, please read the page content below
BluIce-EPICS Tabs Overview
Sample & Rastering: Mark Hilgart
Collect: Oleg Makarov
Screening & WebIce: Sudhir Pothineni
Scan: Sergey Stepanov
GM/CA CAT at the Advanced Photon Source,
Biosciences Division of
Argonne National Laboratory, USA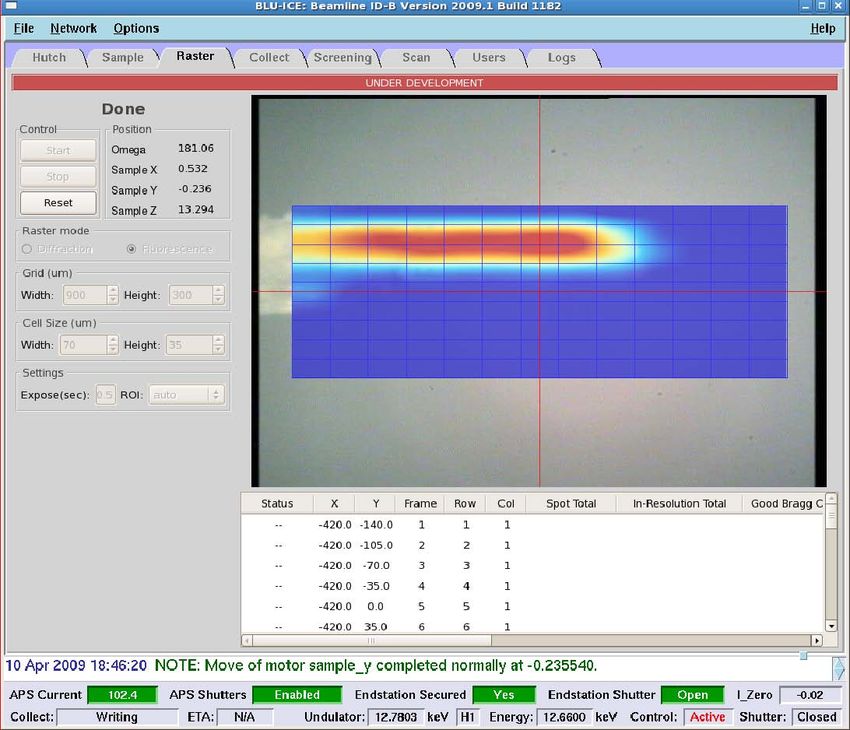
Sample Tab
What is it?
– All controls related to
visualization in one place
– Pop-out window gives constant
access to sample visualization
Uses
– Sample centering
– Manual beam alignment
– Rotation axis alignment
Controls:
– Pop-out button
– Lighting
– Move, zoom, snapshots
– Beam size display
– Related motors
Sample Tab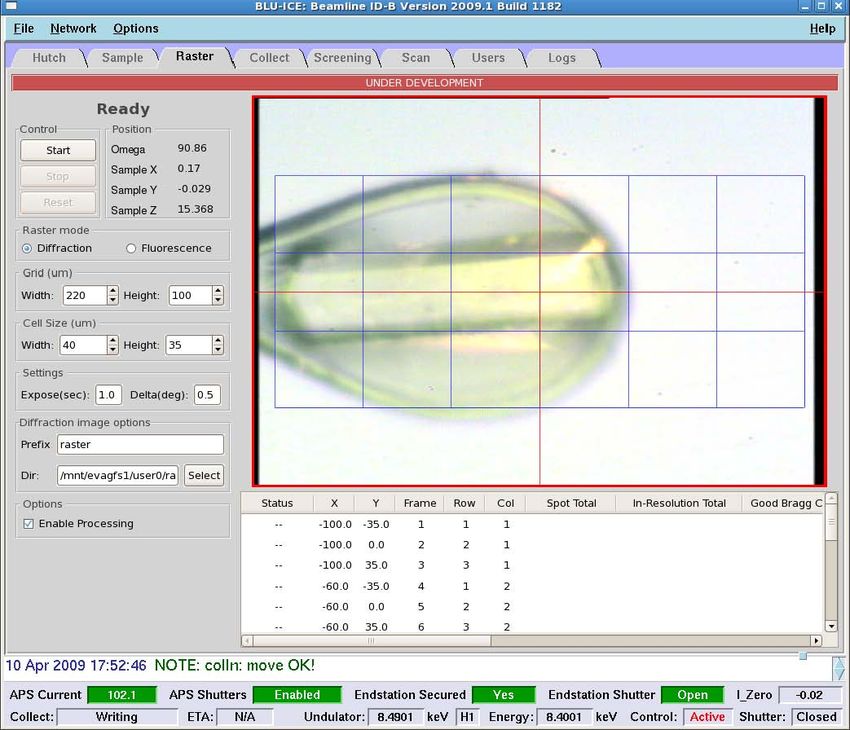
Sample Tab: Pop-out feature
BluIce-EPICS with the sample tab popped out
Button in the upper right of the sample tab pops up a second copy
Uses large desktops or dual monitors more effectively
Provides constant access to sample view and controls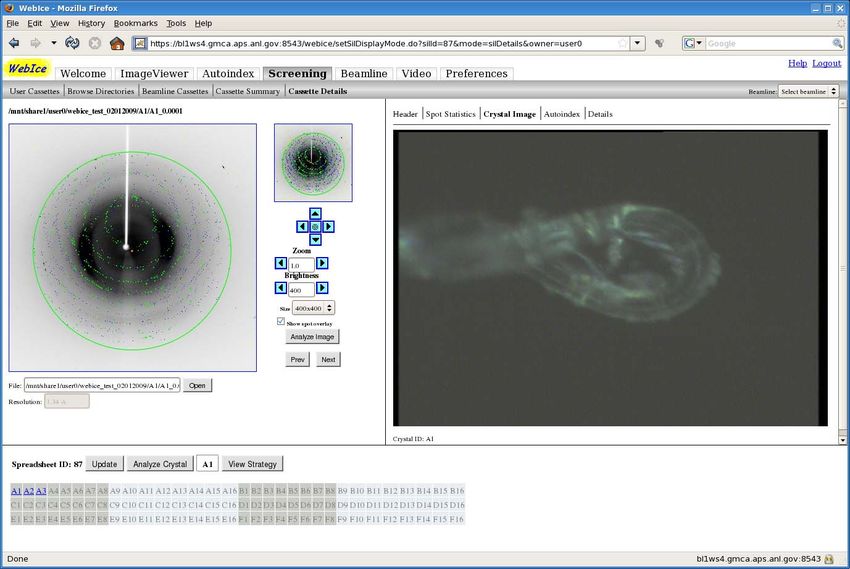
Sample Tab: Lighting
Fiber-optic lights
– Low and high res
– Along the camera axes
Ring Light
– High intensity LEDs
Backlight
– In while using the sample tab
– Out for collection, since it blocks the beam
– Move out is automatic before collection,
scans
Effective ranges
– Only a portion of the slider is used
– Hosts will show you how best to set each
light
Lighting controls on the left side
of the sample tab
Sample Tab: Move, Zoom, Snapshots
Sample tab video which allows point and click
Zoom and movement controls on
the left side of the sample tab
3-click selector
Continuous Zoom Translate
– Separate for low, high res – Point and click
– Enter a value, click start – Arrow buttons
Border – Distance field
– Red border indicates ready Snapshot
Rotate – Saves low-res and high-res camera views
– 180, 90, n buttons to a subdirectory in your home directory
– +-n field 3-click
– Click to start, then click to center 3x
– Sample will rotate between clicks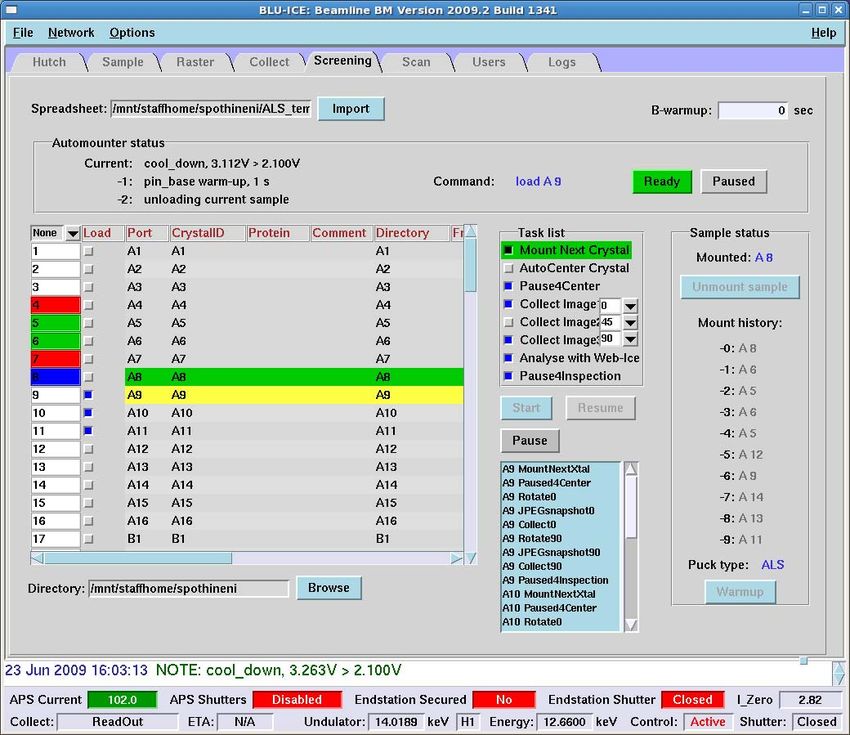
Sample Tab: Beam Size Display
Changes with zoom and
camera
Settings
– Off
– Guard slits
• Defined on hutch
tab
– Collimators
• 5um/20um
• 10um
• Full beam
– User Specified
• Can be used as a
measuring tool
Beam size display with controls on the sample tab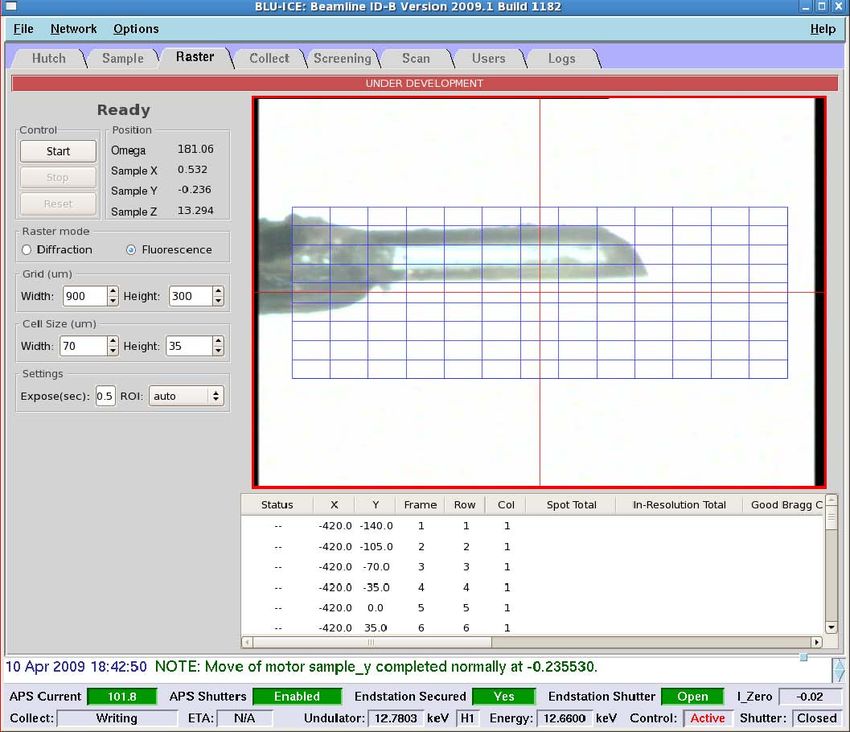
Sample Tab: Related Motors
Collimator
– 5um, 10um, 20um, 300um (scatterguard)
– Out when using sample tab, in for collection
– Move in is automatic before collection, scans
Piezo Mirror Triple collimator
– Adjusts the beam position
– Click ‘M’ to use the sliders
– Not normally needed
Beamstop
– Either this or the pin diode must be in to protect the detector
– Enforced in BluIce
Pin Diode
– Indicates beam strength at the sample
– Not normally needed
Motor controls at the bottom of the sample tab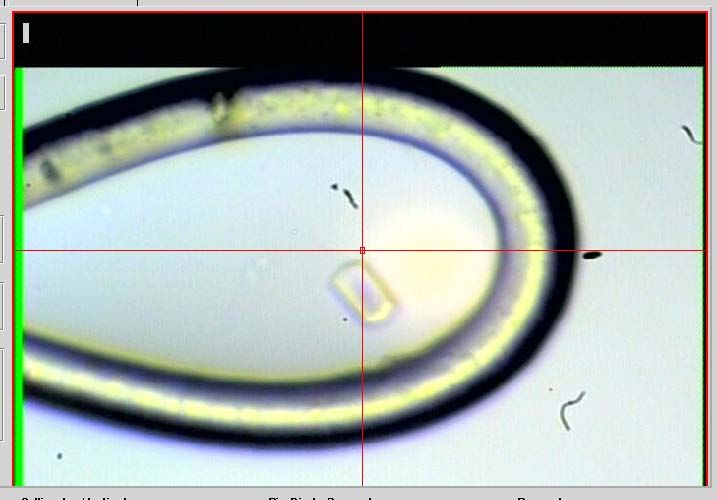
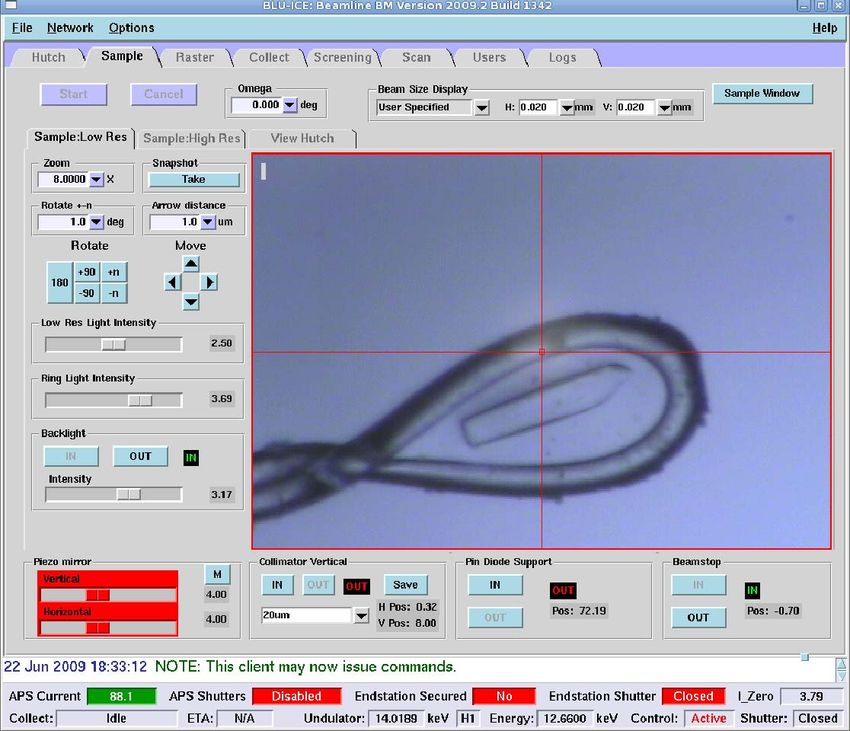
Raster Tab
What is it?
– A tool for finding crystals
Uses
– Find small, invisible crystals
– Find the best diffracting areas of
large crystals
Diffraction vs Fluorescence
– Complement each other
– Diffraction measures directly
what you want
– Fluorescence is ~4x faster
• 400-cell diffraction raster
½ second exposure
= 27 minutes
• 400-cell fluorescence raster
½ second exposure
= 6.5 minutes
Controls
– Grid parameters
– Collect parameters
Raster tab
– Results table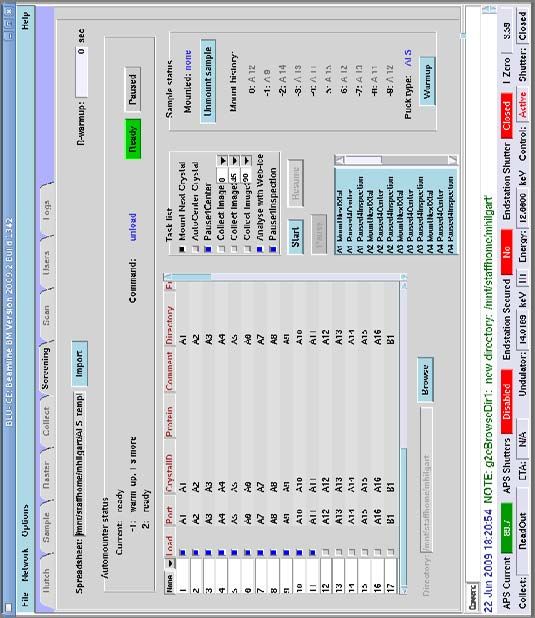
Raster Tab: Diffraction
Steps
– Grid setup
– Collection parameters
– Raster
– Results
Raster tab in diffraction mode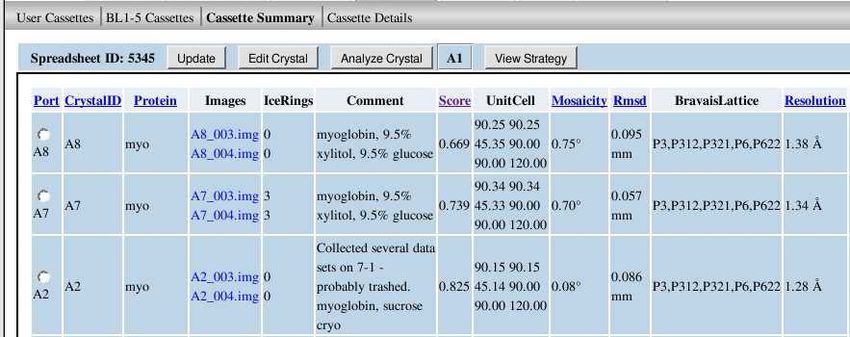
Diffraction Rastering: Grid Setup
Grid setup from the left side of the raster tab
Grid, cells are rectangular
Typing immediately updates grid Grid display on the raster tab video
display
Grid size is a minimum, will be rounded
up
– 35um cell height
– 100um grid height
– = 3 rowsDiffraction Rastering: Collection Parameters
Same as collect tab
– Exposure time
– Delta
Must be set beforehand on the hutch
tab
– Detector distance
– Energy
– Attenuation
Output prefix and directory
– “raster” prefix gives filenames like
raster_0.0001
Enable processing
– Does not affect speed
Diffraction collect parameters from
the left side of the raster tabDiffraction Rastering: Results
Results table from diffraction rastering
Click column headers to sort
Double-click row to center
Browse images on MAR computer (covered later)
– Image name: raster_0.0018
– Frame column: 18Raster Tab: Fluorescence
Steps
– Grid setup
– Exposure, ROI
– Raster
– Results
Raster tab in fluorescence modeFluorescence Rastering: ROI
Element-edge selector
ROI selector in raster tab Optimize MCA button in scan tab
in scan tab
Range determines which fluorescence is measured
Any fluorescence
– Range is set from 50eV to 100eV less than the beam energy
Scan tab element-edge
– A preset range is set based on the edge selected
Multi-channel analyzer (MCA) optimized on scan tab
– In interactive mode, the range can be manually setFluorescence Rastering: Results
Results are output as a
color map
Single-click on the map to
center
Collect on the collect tab
Results colormap from fluorescence rasteringRastering: Video Guide
Video tutorial on remote access & rastering:
http://www.gmca.anl.gov/remote/demoBluIce-EPICS: Collect tab
Collect tab: outline
BluIce Collect Tab
Frame processing engine
Hardware involved in data collection
Frame Audit Allows to acquire a dataset
Collect tab: functionality of X-ray diffraction images
from the sample
Dataset parameters:
– Prefix – common filename part
– Directory – where to store files
– Distance – detector to sample
distance
– Axis – gonio_phi or gonio_omega
– Delta – crystal oscillation angle
– Time – exposure time per image
– Start – the first frame # / angle
– End – the last frame # / angle
– Inverse Beam: Rotates the crystal by
180 deg to collect the friedel pairs
for the input phi range. If wedges are
used, the inverse beam is collected
before changing the energy.
– Wedge - The phi rotation range that
is collected successively at each
energy
– Energy - As you enter an additional
energy, an empty box appears for
further energy entries.Collect tab: Frame Server BLU-ICE Frame Server is running on the MAR computer Frame Server receives requests from BLU-ICE with parameters for data acquisition Each request initiates acquisition of one diffraction image Coordinates crystal rotation, the fast shutter opening / closing, and operation of a CCD detector. Log file: – Epics-CCD-.log
Collect tab: Hardware involved in data collection MAR CCD area detector with computer EVA3000 storage Goniometer with Aerotech ABR1000 rotary table Fast Shutter PMAC motion controller
Collect tab: Frame Audit
Log files:
– frameAudit__.log
– frameAudit__.log_camon
Data files:
– .dmp
– .dmp.png
7x10⁵
6x10⁵
5x10⁵
I0, counts/s
frame # 831
4x10⁵
3x10⁵
2x10⁵
1x10⁵
0
0.0 0.2 0.4 0.6 0.8 1.0 1.2 1.4
Time, s
Time, sBluIce-EPICS: Automated Screening
ALS Style Automounter BluIce-Epics Screening Tab
¾ Users can bring their samples in pucks and load into the sample changer dewar.
¾ Users can also bring the spreadsheet containing the samples information, which will be loaded to BluIce-Epics Screening
Tab.
¾ User can select which samples to screen, and tasks to perform on them. Available tasks include auto-centering, taking
diffraction test images and analyzing with WebIce.
¾ BluIce-Epics screening tab talks to Robot server for mounting and dismounting samples.
¾ The Spreadsheet contain the filenames prefix and the directory information for saving diffraction images.
¾ If selected the collected images automatically be posted for Webice that provides crystal scoring and data collection strategy.
¾ For automated centering we have implemented interfaces to the XREC and C3D software packages developed at EMBL.
¾ We are developing new features for automated screening which are much more user friendly.Screening: Automounter Requirements
¾The automounter requires a complete puck tool set and specifically
sized bases and pins.
¾We advise users to use ONLY "ALS style" magnetic bases
(Hampton part HR4-779, CrystalCap Magnetic (ALS)).
¾The only pins which can be used with the automounter are the
"Hampton 18 mm" pins. This corresponds to breaking off the two end
segments of a Hampton pin.
Baseplate in dewar
base
RigakuAutomated Screening
ALS Style Automounter BluIce-Epics Screening Tab
¾ Users can bring their samples in pucks and load into the sample changer dewar.
¾ Users can also bring the spreadsheet containing the samples information, which will be loaded to BluIce-Epics
Screening Tab.
¾ User can select which samples to screen, and tasks to perform on them. Available tasks include auto-centering, taking
diffraction test images and analyzing with WebIce.
¾ BluIce-Epics screening tab talks to Robot server for mounting and dismounting samples.
¾ The Spreadsheet contain the filenames prefix and the directory information for saving diffraction images.
¾ If selected the collected images automatically be posted for Webice that provides crystal scoring and data collection strategy.
¾ For automated centering we have implemented interfaces to the XREC and C3D software packages developed at EMBL.
¾ We are developing new features for automated screening which are much more user friendly.Screening: Sample information Spreadsheet Instructions Only three of the columns present in the spreadsheet are used by the screening system as described here: Port:refers to a port in the puck. The robot will use this port to retrieve the sample. Don't change this column. CrystalID:this label is used by the screening system to generate filenames. It is recommended that a unique ID be used for each sample. Directory:If provided, this field will be used to generate subdirectories for each sample under the root screening directory. The default template Excel spreadsheet uses the Port as the subdirectory name.
Automated Screening

                         ALS Style Automounter                              BluIce-Epics Screening Tab

¾ Users can bring their samples in pucks and load into the sample changer dewar.
¾ Users can also bring the spreadsheet containing the samples information, which will be loaded to BluIce-Epics
Screening Tab.
¾ User can select which samples to screen, and tasks to perform on them. Available tasks include auto-centering, taking
diffraction test images and analyzing with WebIce.
¾ BluIce-Epics screening tab talks to Robot server for mounting and dismounting samples.
¾ The Spreadsheet contain the filenames prefix and the directory information for saving diffraction images.
¾ If selected the collected images automatically be posted for Webice that provides crystal scoring and data collection strategy.
¾ For automated centering we have implemented interfaces to the XREC and C3D software packages developed at EMBL.
¾ We are developing new features for automated screening which are much more user friendly.BluIce-Epics ScreeningTab
Automated Screening

                         ALS Style Automounter                              BluIce-Epics Screening Tab

¾ Users can bring their samples in pucks and load into the sample changer dewar.
¾ Users can also bring the spreadsheet containing the samples information, which will be loaded to BluIce-Epics Screening
Tab.
¾ User can select which samples to screen, and tasks to perform on them. Available tasks include auto-centering,
taking diffraction test images and analyzing with WebIce.
¾ BluIce-Epics screening tab talks to Robot server for mounting and dismounting samples.
¾ The Spreadsheet contain the filenames prefix and the directory information for saving diffraction images.
¾ If selected the collected images automatically be posted for Webice that provides crystal scoring and data collection strategy.
¾ For automated centering we have implemented interfaces to the XREC and C3D software packages developed at EMBL.
¾ We are developing new features for automated screening which are much more user friendly.Screening: WebIce
A. González, P. Moorhead, S. E. McPhillips, J. Song, K. Sharp, J. R. Taylor, P. D. Adams, N. K. Sauter and S. M.
Soltis "WebIce: integrated data collection and analysis for macromolecular crystallography." J. Appl. Cryst. 41, 176-184
(2008).
¾ WebIce is a web-browser application used for crystal scoring and data collection strategy calculations. It can be seen
as a pipeline of programs for processing test images
¾ User is authenticated when loading the spreadsheet into BluIce-Epics. The spreadsheet information is stored in the
crystal information server as a Sample Information List (SIL).
¾ During screening, the diffraction images and crystal images are posted to WebIce, and the crystal-analysis server
automatically indexes these images and generates a strategy. The SIL is updated with the crystal scoring parameters.
External software used by Web-Ice include:
¾ SPOTFINDER/DISTIL (diffraction spot location and image analysis): Z. Zhang, H. van den Bedem, N. K. Sauter, G. P.
Snell and A. Deacon J. Appl. Cryst. 39, 112-119. (2006).
¾ LABELIT (autoindexing): N. K. Sauter, R. W. Grosse-Kunstleve, and P. D. Adams. J. Appl. Cryst. 37, 399-409. (2004)
¾ MOSFLM (data integration and overlap analysis): A. G. W. Leslie; in Crystallographic Computing, Oxford University
Press. (1990)
¾ BEST (exposure time calculation and oscillation range): A. N. Popov and G. P. Bourenkov. Acta Cryst. D59, 1145-
1153. (2003)
¾ RADDOSE (absorbed dose calculation): J. W. Murray, E. F. Garman and R. B. G. Ravelli. J. Appl. Cryst. 37, 513-522.
(2004)WebIce: Screening Results
Score = 1.0 − (0.7 × e −4 / d ) − (1.5 × rsmr ) − (0.2 × μ )
Score: Calculated with above empirical formula where d is resolution limit in Å , rmsr is in mm, and µ
is the mosaicity in degrees.
A score of 0.4-0.6 indicates borderline quality. Good crystals usually have a score of about 0.8 or
higher.
This score is meant to be used as an initial indicator of the sample quality; although it has been found
to agree reasonably well with human assessment in many cases, it is recommended to inspect the
diffraction before choosing a sample for data collection.WebIce: Diffraction Inspection
Automated Screening

                        ALS Style Automounter                              BluIce-Epics Screening Tab

¾ Users can bring their samples in pucks and load into the sample changer dewar.
¾ Users can also bring the spreadsheet containing the samples information, which will be loaded to BluIce-Epics Screening
Tab.
¾ User can select which samples to screen, and tasks to perform on them. Available tasks include auto-centering, taking
diffraction test images and analyzing with WebIce.
¾ BluIce-Epics screening tab talks to Robot server for mounting and dismounting samples.
¾ The Spreadsheet contain the filenames prefix and the directory information for saving diffraction images.
¾ If selected the collected images automatically be posted for Webice that provides crystal scoring and data collection
strategy.
¾ For automated centering we have implemented interfaces to the XREC and C3D software packages developed at EMBL.
¾ We are developing new features for automated screening which are much more user friendly.BluIce-Epics: New Java Screening Tab
Scan Tab: interactive mode edge scans for determining inflection point

                                                      Fluor.signal tune

                                                    On-the-fly Edge Scans

                                                     Park Fluor.detector
Scan Tab: auto mode edge scans
Hardware-level sync
between motor position
and fluor.detector
measurements
3-region (fine steps
around the edge )
Chooch for data
analysis
Auto mode: auto ROI
selection from database
(no need to make choice
of ROI on the spectrum)You can also read