How Landsat Images are Made - Presentation by: NASA's Landsat Education and Public Outreach team June 2006
←
→
Page content transcription
If your browser does not render page correctly, please read the page content below
How Landsat Images are
                  Made

Presentation by:
NASA’s Landsat
Education and Public Outreach team
June 2006

                                     1
More than just a pretty picture

Landsat makes pretty weird looking maps, and it isn’t always easy to pick out things. And why do
they use such strange colors, anyway?
Here you can get an introduction to how these images are made. IMPORTANT: Do not expect to
internalize all this information at this stage: this is just an introduction.

                                                                                                   2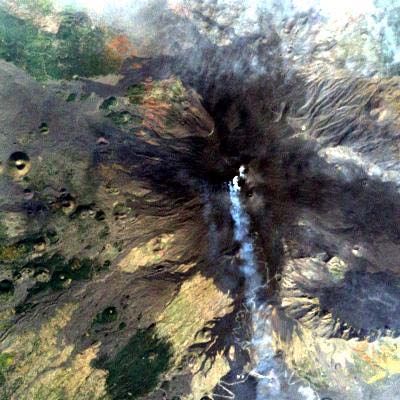
Think About Cameras vs.
      Sensors

                     Photograph vs. Image: What’s the difference?
                     Photographs are taken in the visible portion of
                     the spectrum.
                     Photographs are registered chemically on paper.
                     Sensors measure data in certain segments of
                     EMS (visible or not), digitally record that, and
                     then people convert this to color.

A common misconception about satellite images is that they are photographs. In fact, they are quite different. Satellites
use remote sensing to collect information digitally. People use computers to convert this information to images.
What is Remote Sensing? “Remote sensing is the process of gathering information about something without touching it.”
– NASA’s Observatorium
"Remote sensing is the science (and to some extent, art) of acquiring information about the Earth's surface without
actually being in contact with it. This is done by sensing and recording reflected or emitted energy and processing,
analyzing, and applying that information.” – Canadian Center for Remote Sensing

Electromagnetic energy may be detected either photographically or electronically. The photographic process uses
chemical reactions on the surface of light-sensitive film to detect and record energy variations. It is important to
distinguish between the terms images and photographs in remote sensing. An image refers to any pictorial
representation, regardless of what wavelengths or remote sensing device has been used to detect and record the
electromagnetic energy. A photograph refers specifically to images that have been detected as well as recorded on
photographic film. The black and white photo to the left, of part of the city of Ottawa, Canada was taken in the visible
part of the spectrum. Photos are normally recorded over the wavelength range from 0.3 mm to 0.9 mm - the visible and
reflected infrared. Based on these definitions, we can say that all photographs are images, but not all images are
photographs. Therefore, unless we are talking specifically about an image recorded photographically, we use the term
image. (Possible Exercise: GO TO Echo the Bat http://www.echothebat.com > IMAGERS Lesson 5 photo 1, image 2,
image 3

                                                                                                                        3
Electromagnetic Spectrum

                                                                       From Imagers (Echo the Bat)

Let’s think for just a minute about the Electromagnetic spectrum: Everything emits radiation. And,
everything illumined by our sun reflects radiation. It is this radiation that brings color to our lives: we
see various wavelengths of the visible portion of the spectrum and our brains process this
information, making it possible for us to see and process color. But our sensors (eyes) are not able
to see in other parts of the spectrum. Remote sensors allow us to “see” in other parts of the
spectrum. (That is, we cannot see outside the visible spectrum--x-ray, gamma ray, radio waves, for
example). Think about bee guides we cannot see with our own eyes, but when we use infrared
images, they become visible.

Important point! Different objects absorb and reflect different wavelengths. For example, green
vegetation reflects in the infrared quite well. This is why we can use remote sensing technology to
observe our world in new ways.

Engineers and scientists collaborate to design sensors to measure specific parts of the EMS in
order to measure certain things: land vs.. ocean vs.. atmosphere.

                                                                                                          4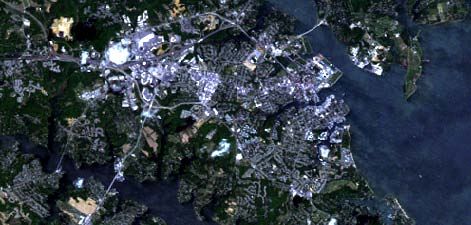
Seeing (infra)Red

                 Chlorophyll strongly absorbs radiation in the red and blue
                 wavelengths but reflects green wavelengths. (This is why healthy
                 vegetation appears green.)
                 The internal structure of healthy leaves act as excellent diffuse
                 reflectors of near-infrared wavelengths.
                 Measuring and monitoring the near-IR reflectance is one way that
                 scientists can determine how healthy (or unhealthy) vegetation may be.

Color in Leaves: A chemical compound in leaves called chlorophyll strongly absorbs radiation in
the red and blue wavelengths but reflects green wavelengths. Leaves appear "greenest" to us in
the summer, when chlorophyll content is at its maximum. In autumn, there is less chlorophyll in the
leaves, so there is less absorption and proportionately more reflection of the red wavelengths,
making the leaves appear red or yellow (yellow is a combination of red and green wavelengths).
The internal structure of healthy leaves act as excellent diffuse reflectors of near-infrared (IR)
wavelengths. If our eyes were sensitive to near-infrared, trees would appear extremely bright to us
at these wavelengths. In fact, measuring and monitoring the near-IR reflectance is one way that
scientists can determine how healthy (or unhealthy) vegetation may be.

                                                                                                  5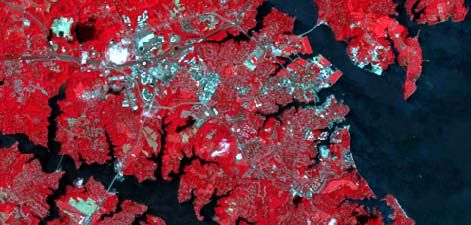
How we do Remote Sensing

Sensors on board satellites read amounts of reflected energy transmitted to them. These sensors
are “remotely sensing” the energy of objects below. This information is stored and converted to
picture format.

This diagram illustrates the entire process of remote sensing. We’ll be stepping through part of this
process here, in order to gain an understanding of what might or might not be available or
accomplished via remote sensing, and to enable you to begin to understand more about what an
image means when you look at one.

                                                                                                    6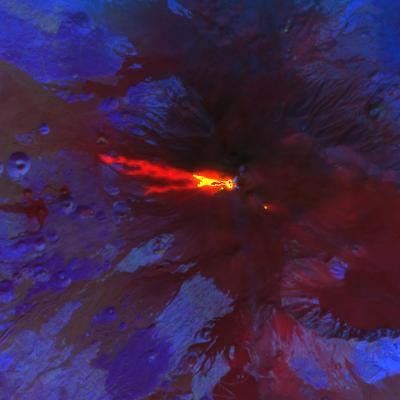
Sensor senses some segment
         of the Electromagnetic
                Spectrum
         • Reads the “spectral signature” of the surface
           that is reflecting/emitting light

Note: Each kind of thing reflects a different portion of the Electromagnetic spectrum. For example, leaves
reflect light differently than rocks or buildings. This is true for not just the visible portion of the spectrum, but
also for the invisible reflected energy (for example, UV light, or infrared).

From Echo the Bat (http://www.echothebat.com/) “Understanding Light Lesson 2”: Explain to students that
there are scientists who study the amount of light objects reflect. When scientists study the Earth from
space, they look at the color of light reflected. The amount of light reflected describes the characteristic of
an object. Using the chart they just created, have the students graph the amount of light reflected by the
objects they used in the activity on worksheet 2. The y-axis will be the amount of reflected light and the x-
axis will be the red, green, and blue light.
After students complete this, explain that scientists use sensors which look at the amount of light an object
reflects, such as a rock or a pond. These sensors give a numeric value for the amount of light reflected, then
this data is graphed. The graphs, also called spectral signatures, of different objects such as a rock, water,
or a plant are unique. By knowing the "signature" of a particular object, a scientist can identify similar objects
over a large geographic area.
Because the amount of light reflected can be represented by numbers, by having just the numbers, we can
make an image. Give students the digital picture worksheet. Before creating the digital picture, have
students label the intersections of the venn diagram with the corresponding colors. Then, as a class,
determine the colors represented by the combinations of numbers. Have students color in the picture using
that key.
                                                                                                                        7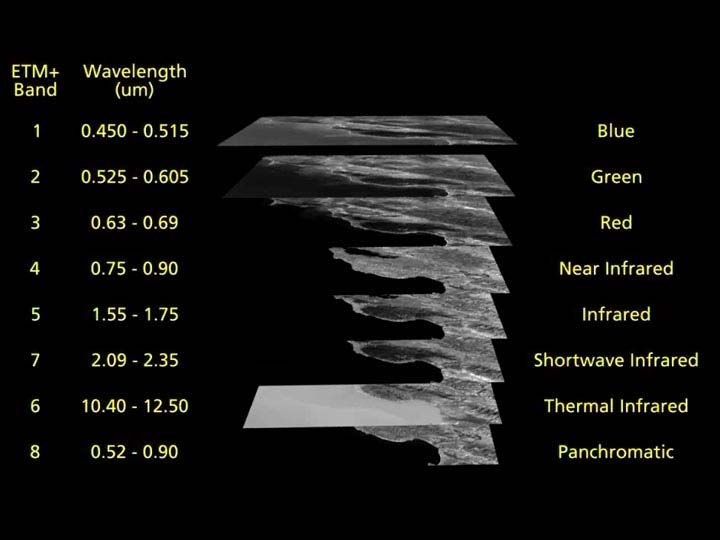
Sensors Record Intensity of
     Reflected Energy Numerically

Just like the pictures on your television set, satellite imagery is made up of tiny squares, each of a different gray shade or color.
These squares are called pixels—short for picture elements—and represent the relative reflected light energy recorded for that part
of the image. Sensors that record electromagnetic energy, electronically record the energy as an array of numbers in digital format.

Satellite sensors record the information as a single numeric value corresponding to the intensity of the energy they detect for a
given area. In the case of Landsat, the sensor measures the amount of reflected energy for each 30mX30m area. It does this for
each of seven segments of the electromagnetic spectrum. It stores the values for each segment of the spectrum separately. These
numbers are recorded, and can be converted to a grey-scale to produce a black and white image in pixel form.

How does the computer know which parts of the image should be dark and which one should be bright? Computers understand the
numeric language of binary numbers, which are sets of numbers consisting of 0s and 1s that act as an "on-off" switch. Converting
from our decimal system to binary numbers, 00 = 0, 01 = 1, 10 = 2, 11 = 3. Note that we cannot use decimal numbers since all
computers are fussy—they only like "on" and "off."

For example, consider an image that is made up of 8 columns by 5 rows of pixels. In this figure, four shades are present: black, dark
gray, light gray and white. The darkest point is assigned the binary number 00, dark gray as 01, light gray as 10, and the brightest
part the binary number 11. We therefore have four pixels (B5, C4, D7 and E2) that the spacecraft says are 00. There are three dark
gray pixels (B3, C2, C6 and E6) assigned the binary number 01, three light gray pixels (D3, D6 and E5) that are binary number 10,
and 29 white pixels are assigned the binary number 11.
Four shades between white and black would produce images with too much contrast, so instead of using binary numbers between
00 and 11, spacecraft use a string of 8 binary numbers (called "8-bit data"), which can range from 00000000 to 11111111. These
numbers correspond from 0 to 255 in the decimal system. With 8-bit data, we can assign the darkest point in an image to the
number 00000000, and the brightest point in the image to 11111111. This produces 256 shades of gray between black and white. It
is these binary numbers between 0 and 255 that the spacecraft sends back for each pixel in every row and column—and it takes a
computer to keep track of every number for every pixel!
For an exercise, there’s a nice one on pixels in Echo the bat (http://www.echothebat.com/)

                                                                                                                                    8
The amount of the reflected energy
or intensity is recorded for each pixel,
in each band, on a scale of 0-255.
For Landsat, there are 7 bands of data. Each band of data provides a record of the amount of
energy reflected in a specific portion of the electromagnetic spectrum. For example band 4
measures the intensity of Near Infrared energy reflected, and Band 3 measures the intensity of
green light reflected. For each pixel in each band of data, there is a numerical value given to the
amount of energy reflected from the Earth’s surface for that 30 X 30 meter square.
WHY IS THIS IMPORTANT? Because of the numerical values, scientists can use software
programs (for example Geographic Information Systems, or “GIS”), and write algorithms to quantify
land cover and land use from these data. They use this information to study many aspects of our
planet, from disease to forest fire, to agribusiness, flood predictions, etc.
This kind of information is not attainable with conventional photographs.
9Assigning Colors to Bands
Humans also need visual representations of these data, to better understand the information. To
make an image more readable by people, we convert the numeric scale to color. For each “band”
of the data, we can assign a color, such that instead of gradations of black and white, we would get,
say, gradations of red.
Beside making pretty pictures, why do we assign colors to certain bands?
The human eye is not sensitive to ultra-violet or infrared light. To build a composite image from
remote sensing data that makes sense to our eyes, we must use colors from the visible portion of
the EM spectrum—red, green, and blue.
10With Landsat 7, there are 7 bands to choose from.
To see this QuickTime file play, download the Landsat 7 San Francisco Onionskin animation,
created by Jesse Allen.
11Visible Infrared
1 2 3 4 5 6 7
3,2,1
Green
Blue
Red Data is shown as Red
Green
Blue
Here is an example of part of a Landsat “scene.” Note that all seven bands of data are in grey
scale, even those that represent visible portions of the spectrum (blue, green or red reflected light),
until we assign a color to the data. In this case we assigned the color blue to the band that
represents blue light, the color green to the band representing green light, and red to the band of
data representing red light. This produces what is called a “true color” image, akin to what one
would see if they could ride atop one of these satellites (and used super-powered binoculars!)
12Visible Infrared
1 2 3 4 5 6 7
4,3,2
Green
Red
NIRData
Data
Dataisisisshown
shown
shownasas
asGreen
Red
Blue
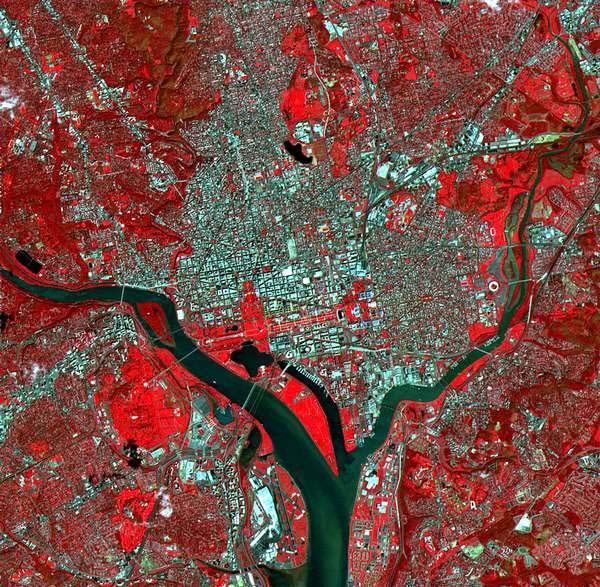
Sometimes, to make things easier for our eyes to see, we use “false color.” One typical band
combination for this is 4,3,2. Here band 4 (the near infra red) is assigned the color red. Band 3
(representing light reflecting in the red portion of the spectrum) is assigned the color green, and
band 2 (what you and I would see as green) is assigned the color blue.
Why do this? Recall that healthy vegetation reflects strongly in the near infra-red. If we color
vegetation red, our eyes pick that out most clearly. In 4,3,2 combinations, the blue-green indicates
the built environment (roads, pavement, buildings). Black or dark blue indicates water (or cloud
shadows!)
13Producing…more than just a
pretty picture!
Bands 3, 2, 1 (visible light) Bands 6, 5, 4 (infrared light)
Mt Etna erupting shows some of the value of using more than one kind of band combination…
We couldn’t possibly accomplish this “color compositing” in a timely fashion if we had to do it
manually. Image processing software including MultiSpec generates a satellite image using three
spectral bands (wavelength ranges) of data, (whichever ones a user chooses to use) and combines
them to create a color composite image.
Now you know that a satellite image is much more than a picture. Each pixel has a numeric
representation of the amount of energy reflected in each of three selected wavelengths. And this
information can be used to make numerous measurements.
Possible teacher/student exercise:
By adding up the number of pixels or squares in a grid overlay on an image, students can calculate
the area of land cover type in a scene. For example, if red in a false-color image represents
vegetation, students can count the number of red pixels and multiply that number by the area of
each pixel to determine the total area covered with vegetation.
14You can also read


